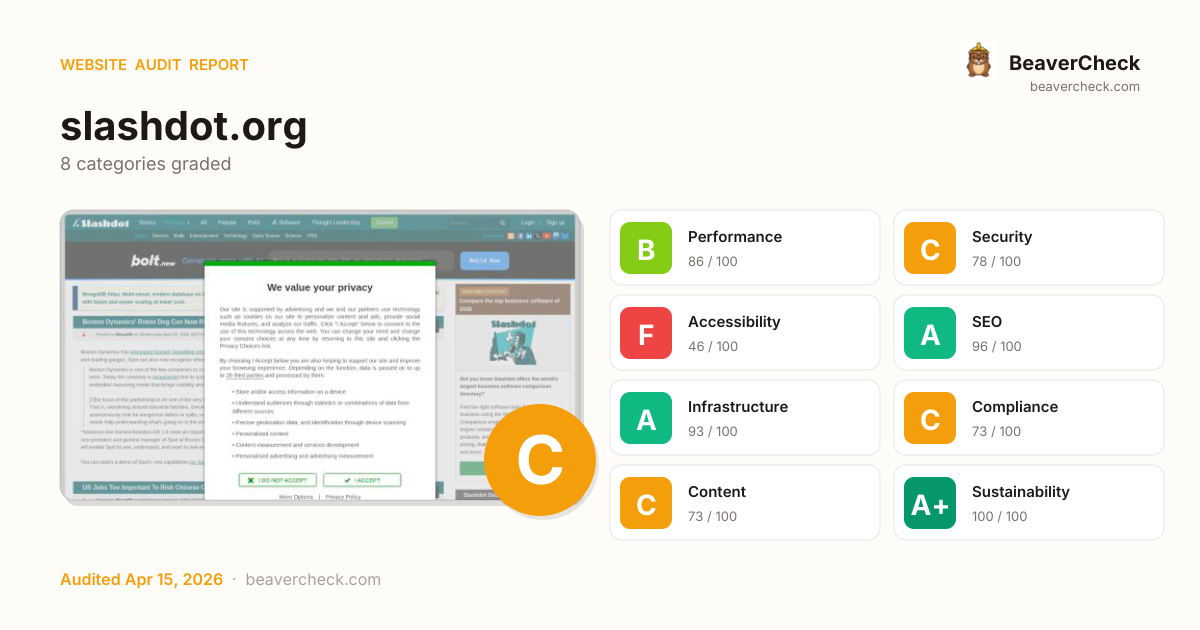
Mobile 375 × 812

Desktop 1440 × 900

Score: 78 / 100
Based on 8 categories, 0 sections
Fast site — your users get a smooth experience.
Good foundation, but a few gaps could be exploited.
Major barriers for users with disabilities — up to 15% of your audience.
Well-optimized for search — your content is discoverable.
Solid infrastructure — fast server responses across the board.
Mostly compliant — a few items need attention.
Good content signals with minor gaps.
Lean and efficient — low environmental impact per visit.
The overall score is a weighted average of individual category scores. Categories with more impact on user experience and security carry more weight.
Weights reflect general web best practices. Individual needs may differ.
'unsafe-eval' found in script source
Security gaps expose your site and users to attacks, eroding trust.
'unsafe-inline' found in script source
Security gaps expose your site and users to attacks, eroding trust.
1 button(s) with no accessible text
Accessibility issues exclude users with disabilities — up to 15% of your potential audience.
19 control(s) without accessible label
Accessibility issues exclude users with disabilities — up to 15% of your potential audience.
4 link(s) with no accessible text
Accessibility issues exclude users with disabilities — up to 15% of your potential audience.
High impact, low effort — start here.
High impact, requires investment.
Small gains, minimal effort.
Nothing in this quadrant — good news.
Low impact, high effort — do last.
Nothing in this quadrant — good news.
[](https://beavercheck.com/results/065cdbdd-f96c-4d8e-a514-163277b11b0a)<a href="https://beavercheck.com/results/065cdbdd-f96c-4d8e-a514-163277b11b0a"><img src="https://beavercheck.com/badge?url=https%3A%2F%2Fslashdot.org" alt="BeaverCheck Score"></a>https://beavercheck.com/badge?url=https%3A%2F%2Fslashdot.orgThis badge auto-updates with your latest scan result.
Your site performs reasonably well, but a few targeted fixes could meaningfully improve results. Accessibility issues exclude users who rely on assistive technology — an estimated 15% of your potential audience. Addressing the critical issues below would have the most immediate impact on your user trust.
€468 investment → €4,167/month returns + EUR 120,500,000 risk avoided
€468
6h · 5 findings
€4,167 /mo
~€50,005 / year
EUR 120,500,000
if kept compliant
€85 — in quick wins — start here for the fastest payback
Figures combine localized regulatory fine ceilings, search/conversion value priced against local CPC, and bandwidth waste estimates. Results depend on implementation quality and audience composition. Not legal or financial advice.
5.5 developer hours at €85/hr
Based on European Union rates (€85/hr)
Start here for the best return on investment
€10,041,667 / month at risk
~€120,500,002 / year if left unfixed
€120,500,000
+8 more
€0.18 /mo
2404.9 MB/mo × 0.074 EUR/GB
Compliance figures represent the statutory maximum fine for the most severe triggered category, capped per regulation — not the sum of per-finding penalties. Based on published regulatory fine ranges. This is not legal advice.
Unique monthly visitors from your analytics
Purchases, signups, or key actions
Optional — for revenue estimation
more engaged visitors from reduced bounce
Fix 5 critical issues to capture this value
Based on Google/Deloitte research ("Milliseconds Make Millions") showing a ~7% bounce rate increase per additional second of LCP above the 2.5s "Good" threshold.
Your site's LCP: → estimated after fixes.
These are estimates based on industry research — actual results vary
Your data stays in your browser — nothing is sent to our servers
Thanks for your feedback!
We'll use a cached audit if available, or offer to scan.
Industry-standard audits powered by Google Lighthouse.
Key metrics that affect user experience.
First Contentful Paint First Contentful Paint — how long until the browser renders the first piece of content. Under 1.8s is good.
3.66 s
Largest Contentful Paint Largest Contentful Paint — how long until the largest visible element loads. Under 2.5s is good.
6.76 s
Total Blocking Time Total Blocking Time — total time the main thread was blocked, preventing user input. Under 200ms is good.
427 ms
Cumulative Layout Shift Cumulative Layout Shift — measures visual stability. How much the page layout shifts during loading. Under 0.1 is good.
0.445
Speed Index Speed Index — how quickly content is visually displayed during load. Under 3.4s is good.
3.66 s
Time to Interactive Time to Interactive — how long until the page is fully interactive and responds to user input. Under 3.8s is good.
6.76 s
Audit breakdown by category with detailed findings.
Remove large, duplicate JavaScript modules from bundles to reduce unnecessary bytes consumed by network activity.
Performance issues directly impact user engagement and conversion rates.
Polyfills and transforms enable older browsers to use new JavaScript features. However, many aren't necessary for modern browsers. Consider modifying your JavaScript build process to not transpile Baseline features, unless you know you must support older browsers. Learn why most sites can deploy ES6+ code without transpiling
Shipping ES5 transpiled code to modern browsers wastes bytes — every user with an evergreen browser pays for compatibility you don't need.
Most users today run browsers that natively support ES6+, async/await, optional chaining, and the rest of modern JavaScript. Transpiling to ES5 'just in case' adds 20-40% to your bundle for no benefit. Configure your build to target a modern browserslist, or ship a differential bundle pair (modern + legacy) with the module/nomodule pattern.
Source: Google web.dev / Lighthouse
3rd party code can significantly impact load performance. Reduce and defer loading of 3rd party code to prioritize your page's content.
Performance issues directly impact user engagement and conversion rates.
A long cache lifetime can speed up repeat visits to your page. Learn more about caching.
Performance issues directly impact user engagement and conversion rates.
| Request | Cache TTL | Transfer Size |
|---|---|---|
| cdn.consentmanager.net/delivery/js/cmp_en.min.js | 86400.0 s | 100.5 KiB |
| /delivery/customdata/bV8xLndfMTIxMjYucl9HRFBSLmxfZW4uZF8y... | 3600.0 s | 16.1 KiB |
| m.slashdot.org/cdn-cgi/challenge-platform/h/g/scripts/jsd/b0a7532ac8ec/main.js? | 14400.0 s | 12.0 KiB |
Layout shifts occur when elements move absent any user interaction. Investigate the causes of layout shifts, such as elements being added, removed, or their fonts changing as the page loads.
Performance issues directly impact user engagement and conversion rates.
Your first network request is the most important. Reduce its latency by avoiding redirects, ensuring a fast server response, and enabling text compression.
Performance issues directly impact user engagement and conversion rates.
Reducing the download time of images can improve the perceived load time of the page and LCP. Learn more about optimizing image size
Performance issues directly impact user engagement and conversion rates.
| URL | Resource Size | Est Savings | |
|---|---|---|---|
126 tbody > tr > td.comment-count > span | a.fsdn.com/sd/m/assets/generated_sprites/preload-sprites.png | 59.9 KiB | 23.8 KiB |
Bolt Logo body.android > div#vibe-code > div#vibe-banner-link > img | a.fsdn.com/con/img/bolt.png | 10.0 KiB | 10.0 KiB |
Login
Stories
Polls
Firehose
Software
Thought Leadership
Sony Boss Urges Theate… div#home > div.stages > div.stage-center > div.river-prop | a.fsdn.com/sd/m/assets/white_background2X.png | 9.8 KiB | 6.2 KiB |
Avoid chaining critical requests by reducing the length of chains, reducing the download size of resources, or deferring the download of unnecessary resources to improve page load.
Performance issues directly impact user engagement and conversion rates.
Requests are blocking the page's initial render, which may delay LCP. Deferring or inlining can move these network requests out of the critical path.
Performance issues directly impact user engagement and conversion rates.
| URL | Transfer Size | Duration |
|---|---|---|
| a.fsdn.com/sd/m/assets/application.min.js?v=2.21 | 53.4 KiB | 308 ms |
| a.fsdn.com/sd/m/assets/application.min.css?v=2.9 | 56.1 KiB | 1.1 s |
| a.fsdn.com/con/js/sftheme/cmp2.js?2025-07 | 21.7 KiB | 154 ms |
| a.fsdn.com/sd/m/assets/standard_libs-7713187021bd1ae9f75af9293a0ac4ea.js | 35.8 KiB | 154 ms |
| a.fsdn.com/sd/m/assets/ccpa.css?v=3 | 1.2 KiB | |
| a.fsdn.com/con/css/sftheme/sandiego/cmp.css?2024-12-10 | 1.3 KiB |
These insights are also available in the Chrome DevTools Performance Panel - record a trace to view more detailed information.
Redirects introduce additional delays before the page can be loaded. Learn how to avoid page redirects.
Performance issues directly impact user engagement and conversion rates.
| URL | Time Spent |
|---|---|
| slashdot.org/ | 983 ms |
| m.slashdot.org/ | 0.0 ms |
These are the largest layout shifts observed on the page. Each table item represents a single layout shift, and shows the element that shifted the most. Below each item are possible root causes that led to the layout shift. Some of these layout shifts may not be included in the CLS metric value due to windowing. Learn how to improve CLS
Performance issues directly impact user engagement and conversion rates.
| Element | Layout shift score |
|---|---|
Submit
Terms
Privacy
Feedback
Privacy Opts
Non-mobile
Software
follow us
Copy… div.stages > div.stage-center > div.river-prop > div#footer | 0.443 |
follow us
Copyright © 2026 Slashdot Media.
All Rights Reserved. div.stage-center > div.river-prop > div#footer > div.bottom | 0.001 |
Privacy Opts div#footer > ul > li > a | 0.000 |
Time to Interactive is the amount of time it takes for the page to become fully interactive. Learn more about the Time to Interactive metric.
Performance issues directly impact user engagement and conversion rates.
The maximum potential First Input Delay that your users could experience is the duration of the longest task. Learn more about the Maximum Potential First Input Delay metric.
Performance issues directly impact user engagement and conversion rates.
Reduce unused rules from stylesheets and defer CSS not used for above-the-fold content to decrease bytes consumed by network activity. Learn how to reduce unused CSS.
Performance issues directly impact user engagement and conversion rates.
| URL | Transfer Size | Est Savings |
|---|---|---|
| a.fsdn.com/sd/m/assets/application.min.css?v=2.9 | 56.0 KiB | 51.8 KiB |
Reduce unused JavaScript and defer loading scripts until they are required to decrease bytes consumed by network activity. Learn how to reduce unused JavaScript.
Multi-megabyte JavaScript bundles delay every interactive feature on the page.
This is the Lighthouse audit fired when too much JS is shipped relative to what executes. The fix isn't a config flag — it requires bundle analysis (webpack-bundle-analyzer, rollup-plugin-visualizer), splitting routes into chunks, lazy-loading off-screen components, and removing unused dependencies. Fundamentally different from minification: minifying reduces byte count, this reduces what's downloaded at all.
Source: Google web.dev / Lighthouse
| URL | Transfer Size | Est Savings |
|---|---|---|
| cdn.consentmanager.net/delivery/js/cmp_en.min.js | 100.1 KiB | 35.8 KiB |
| a.fsdn.com/sd/m/assets/application.min.js?v=2.21 | 53.4 KiB | 35.1 KiB |
Minifying JavaScript files can reduce payload sizes and script parse time. Learn how to minify JavaScript.
Performance issues directly impact user engagement and conversion rates.
| URL | Transfer Size | Est Savings |
|---|---|---|
| a.fsdn.com/con/js/sftheme/cmp2.js?2025-07 | 21.7 KiB | 8.6 KiB |
Set an explicit width and height on image elements to reduce layout shifts and improve CLS. Learn how to set image dimensions
Performance issues directly impact user engagement and conversion rates.
| URL | |
|---|---|
Bolt Logo body.android > div#vibe-code > div#vibe-banner-link > img | a.fsdn.com/con/img/bolt.png |
More information about the performance of your application. These numbers don't directly affect the Performance score.
These checks highlight opportunities to improve the accessibility of your web app. Automatic detection can only detect a subset of issues and does not guarantee the accessibility of your web app, so manual testing is also encouraged.
Properly ordered headings that do not skip levels convey the semantic structure of the page, making it easier to navigate and understand when using assistive technologies. Learn more about heading order.
Performance issues directly impact user engagement and conversion rates.
| Failing Elements |
|---|
Sony Boss Urges Theaters To Stop 30 Minutes of Trailers and Ads Before Movies tbody > tr > td.details > h4.longTitle |
These are opportunities to improve keyboard navigation in your application.
If a page doesn't specify a `lang` attribute, a screen reader assumes that the page is in the default language that the user chose when setting up the screen reader. If the page isn't actually in the default language, then the screen reader might not announce the page's text correctly. Learn more about the `lang` attribute.
Performance issues directly impact user engagement and conversion rates.
| Failing Elements |
|---|
html html |
These are opportunities to improve the interpretation of your content by users in different locales.
Link text (and alternate text for images, when used as links) that is discernible, unique, and focusable improves the navigation experience for screen reader users. Learn how to make links accessible.
Performance issues directly impact user engagement and conversion rates.
| Failing Elements |
|---|
div#footer > div.bottom > div.follow > a.social div#footer > div.bottom > div.follow > a.social |
These are opportunities to improve the semantics of the controls in your application. This may enhance the experience for users of assistive technology, like a screen reader.
Deprecated APIs will eventually be removed from the browser. Learn more about deprecated APIs.
Performance issues directly impact user engagement and conversion rates.
| Deprecation / Warning | Source |
|---|---|
| SharedStorage | |
| StorageType.persistent is deprecated. Please use standardized navigator.storage instead. | |
| Fledge |
Errors logged to the console indicate unresolved problems. They can come from network request failures and other browser concerns. Learn more about this errors in console diagnostic audit
Performance issues directly impact user engagement and conversion rates.
| Source | Description |
|---|---|
Failed to load resource: the server responded with a status of 404 () |
These checks ensure that your page is following basic search engine optimization advice. There are many additional factors Lighthouse does not score here that may affect your search ranking, including performance on Core Web Vitals. Learn more about Google Search Essentials.
Meta descriptions may be included in search results to concisely summarize page content. Learn more about the meta description.
Performance issues directly impact user engagement and conversion rates.
Canonical links suggest which URL to show in search results. Learn more about canonical links.
Performance issues directly impact user engagement and conversion rates.
Format your HTML in a way that enables crawlers to better understand your app’s content.
Industry-standard audits powered by Google Lighthouse. — Desktop
Key metrics that affect user experience. — Desktop
First Contentful Paint First Contentful Paint — how long until the browser renders the first piece of content. Under 1.8s is good.
888 ms
Largest Contentful Paint Largest Contentful Paint — how long until the largest visible element loads. Under 2.5s is good.
1.22 s
Total Blocking Time Total Blocking Time — total time the main thread was blocked, preventing user input. Under 200ms is good.
0 ms
Cumulative Layout Shift Cumulative Layout Shift — measures visual stability. How much the page layout shifts during loading. Under 0.1 is good.
0.443
Speed Index Speed Index — how quickly content is visually displayed during load. Under 3.4s is good.
1.00 s
Time to Interactive Time to Interactive — how long until the page is fully interactive and responds to user input. Under 3.8s is good.
1.22 s
Audit breakdown by category with detailed findings.
Remove large, duplicate JavaScript modules from bundles to reduce unnecessary bytes consumed by network activity.
Performance issues directly impact user engagement and conversion rates.
Polyfills and transforms enable older browsers to use new JavaScript features. However, many aren't necessary for modern browsers. Consider modifying your JavaScript build process to not transpile Baseline features, unless you know you must support older browsers. Learn why most sites can deploy ES6+ code without transpiling
Shipping ES5 transpiled code to modern browsers wastes bytes — every user with an evergreen browser pays for compatibility you don't need.
Most users today run browsers that natively support ES6+, async/await, optional chaining, and the rest of modern JavaScript. Transpiling to ES5 'just in case' adds 20-40% to your bundle for no benefit. Configure your build to target a modern browserslist, or ship a differential bundle pair (modern + legacy) with the module/nomodule pattern.
Source: Google web.dev / Lighthouse
3rd party code can significantly impact load performance. Reduce and defer loading of 3rd party code to prioritize your page's content.
Performance issues directly impact user engagement and conversion rates.
Layout shifts occur when elements move absent any user interaction. Investigate the causes of layout shifts, such as elements being added, removed, or their fonts changing as the page loads.
Performance issues directly impact user engagement and conversion rates.
Consider setting font-display to swap or optional to ensure text is consistently visible. swap can be further optimized to mitigate layout shifts with font metric overrides.
Performance issues directly impact user engagement and conversion rates.
| URL | Est Savings |
|---|---|
| a.fsdn.com/sd/font/sdicon.woff?a6bec9f7b7c53257 | 80 ms |
Avoid chaining critical requests by reducing the length of chains, reducing the download size of resources, or deferring the download of unnecessary resources to improve page load.
Performance issues directly impact user engagement and conversion rates.
Requests are blocking the page's initial render, which may delay LCP. Deferring or inlining can move these network requests out of the critical path.
Performance issues directly impact user engagement and conversion rates.
| URL | Transfer Size | Duration |
|---|---|---|
| a.fsdn.com/sd/all-minified.js?a6bec9f7b7c53257 | 127.9 KiB | 120 ms |
| a.fsdn.com/sd/css/app.css?a6bec9f7b7c53257 | 23.7 KiB | |
| a.fsdn.com/sd/js/scripts/ad_top.js?a6bec9f7b7c53257 | 110 B | |
| a.fsdn.com/sd/classic.ssl.css?a6bec9f7b7c53257 | 34.3 KiB | 274 ms |
| a.fsdn.com/con/js/sftheme/cmp-slashdot.js?2026-04-09 | 21.8 KiB | |
| a.fsdn.com/con/css/sftheme/sandiego/cmp.css?2026-04-09 | 1.3 KiB | |
| a.fsdn.com/sd/js/scripts/asg_embed.js?a6bec9f7b7c53257 | 281 B |
A long cache lifetime can speed up repeat visits to your page. Learn more about caching.
Performance issues directly impact user engagement and conversion rates.
| Request | Cache TTL | Transfer Size |
|---|---|---|
| cdn.consentmanager.net/delivery/js/cmp_en.min.js | 86400.0 s | 100.5 KiB |
| /delivery/customdata/bV8xLndfMTIxMjYucl9HRFBSLmxfZW4uZF8y... | 3600.0 s | 16.1 KiB |
| slashdot.org/cdn-cgi/challenge-platform/h/g/scripts/jsd/b0a7532ac8ec/main.js? | 14400.0 s | 12.2 KiB |
| slashdot.org/images/js.gif?601 | 0.0 ms | 228 B |
Reducing the download time of images can improve the perceived load time of the page and LCP. Learn more about optimizing image size
Performance issues directly impact user engagement and conversion rates.
| URL | Resource Size | Est Savings | |
|---|---|---|---|
MongoDB div.sticky-inner > div.sticky-left > div.sticky-brand > img | a.fsdn.com/con/img/hi-text.png | 12.6 KiB | 12.4 KiB |
Piracy header > span#topic-181720598 > a > img | a.fsdn.com/sd/topics/piracy_64.png | 5.2 KiB | 5.0 KiB |
AI header > span#topic-181720862 > a > img | a.fsdn.com/sd/topics/ai_64.png | 4.8 KiB | 4.5 KiB |
These insights are also available in the Chrome DevTools Performance Panel - record a trace to view more detailed information.
Minifying CSS files can reduce network payload sizes. Learn how to minify CSS.
Performance issues directly impact user engagement and conversion rates.
| URL | Transfer Size | Est Savings |
|---|---|---|
| a.fsdn.com/sd/classic.ssl.css?a6bec9f7b7c53257 | 34.3 KiB | 6.8 KiB |
| a.fsdn.com/sd/css/app.css?a6bec9f7b7c53257 | 23.7 KiB | 5.8 KiB |
Reduce unused rules from stylesheets and defer CSS not used for above-the-fold content to decrease bytes consumed by network activity. Learn how to reduce unused CSS.
Performance issues directly impact user engagement and conversion rates.
| URL | Transfer Size | Est Savings |
|---|---|---|
| a.fsdn.com/sd/classic.ssl.css?a6bec9f7b7c53257 | 34.2 KiB | 30.2 KiB |
| a.fsdn.com/sd/css/app.css?a6bec9f7b7c53257 | 23.7 KiB | 20.8 KiB |
Reduce unused JavaScript and defer loading scripts until they are required to decrease bytes consumed by network activity. Learn how to reduce unused JavaScript.
Multi-megabyte JavaScript bundles delay every interactive feature on the page.
This is the Lighthouse audit fired when too much JS is shipped relative to what executes. The fix isn't a config flag — it requires bundle analysis (webpack-bundle-analyzer, rollup-plugin-visualizer), splitting routes into chunks, lazy-loading off-screen components, and removing unused dependencies. Fundamentally different from minification: minifying reduces byte count, this reduces what's downloaded at all.
Source: Google web.dev / Lighthouse
| URL | Transfer Size | Est Savings |
|---|---|---|
| a.fsdn.com/sd/all-minified.js?a6bec9f7b7c53257 | 127.8 KiB | 92.3 KiB |
| cdn.consentmanager.net/delivery/js/cmp_en.min.js | 100.1 KiB | 35.8 KiB |
Minifying JavaScript files can reduce payload sizes and script parse time. Learn how to minify JavaScript.
Performance issues directly impact user engagement and conversion rates.
| URL | Transfer Size | Est Savings |
|---|---|---|
| a.fsdn.com/con/js/sftheme/cmp-slashdot.js?2026-04-09 | 21.7 KiB | 8.7 KiB |
| a.fsdn.com/con/js/sandiego/floating-unit.js?2026-04-09 | 9.4 KiB | 3.3 KiB |
Set an explicit width and height on image elements to reduce layout shifts and improve CLS. Learn how to set image dimensions
Performance issues directly impact user engagement and conversion rates.
| URL | |
|---|---|
MongoDB div.sticky-inner > div.sticky-left > div.sticky-brand > img | a.fsdn.com/con/img/hi-text.png |
article#firehose-1127235O3 > div.body > div.ntv-preview-img-wrapper > img.nel-image article#firehose-1127235O3 > div.body > div.ntv-preview-img-wrapper > img.nel-image | |
article#firehose-11276O211 > div.body > div.ntv-preview-img-wrapper > img.nel-image article#firehose-11276O211 > div.body > div.ntv-preview-img-wrapper > img.nel-image | |
body.anon > img body.anon > img | slashdot.org/images/js.gif?601 |
More information about the performance of your application. These numbers don't directly affect the Performance score.
These are the largest layout shifts observed on the page. Each table item represents a single layout shift, and shows the element that shifted the most. Below each item are possible root causes that led to the layout shift. Some of these layout shifts may not be included in the CLS metric value due to windowing. Learn how to improve CLS
Performance issues directly impact user engagement and conversion rates.
| Element | Layout shift score |
|---|---|
Boston Dynamics' Robot Dog Can Now Read Gauges, Spot Spills, and Reason (ieee.o… div.main-content > div#firehose > div#firehoselist > article#firehose-181721730 | 0.279 |
MongoDB Atlas: Multi-cloud, modern database on AWS, Azure, and Google Cloud. Ge… body.anon > section > div.container | 0.066 |
By the end of 2026, how useful do you think agentic/multi-agent AI systems will… aside#slashboxes > article.nosort > section#poll-content > div.units-6 | 0.032 |
These checks highlight opportunities to improve the accessibility of your web app. Automatic detection can only detect a subset of issues and does not guarantee the accessibility of your web app, so manual testing is also encouraged.
ARIA roles must have valid values in order to perform their intended accessibility functions. Learn more about valid ARIA roles.
Performance issues directly impact user engagement and conversion rates.
| Failing Elements |
|---|
Topics:
Devices
Build
Entertainment
Technology
Open Source
Science
… body.anon > div.container > div.nav-secondary-wrap > nav.nav-secondary |
Today
Tuesday
Monday
Sunday
Saturday
Friday
Thursday
Wednesday
Submit Story body.anon > footer#fhft > nav |
FAQ Story Archive Hall of Fame Advertising Terms Privacy Statement About Feedba… body.anon > footer#ft > nav.grid_10 |
These are opportunities to improve the usage of ARIA in your application which may enhance the experience for users of assistive technology, like a screen reader.
When a button doesn't have an accessible name, screen readers announce it as "button", making it unusable for users who rely on screen readers. Learn how to make buttons more accessible.
Performance issues directly impact user engagement and conversion rates.
| Failing Elements |
|---|
nav.nav-user > div#main-top-nav-wrapper > form#search > button.btn nav.nav-user > div#main-top-nav-wrapper > form#search > button.btn |
Informative elements should aim for short, descriptive alternate text. Decorative elements can be ignored with an empty alt attribute. Learn more about the `alt` attribute.
Performance issues directly impact user engagement and conversion rates.
| Failing Elements |
|---|
article#firehose-1127235O3 > div.body > div.ntv-preview-img-wrapper > img.nel-image article#firehose-1127235O3 > div.body > div.ntv-preview-img-wrapper > img.nel-image |
article#firehose-11276O211 > div.body > div.ntv-preview-img-wrapper > img.nel-image article#firehose-11276O211 > div.body > div.ntv-preview-img-wrapper > img.nel-image |
body.anon > img body.anon > img |
These are opportunities to improve the semantics of the controls in your application. This may enhance the experience for users of assistive technology, like a screen reader.
Low-contrast text is difficult or impossible for many users to read. Learn how to provide sufficient color contrast.
Performance issues directly impact user engagement and conversion rates.
| Failing Elements |
|---|
I DO NOT ACCEPT div.cmpboxbtns > span#cmpwelcomebtnno > a.cmpboxbtn > span#cmpbntnotxt |
I ACCEPT div.cmpboxbtns > span#cmpwelcomebtnyes > a.cmpboxbtn > span#cmpbntyestxt |
Firehose ul.nav-site > li > ul.filter-firehose > li.nav-label |
Submit div.container > div.nav-wrap > nav.nav-primary > a.btn |
form#search > div.form-group > div.input-group > input form#search > div.form-group > div.input-group > input |
or nav.nav-user > div#main-top-nav-wrapper > ul.user-access > li.nav-label |
Topics: div.nav-secondary-wrap > nav.nav-secondary > ul > li.nav-label |
Follow us: div.nav-secondary-wrap > nav.nav-social > ul > li.nav-label |
(ieee.org) h2.story > span#title-181721730 > span.no > a.story-sourcelnk |
(arstechnica.com) h2.story > span#title-181721070 > span.no > a.story-sourcelnk |
Sponsored Content header > div.ntv-sponsored-disclaimer > a.ntv_link777074-148399 > span |
Compare Now article#firehose-1127235O3 > div.body > div.p > span.nel-button |
(cnn.com) h2.story > span#title-181720998 > span.no > a.story-sourcelnk |
(torrentfreak.com) h2.story > span#title-181720598 > span.no > a.story-sourcelnk |
(yahoo.com) h2.story > span#title-181717058 > span.no > a.story-sourcelnk |
(variety.com) h2.story > span#title-181711680 > span.no > a.story-sourcelnk |
(nytimes.com) h2.story > span#title-181716852 > span.no > a.story-sourcelnk |
(cordcuttersnews.com) h2.story > span#title-181712216 > span.no > a.story-sourcelnk |
(pcmag.com) h2.story > span#title-181712470 > span.no > a.story-sourcelnk |
(windowscentral.com) h2.story > span#title-181711540 > span.no > a.story-sourcelnk |
(theregister.com) h2.story > span#title-181711462 > span.no > a.story-sourcelnk |
FEATURED CONTENT header > div.ntv-sponsored-disclaimer > a.ntv_link777074-148399 > span |
Compare Now article#firehose-11276O211 > div.body > div.p > span.nel-button |
By the end of 2026, how useful do you think agentic/multi-agent AI systems will… article.nosort > section#poll-content > div.units-6 > h3 |
vote now div.units-6 > form#pollBooth > div.poll-controls > button.btn-polls |
2.2B downloads ul.sf_widget > li > a > span.sf-size |
1.5B downloads ul.sf_widget > li > a > span.sf-size |
899M downloads ul.sf_widget > li > a > span.sf-size |
686M downloads ul.sf_widget > li > a > span.sf-size |
631M downloads ul.sf_widget > li > a > span.sf-size |
FAQ nav.grid_10 > ul > li > a |
Story Archive nav.grid_10 > ul > li > a |
Hall of Fame nav.grid_10 > ul > li > a |
Advertising nav.grid_10 > ul > li > a |
Terms nav.grid_10 > ul > li > a |
Privacy Statement nav.grid_10 > ul > li > a |
About nav.grid_10 > ul > li > a |
Feedback nav.grid_10 > ul > li > a |
Mobile View nav.grid_10 > ul > li > a |
Blog nav.grid_10 > ul > li > a |
Cookie Choices nav.grid_10 > ul > li > a#cookie-choices-link |
Privacy Choices ul > li > a#opt-out-link > a |
These are opportunities to improve the legibility of your content.
Touch targets with sufficient size and spacing help users who may have difficulty targeting small controls to activate the targets. Learn more about touch targets.
Performance issues directly impact user engagement and conversion rates.
| Failing Elements |
|---|
Hall of Fame nav.grid_10 > ul > li > a |
Advertising nav.grid_10 > ul > li > a |
Blog nav.grid_10 > ul > li > a |
Cookie Choices nav.grid_10 > ul > li > a#cookie-choices-link |
These items highlight common accessibility best practices.
Screen readers have features to make navigating tables easier. Ensuring that `<td>` elements in a large table (3 or more cells in width and height) have an associated table header may improve the experience for screen reader users. Learn more about table headers.
Performance issues directly impact user engagement and conversion rates.
| Failing Elements |
|---|
2013 Explosions at the Boston Marathon
1105
2005 Does Adblock Violate A Social… aside#slashboxes > article#thisday > section#thisday-content > table.thisday-tb |
Deprecated APIs will eventually be removed from the browser. Learn more about deprecated APIs.
Performance issues directly impact user engagement and conversion rates.
| Deprecation / Warning | Source |
|---|---|
| SharedStorage | |
| StorageType.persistent is deprecated. Please use standardized navigator.storage instead. | |
| Fledge |
These checks ensure that your page is following basic search engine optimization advice. There are many additional factors Lighthouse does not score here that may affect your search ranking, including performance on Core Web Vitals. Learn more about Google Search Essentials.
Search engines may use `href` attributes on links to crawl websites. Ensure that the `href` attribute of anchor elements links to an appropriate destination, so more pages of the site can be discovered. Learn how to make links crawlable
Performance issues directly impact user engagement and conversion rates.
| Uncrawlable Link |
|---|
binspam body.anon > section > menu#nix-reasons > a.tag |
dupe body.anon > section > menu#nix-reasons > a.tag |
notthebest body.anon > section > menu#nix-reasons > a.tag |
offtopic body.anon > section > menu#nix-reasons > a.tag |
slownewsday body.anon > section > menu#nix-reasons > a.tag |
stale body.anon > section > menu#nix-reasons > a.tag |
stupid body.anon > section > menu#nix-reasons > a.tag |
fresh body.anon > section > menu#nod-reasons > a.tag |
funny body.anon > section > menu#nod-reasons > a.tag |
insightful body.anon > section > menu#nod-reasons > a.tag |
interesting body.anon > section > menu#nod-reasons > a.tag |
maybe body.anon > section > menu#nod-reasons > a.tag |
offtopic body.anon > section > menu#comment-nix-reasons > a.tag |
flamebait body.anon > section > menu#comment-nix-reasons > a.tag |
troll body.anon > section > menu#comment-nix-reasons > a.tag |
redundant body.anon > section > menu#comment-nix-reasons > a.tag |
overrated body.anon > section > menu#comment-nix-reasons > a.tag |
insightful body.anon > section > menu#comment-nod-reasons > a.tag |
interesting body.anon > section > menu#comment-nod-reasons > a.tag |
informative body.anon > section > menu#comment-nod-reasons > a.tag |
funny body.anon > section > menu#comment-nod-reasons > a.tag |
underrated body.anon > section > menu#comment-nod-reasons > a.tag |
descriptive body.anon > section > menu#tag-nod-reasons > a.tag |
typo body.anon > section > menu#feedback-menu > a.tag |
dupe body.anon > section > menu#feedback-menu > a.tag |
error body.anon > section > menu#feedback-menu > a.tag |
Sponsored Content ? article#firehose-1127235O3 > header > div.ntv-sponsored-disclaimer > a.ntv_link777074-148399 |
FEATURED CONTENT article#firehose-11276O211 > header > div.ntv-sponsored-disclaimer > a.ntv_link777074-148399 |
To appear in search results, crawlers need access to your app.
Informative elements should aim for short, descriptive alternate text. Decorative elements can be ignored with an empty alt attribute. Learn more about the `alt` attribute.
Performance issues directly impact user engagement and conversion rates.
| Failing Elements |
|---|
article#firehose-1127235O3 > div.body > div.ntv-preview-img-wrapper > img.nel-image article#firehose-1127235O3 > div.body > div.ntv-preview-img-wrapper > img.nel-image |
article#firehose-11276O211 > div.body > div.ntv-preview-img-wrapper > img.nel-image article#firehose-11276O211 > div.body > div.ntv-preview-img-wrapper > img.nel-image |
body.anon > img body.anon > img |
Format your HTML in a way that enables crawlers to better understand your app’s content.
Send Feedback