Global Performance
6/6 locations ✓High global latency — average 542ms across 6 locations, fastest from Santa Clara (101ms), slowest from Singapore (912ms). No CDN detected. 4 locations above the 500ms target.
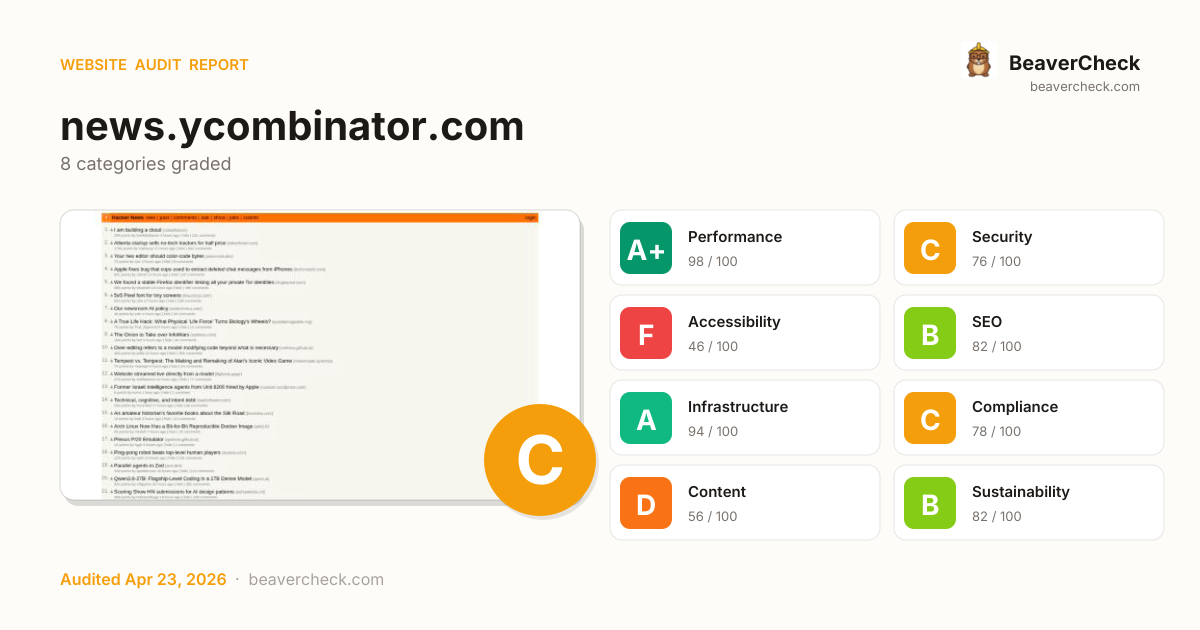
Audit overview
Accessibility and Content need attention; the other categories are in good shape.
Fix Priority Matrix
5 findingsQuick Wins
2High impact, low effort — start here.
Strategic
3High impact, requires investment.
Easy Improvements
0Small gains, minimal effort.
Nothing in this quadrant — good news.
Deprioritize
0Low impact, high effort — do last.
Nothing in this quadrant — good news.
Screenshots
Top Priorities (5)
'unsafe-inline' found in script source
Unsafe value (unsafe-inline, unsafe-eval) in script-src defeats CSP's main protection — XSS injections can execute again.
1 control(s) without accessible label
Form controls without labels — assistive tech announces 'edit text' with no context; users can't complete forms.
1 image-in-link without alt text
Image-only links with no alt create empty links — screen-reader users hear 'link' with no destination context.
2 image(s) missing alt attribute
Each image without alt text is a WCAG 1.1.1 failure — invisible to screen-reader users, lost from Google Image Search.
31 link(s) with no accessible text
Links with no accessible text (empty <a></a>, image-only no alt, icon-only no aria-label) are unidentifiable to screen readers.
Business case
What fixing the audit's findings is worth -- and what ignoring them keeps costing.
Return on investment
€808 investment → €4,328/month returns + EUR 20,500,000 risk avoided
Figures combine localized regulatory fine ceilings, search/conversion value priced against local CPC, and bandwidth waste estimates. Results depend on implementation quality and audience composition. Not legal or financial advice.
Conversion barriers
8 barrier(s) likely increasing bounce by ~20%.
- 105 broken link(s) on the pageClicks land on 404s — trust drops and the session often ends→ Fix or remove the broken destinations surfaced on the Content tab
- No HSTS headerReturning visitors are briefly exposed to downgrade attacks on first request→ Set Strict-Transport-Security: max-age=31536000; includeSubDomains
- No Content-Security-Policy headerHigher XSS blast radius — one compromised script can exfiltrate the checkout form→ Ship a reporting-only CSP first, then enforce once violations are clean
- 1 form field(s) without a labelScreen readers skip unlabeled fields; autofill can't identify them; checkout abandonment spikes→ Associate every input with a visible <label for="…">; add autocomplete attributes
- No Open Graph tagsLinks shared on LinkedIn / Slack / Facebook show bare URLs — referral clicks drop→ Add og:title, og:description, og:image, og:url to the page head
Preliminary CRO audit — each barrier links to the tab with detailed analysis.
Remediation cost
Start here for the best return on investment
Cost by category
Cost by effort level
Adjust assumptions
Team composition
Multiplier applied to dev hours to reflect QA, design, and PM overhead. Use Dev only for solo work; Full team for projects with formal review processes.
Rates reflect fully-loaded developer cost including overhead
Warning:Cost of inaction
Compliance Risk
€20.500.000
- No privacy policy link detectedGDPR: EUR 10.000 – EUR 20.000.000
- Privacy Policy not detectedGDPR: EUR 10.000 – EUR 20.000.000
- No <main> landmark foundEAA: EUR 1.000 – EUR 500.000
Bounce-Rate Cost
€4.328 /mo
+19.7pp bounce · ~1,967 lost visitors/mo
CPC: EUR 2.20
Bandwidth Waste
€0,00 /mo
34.6 MB/mo × 0.074 EUR/GB
- Optimize transfer: save ~3 KB per page loadSaves €0,00/mo
Compliance figures represent the statutory maximum fine for the most severe triggered category, capped per regulation — not the sum of per-finding penalties. Based on published regulatory fine ranges. This is not legal advice.
Unique monthly visitors from your analytics
Purchases, signups, or key actions
Optional — for revenue estimation
more engaged visitors from reduced bounce
Fix 5 critical issues to capture this value
How this is calculated
Based on Google/Deloitte research ("Milliseconds Make Millions") showing a ~7% bounce rate increase per additional second of LCP above the 2.5s "Good" threshold.
Your site's LCP: → estimated after fixes.
These are estimates based on industry research — actual results vary
Your data stays in your browser — nothing is sent to our servers
Lighthouse
Mobile
First Contentful Paint First Contentful Paint — how long until the browser renders the first piece of content. Under 1.8s is good.
857 ms
Largest Contentful Paint Largest Contentful Paint — how long until the largest visible element loads. Under 2.5s is good.
934 ms
Total Blocking Time Total Blocking Time — total time the main thread was blocked, preventing user input. Under 200ms is good.
27 ms
Cumulative Layout Shift Cumulative Layout Shift — measures visual stability. How much the page layout shifts during loading. Under 0.1 is good.
0.000
Speed Index Speed Index — how quickly content is visually displayed during load. Under 3.4s is good.
1.37 s
Time to Interactive Time to Interactive — how long until the page is fully interactive and responds to user input. Under 3.8s is good.
934 ms
Desktop
First Contentful Paint First Contentful Paint — how long until the browser renders the first piece of content. Under 1.8s is good.
231 ms
Largest Contentful Paint Largest Contentful Paint — how long until the largest visible element loads. Under 2.5s is good.
246 ms
Total Blocking Time Total Blocking Time — total time the main thread was blocked, preventing user input. Under 200ms is good.
0 ms
Cumulative Layout Shift Cumulative Layout Shift — measures visual stability. How much the page layout shifts during loading. Under 0.1 is good.
0.000
Speed Index Speed Index — how quickly content is visually displayed during load. Under 3.4s is good.
548 ms
Time to Interactive Time to Interactive — how long until the page is fully interactive and responds to user input. Under 3.8s is good.
246 ms
Categories
8Performance
All checks pass
Security
'unsafe-inline' found in script source
Accessibility
1 control(s) without accessible label
SEO
All checks pass
Infrastructure
All checks pass
Compliance
All checks pass
Content
All checks pass
Sustainability
All checks pass
How you compare
Where this site stands against peers running the same stack.
Top 10% of HSTS sites score 96+ on Content; you're at 56 — closing this gap is the highest-leverage improvement.
Top 10% of RSS sites score 96+ on SEO; you're at 82 — closing this gap is the highest-leverage improvement.
Technology stack
HSTS, with Nginx CDN
Stack Architecture
 RSS
RSS  Nginx
Nginx All Detected Technologies (3)
Nginx is a web server that can also be used as a reverse proxy, load balancer, mail proxy and HTTP cache.
HTTP Strict Transport Security (HSTS) informs browsers that the site should only be accessed using HTTPS.
RSS is a family of web feed formats used to publish frequently updated works—such as blog entries, news headlines, audio, and video—in a standardized format.
Observations (1)
No build tool detected
A framework (HSTS) was detected but no bundler was identified. The build tool may not be detectable from output patterns, or the site may use the framework's built-in bundler.
Show your score
Drop this badge on your README, marketing site, or status page. It auto-updates every time the audit re-runs and links back to this report.
This badge auto-updates with your latest scan result.
[](https://beavercheck.com/results/0766e06b-0dcc-40db-894e-10ec0929eeee)<a href="https://beavercheck.com/results/0766e06b-0dcc-40db-894e-10ec0929eeee"><img src="https://beavercheck.com/badge?url=https%3A%2F%2Fnews.ycombinator.com" alt="BeaverCheck Score"></a>https://beavercheck.com/badge?url=https%3A%2F%2Fnews.ycombinator.comExport & share
Download the audit, share with your team, or grab a fix plan ready to copy into your tracker.
Copies markdown to clipboard
Fix Plan
Three-week roadmap to ship the audit's findings, with one-click copy targets for your tracker.
Three-week fix plan
3 sprints · 10h total → projected B (86)
Sprint 1: Quick Wins
+3Highest ROI — low effort, high impact
- · 1 image-in-link without alt text
- · 31 link(s) with no accessible text
Sprint 2: Core Fixes
+1Medium effort, high structural impact
- · 1 control(s) without accessible label
- · 2 image(s) missing alt attribute
Sprint 3: Strategic Improvements
+3Higher effort, long-term payoff
- · 'unsafe-inline' found in script source