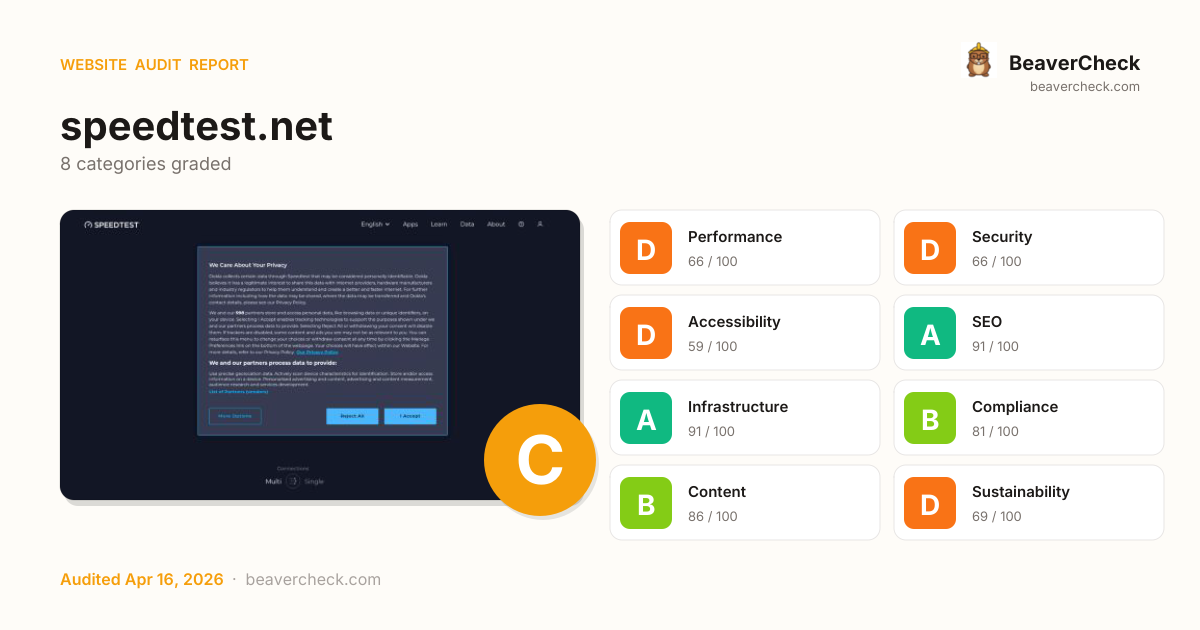
Mobile 375 × 812

Desktop 1440 × 900

Score: 72 / 100
Based on 8 categories, 0 sections
Room to improve — your 20.0s load time is above Google's 2.5s 'Good' threshold.
Several missing protections leave your users and data exposed.
Several issues make your site difficult for assistive technology users.
Well-optimized for search — your content is discoverable.
Solid infrastructure — fast server responses across the board.
Mostly compliant — a few items need attention.
Rich content metadata — your pages look great everywhere.
Heavier than average — reducing page weight saves energy and bandwidth.
The overall score is a weighted average of individual category scores. Categories with more impact on user experience and security carry more weight.
Weights reflect general web best practices. Individual needs may differ.
Content-Security-Policy header is missing
Security gaps expose your site and users to attacks, eroding trust.
HSTS header is missing
Security gaps expose your site and users to attacks, eroding trust.
No Content-Security-Policy header found
Security gaps expose your site and users to attacks, eroding trust.
Page weighs 13.7 MB (4.2 MB transferred)
Performance issues directly impact user engagement and conversion rates.
2 image-in-link without alt text
Accessibility issues exclude users with disabilities — up to 15% of your potential audience.
High impact, low effort — start here.
High impact, requires investment.
Small gains, minimal effort.
Nothing in this quadrant — good news.
Low impact, high effort — do last.
Nothing in this quadrant — good news.
[](https://beavercheck.com/results/0a882d7b-2072-47e1-949d-3459b80721ac)<a href="https://beavercheck.com/results/0a882d7b-2072-47e1-949d-3459b80721ac"><img src="https://beavercheck.com/badge?url=https%3A%2F%2Fspeedtest.net" alt="BeaverCheck Score"></a>https://beavercheck.com/badge?url=https%3A%2F%2Fspeedtest.netThis badge auto-updates with your latest scan result.
Your site performs reasonably well, but a few targeted fixes could meaningfully improve results. Your LCP of 20.0s exceeds Google's 2.5s 'Good' threshold and the 1 performance issue below directly contributes to it. Accessibility issues exclude users who rely on assistive technology — an estimated 15% of your potential audience. Addressing the critical issues below would have the most immediate impact on your user trust.
8 barrier(s) likely increasing bounce by ~31%.
Page takes 20.0s to load
+12% bounceUsers abandon at ~3s — you're 17.5s over the 2.5s threshold
Fix: Optimize render-blocking resources, preload the hero image, and compress images
Page feels frozen for 4.2s
+5% bounceClicks on the primary CTA are ignored while JavaScript runs
Fix: Break up long tasks; defer non-critical JavaScript to post-hydration
No HSTS header
+1% bounceReturning visitors are briefly exposed to downgrade attacks on first request
Fix: Set Strict-Transport-Security: max-age=31536000; includeSubDomains
No Content-Security-Policy header
+1% bounceHigher XSS blast radius — one compromised script can exfiltrate the checkout form
Fix: Ship a reporting-only CSP first, then enforce once violations are clean
Layout shifts during page load
+3% bounceContent movement causes mis-clicks on CTAs and form fields
Fix: Add width/height to images; reserve space for late-loading embeds
No structured data
+2% bounceNo rich-result eligibility in Google — lower SERP CTR vs competitors with stars and prices
Fix: Add JSON-LD for your page type (Product, Article, FAQPage, LocalBusiness, …)
No skip-to-content link
+1% bounceKeyboard and screen-reader users must tab through the entire header on every page
Fix: Add a visible-on-focus <a href="#main">Skip to content</a> as the first focusable element
2 broken link(s) on the page
+3% bounceClicks land on 404s — trust drops and the session often ends
Fix: Fix or remove the broken destinations surfaced on the Content tab
Preliminary CRO audit — each barrier links to the tab with detailed analysis.
€425 investment → €0.98/month returns + EUR 120,500,000 risk avoided
€425
5h · 5 findings
€0.98 /mo
~€12 / year
EUR 120,500,000
if kept compliant
€128 — in quick wins — start here for the fastest payback
Figures combine localized regulatory fine ceilings, search/conversion value priced against local CPC, and bandwidth waste estimates. Results depend on implementation quality and audience composition. Not legal or financial advice.
5.0 developer hours at €85/hr
Based on European Union rates (€85/hr)
Start here for the best return on investment
€10,041,668 / month at risk
~€120,500,012 / year if left unfixed
€120,500,000
+7 more
€0.98 /mo
13271.9 MB/mo × 0.074 EUR/GB
Compliance figures represent the statutory maximum fine for the most severe triggered category, capped per regulation — not the sum of per-finding penalties. Based on published regulatory fine ranges. This is not legal advice.
Unique monthly visitors from your analytics
Purchases, signups, or key actions
Optional — for revenue estimation
more engaged visitors from reduced bounce
Fix 5 critical issues to capture this value
Based on Google/Deloitte research ("Milliseconds Make Millions") showing a ~7% bounce rate increase per additional second of LCP above the 2.5s "Good" threshold.
Your site's LCP: → estimated after fixes.
These are estimates based on industry research — actual results vary
Your data stays in your browser — nothing is sent to our servers
Thanks for your feedback!
We'll use a cached audit if available, or offer to scan.
Industry-standard audits powered by Google Lighthouse.
Key metrics that affect user experience.
First Contentful Paint First Contentful Paint — how long until the browser renders the first piece of content. Under 1.8s is good.
13.85 s
Largest Contentful Paint Largest Contentful Paint — how long until the largest visible element loads. Under 2.5s is good.
20.02 s
Total Blocking Time Total Blocking Time — total time the main thread was blocked, preventing user input. Under 200ms is good.
4.18 s
Cumulative Layout Shift Cumulative Layout Shift — measures visual stability. How much the page layout shifts during loading. Under 0.1 is good.
0.126
Speed Index Speed Index — how quickly content is visually displayed during load. Under 3.4s is good.
13.85 s
Time to Interactive Time to Interactive — how long until the page is fully interactive and responds to user input. Under 3.8s is good.
27.76 s
Audit breakdown by category with detailed findings.
Remove large, duplicate JavaScript modules from bundles to reduce unnecessary bytes consumed by network activity.
Performance issues directly impact user engagement and conversion rates.
Polyfills and transforms enable older browsers to use new JavaScript features. However, many aren't necessary for modern browsers. Consider modifying your JavaScript build process to not transpile Baseline features, unless you know you must support older browsers. Learn why most sites can deploy ES6+ code without transpiling
Shipping ES5 transpiled code to modern browsers wastes bytes — every user with an evergreen browser pays for compatibility you don't need.
Most users today run browsers that natively support ES6+, async/await, optional chaining, and the rest of modern JavaScript. Transpiling to ES5 'just in case' adds 20-40% to your bundle for no benefit. Configure your build to target a modern browserslist, or ship a differential bundle pair (modern + legacy) with the module/nomodule pattern.
Source: Google web.dev / Lighthouse
3rd party code can significantly impact load performance. Reduce and defer loading of 3rd party code to prioritize your page's content.
Performance issues directly impact user engagement and conversion rates.
A long cache lifetime can speed up repeat visits to your page. Learn more about caching.
Performance issues directly impact user engagement and conversion rates.
Layout shifts occur when elements move absent any user interaction. Investigate the causes of layout shifts, such as elements being added, removed, or their fonts changing as the page loads.
Performance issues directly impact user engagement and conversion rates.
Consider setting font-display to swap or optional to ensure text is consistently visible. swap can be further optimized to mitigate layout shifts with font metric overrides.
Performance issues directly impact user engagement and conversion rates.
Each subpart has specific improvement strategies. Ideally, most of the LCP time should be spent on loading the resources, not within delays.
Performance issues directly impact user engagement and conversion rates.
Avoid chaining critical requests by reducing the length of chains, reducing the download size of resources, or deferring the download of unnecessary resources to improve page load.
Performance issues directly impact user engagement and conversion rates.
Requests are blocking the page's initial render, which may delay LCP. Deferring or inlining can move these network requests out of the critical path.
Performance issues directly impact user engagement and conversion rates.
| URL | Transfer Size | Duration |
|---|---|---|
| www.googleoptimize.com/optimize.js?id=GTM-MPW4L3J | 111.8 KiB | 3.0 s |
| b.cdnst.net/javascript/ads/ad.js | 237 B | |
| b.cdnst.net/styles/main.c94cd88435f3e907a9963e080e58198b.css | 29.1 KiB | 1.2 s |
Your first network request is the most important. Reduce its latency by avoiding redirects, ensuring a fast server response, and enabling text compression.
Performance issues directly impact user engagement and conversion rates.
Reducing the download time of images can improve the perceived load time of the page and LCP. Learn more about optimizing image size
Performance issues directly impact user engagement and conversion rates.
| URL | Resource Size | Est Savings | |
|---|---|---|---|
div.mobile-banner-container > a.webstore-app-links > div.download-images > img#banner-image div.mobile-banner-container > a.webstore-app-links > div.download-images > img#banner-image | b.cdnst.net/images/app-promo-image@2x.png | 148.1 KiB | 123.5 KiB |
Speed requirement div.pure-u-1-3 > a > div.homepage-lower-btn > img.homepage-lower-icon | b.cdnst.net/images/icg_how_much_speed.png | 10.6 KiB | 7.0 KiB |
These insights are also available in the Chrome DevTools Performance Panel - record a trace to view more detailed information.
Time to Interactive is the amount of time it takes for the page to become fully interactive. Learn more about the Time to Interactive metric.
Performance issues directly impact user engagement and conversion rates.
The maximum potential First Input Delay that your users could experience is the duration of the longest task. Learn more about the Maximum Potential First Input Delay metric.
Performance issues directly impact user engagement and conversion rates.
Redirects introduce additional delays before the page can be loaded. Learn how to avoid page redirects.
Performance issues directly impact user engagement and conversion rates.
| URL | Time Spent |
|---|---|
| speedtest.net/ | 800 ms |
| www.speedtest.net/ | 0.0 ms |
These are the largest layout shifts observed on the page. Each table item represents a single layout shift, and shows the element that shifted the most. Below each item are possible root causes that led to the layout shift. Some of these layout shifts may not be included in the CLS metric value due to windowing. Learn how to improve CLS
Performance issues directly impact user engagement and conversion rates.
| Element | Layout shift score |
|---|---|
SPEEDTEST®
Advertise
Speedtest Awards™
Speedtest Servers™
Speedtest Performance… body.layout-mobile > div > footer.footer | 0.122 |
Wi-Fi troubleshooting div.pure-u-1-3 > a > div.homepage-lower-btn > img.homepage-lower-icon | 0.005 |
Reduce unused rules from stylesheets and defer CSS not used for above-the-fold content to decrease bytes consumed by network activity. Learn how to reduce unused CSS.
Performance issues directly impact user engagement and conversion rates.
| URL | Transfer Size | Est Savings |
|---|---|---|
| b.cdnst.net/styles/main.c94cd88435f3e907a9963e080e58198b.css | 28.9 KiB | 26.3 KiB |
Reduce unused JavaScript and defer loading scripts until they are required to decrease bytes consumed by network activity. Learn how to reduce unused JavaScript.
Multi-megabyte JavaScript bundles delay every interactive feature on the page.
This is the Lighthouse audit fired when too much JS is shipped relative to what executes. The fix isn't a config flag — it requires bundle analysis (webpack-bundle-analyzer, rollup-plugin-visualizer), splitting routes into chunks, lazy-loading off-screen components, and removing unused dependencies. Fundamentally different from minification: minifying reduces byte count, this reduces what's downloaded at all.
Source: Google web.dev / Lighthouse
| URL | Transfer Size | Est Savings |
|---|---|---|
| b.cdnst.net/javascript/speedtest-main.js?v=740e4726565b535af6c9481d7ff91b6a | 1.5 MiB | 928.1 KiB |
| cdn.ziffstatic.com/pg/speedtest.prebid.js | 231.9 KiB | 187.6 KiB |
| /pagead/managed/js/gpt/m202604130101/pubads_impl.js | 187.5 KiB | 131.1 KiB |
| accounts.google.com/gsi/client?hl=en | 95.3 KiB | 79.5 KiB |
| cdn.ziffstatic.com/jst/otBannerSdk.202512.1.0.js | 126.2 KiB | 71.9 KiB |
| www.googletagmanager.com/gtag/destination?id=G-KKLSRK6J1Z&cx=c>m=4e64f0 | 168.6 KiB | 66.8 KiB |
| www.googleoptimize.com/optimize.js?id=GTM-MPW4L3J | 111.5 KiB | 65.3 KiB |
| openads-cdn.adsrvr.org/openadsjs/build/v1.0/ziffdavis/openads.js | 89.5 KiB | 61.5 KiB |
| www.googletagmanager.com/gtm.js?id=GTM-K7SNBZ | 138.7 KiB | 58.4 KiB |
| client.aps.amazon-adsystem.com/publisher.js | 82.1 KiB | 49.0 KiB |
| cdn.static.zdbb.net/js/z0WVjCBSEeGLoxIxOQVEwQ.min.js | 174.7 KiB | 41.9 KiB |
Consider reducing the time spent parsing, compiling, and executing JS. You may find delivering smaller JS payloads helps with this. Learn how to reduce Javascript execution time.
Performance issues directly impact user engagement and conversion rates.
Consider reducing the time spent parsing, compiling and executing JS. You may find delivering smaller JS payloads helps with this. Learn how to minimize main-thread work
Performance issues directly impact user engagement and conversion rates.
| Category | Time Spent |
|---|---|
| Script Evaluation | 9.6 s |
| Script Parsing & Compilation | 2.1 s |
| Other | 1.6 s |
| Style & Layout | 306 ms |
| Garbage Collection | 285 ms |
| Parse HTML & CSS | 146 ms |
| Rendering | 72 ms |
Large network payloads cost users real money and are highly correlated with long load times. Learn how to reduce payload sizes.
Performance issues directly impact user engagement and conversion rates.
Set an explicit width and height on image elements to reduce layout shifts and improve CLS. Learn how to set image dimensions
Performance issues directly impact user engagement and conversion rates.
| URL | |
|---|---|
div.mobile-banner-container > a.webstore-app-links > div.download-images > img#banner-image div.mobile-banner-container > a.webstore-app-links > div.download-images > img#banner-image | b.cdnst.net/images/app-promo-image@2x.png |
Speed requirement div.pure-u-1-3 > a > div.homepage-lower-btn > img.homepage-lower-icon | b.cdnst.net/images/icg_how_much_speed.png |
Mobile Apps div.pure-u-1-3 > a > div.homepage-lower-btn > img.homepage-lower-icon | b.cdnst.net/images/mobile_apps.svg |
Wi-Fi troubleshooting div.pure-u-1-3 > a > div.homepage-lower-btn > img.homepage-lower-icon | b.cdnst.net/images/icg_troubleshoot_wifi.svg |
Check outages div.pure-u-1-3 > a > div.homepage-lower-btn > img.homepage-lower-icon | b.cdnst.net/images/icg_check_outages.svg |
Help div.pure-u-1-3 > a > div.homepage-lower-btn > img.homepage-lower-icon | b.cdnst.net/images/icg_get_help.svg |
Talk to ISP div.pure-u-1-3 > a > div.homepage-lower-btn > img.homepage-lower-icon | b.cdnst.net/images/icg_talk_to_isp.svg |
Get it on Google Play a.webstore-app-links > div.download-images > span > img | b.cdnst.net/images/mobile-badges/google-play-EN.svg |
Arrow down image div.ispComponent > div.connection-mobile > a.connection-mobile-scroll > img | www.speedtest.net/images/scroll_for_more.svg |
More information about the performance of your application. These numbers don't directly affect the Performance score.
These checks highlight opportunities to improve the accessibility of your web app. Automatic detection can only detect a subset of issues and does not guarantee the accessibility of your web app, so manual testing is also encouraged.
ARIA dialog elements without accessible names may prevent screen readers users from discerning the purpose of these elements. Learn how to make ARIA dialog elements more accessible.
Performance issues directly impact user engagement and conversion rates.
| Failing Elements |
|---|
Speedtest is better with the app.
Download the Speedtest app for more metrics, … div.main-view > div > div.mobile-pretest > div.mobile-pretest-new |
These are opportunities to improve the usage of ARIA in your application which may enhance the experience for users of assistive technology, like a screen reader.
Link text (and alternate text for images, when used as links) that is discernible, unique, and focusable improves the navigation experience for screen reader users. Learn how to make links accessible.
Performance issues directly impact user engagement and conversion rates.
| Failing Elements |
|---|
div > div.mobile-pretest > div.mobile-pretest-new > a.close-btn div > div.mobile-pretest > div.mobile-pretest-new > a.close-btn |
These are opportunities to improve the semantics of the controls in your application. This may enhance the experience for users of assistive technology, like a screen reader.
A value greater than 0 implies an explicit navigation ordering. Although technically valid, this often creates frustrating experiences for users who rely on assistive technologies. Learn more about the `tabindex` attribute.
Performance issues directly impact user engagement and conversion rates.
| Failing Elements |
|---|
Speedtest div.nav > div.pure-g > div.pure-u-1 > a.masthead-logo |
GO div.pure-u-1 > div.mobile-start-wrapper > div.start-button > a.js-start-test |
These are opportunities to improve keyboard navigation in your application.
Touch targets with sufficient size and spacing help users who may have difficulty targeting small controls to activate the targets. Learn more about touch targets.
Performance issues directly impact user engagement and conversion rates.
| Failing Elements |
|---|
Android div.apps > ul.menu-footer > li > a |
Apple TV div.apps > ul.menu-footer > li > a |
macOS div.apps > ul.menu-footer > li > a |
Windows div.apps > ul.menu-footer > li > a |
These items highlight common accessibility best practices.
Visible text labels that do not match the accessible name can result in a confusing experience for screen reader users. Learn more about accessible names.
Performance issues directly impact user engagement and conversion rates.
| Failing Elements |
|---|
GO div.pure-u-1 > div.mobile-start-wrapper > div.start-button > a.js-start-test |
Our Privacy Policy div#onetrust-group-container > div#onetrust-policy > div#onetrust-policy-text > a.ot-cookie-policy-link |
Errors logged to the console indicate unresolved problems. They can come from network request failures and other browser concerns. Learn more about this errors in console diagnostic audit
Performance issues directly impact user engagement and conversion rates.
| Source | Description |
|---|---|
b.cdnst.net/javascript/speedtest-main.js?v=740e4726565b535af6c9481d7ff91b6a line 1, col 6624301 | Uncaught Error: Minified React error #200; visit https://reactjs.org/docs/error-decoder.html?invariant=200 for the full message or use the non-minified dev environment for full errors and additional helpful warnings. |
These checks ensure that your page is following basic search engine optimization advice. There are many additional factors Lighthouse does not score here that may affect your search ranking, including performance on Core Web Vitals. Learn more about Google Search Essentials.
Industry-standard audits powered by Google Lighthouse. — Desktop
Key metrics that affect user experience. — Desktop
First Contentful Paint First Contentful Paint — how long until the browser renders the first piece of content. Under 1.8s is good.
1.29 s
Largest Contentful Paint Largest Contentful Paint — how long until the largest visible element loads. Under 2.5s is good.
4.18 s
Total Blocking Time Total Blocking Time — total time the main thread was blocked, preventing user input. Under 200ms is good.
1.45 s
Cumulative Layout Shift Cumulative Layout Shift — measures visual stability. How much the page layout shifts during loading. Under 0.1 is good.
0.010
Speed Index Speed Index — how quickly content is visually displayed during load. Under 3.4s is good.
2.22 s
Time to Interactive Time to Interactive — how long until the page is fully interactive and responds to user input. Under 3.8s is good.
5.57 s
Audit breakdown by category with detailed findings.
Remove large, duplicate JavaScript modules from bundles to reduce unnecessary bytes consumed by network activity.
Performance issues directly impact user engagement and conversion rates.
Polyfills and transforms enable older browsers to use new JavaScript features. However, many aren't necessary for modern browsers. Consider modifying your JavaScript build process to not transpile Baseline features, unless you know you must support older browsers. Learn why most sites can deploy ES6+ code without transpiling
Shipping ES5 transpiled code to modern browsers wastes bytes — every user with an evergreen browser pays for compatibility you don't need.
Most users today run browsers that natively support ES6+, async/await, optional chaining, and the rest of modern JavaScript. Transpiling to ES5 'just in case' adds 20-40% to your bundle for no benefit. Configure your build to target a modern browserslist, or ship a differential bundle pair (modern + legacy) with the module/nomodule pattern.
Source: Google web.dev / Lighthouse
3rd party code can significantly impact load performance. Reduce and defer loading of 3rd party code to prioritize your page's content.
Performance issues directly impact user engagement and conversion rates.
A long cache lifetime can speed up repeat visits to your page. Learn more about caching.
Performance issues directly impact user engagement and conversion rates.
Consider setting font-display to swap or optional to ensure text is consistently visible. swap can be further optimized to mitigate layout shifts with font metric overrides.
Performance issues directly impact user engagement and conversion rates.
A forced reflow occurs when JavaScript queries geometric properties (such as offsetWidth) after styles have been invalidated by a change to the DOM state. This can result in poor performance. Learn more about forced reflows and possible mitigations.
Performance issues directly impact user engagement and conversion rates.
Avoid chaining critical requests by reducing the length of chains, reducing the download size of resources, or deferring the download of unnecessary resources to improve page load.
Performance issues directly impact user engagement and conversion rates.
Requests are blocking the page's initial render, which may delay LCP. Deferring or inlining can move these network requests out of the critical path.
Performance issues directly impact user engagement and conversion rates.
| URL | Transfer Size | Duration |
|---|---|---|
| b.cdnst.net/javascript/ads/ad.js | 237 B | |
| b.cdnst.net/styles/main.c94cd88435f3e907a9963e080e58198b.css | 29.1 KiB | 258 ms |
Your first network request is the most important. Reduce its latency by avoiding redirects, ensuring a fast server response, and enabling text compression.
Performance issues directly impact user engagement and conversion rates.
Reducing the download time of images can improve the perceived load time of the page and LCP. Learn more about optimizing image size
Performance issues directly impact user engagement and conversion rates.
| URL | Resource Size | Est Savings | |
|---|---|---|---|
Speed requirement div.pure-u-1-3 > a > div.homepage-lower-btn > img.homepage-lower-icon | b.cdnst.net/images/icg_how_much_speed.png | 10.6 KiB | 9.0 KiB |
These insights are also available in the Chrome DevTools Performance Panel - record a trace to view more detailed information.
The maximum potential First Input Delay that your users could experience is the duration of the longest task. Learn more about the Maximum Potential First Input Delay metric.
Performance issues directly impact user engagement and conversion rates.
Redirects introduce additional delays before the page can be loaded. Learn how to avoid page redirects.
Performance issues directly impact user engagement and conversion rates.
| URL | Time Spent |
|---|---|
| speedtest.net/ | 203 ms |
| www.speedtest.net/ | 0.0 ms |
Time to Interactive is the amount of time it takes for the page to become fully interactive. Learn more about the Time to Interactive metric.
Performance issues directly impact user engagement and conversion rates.
Reduce unused JavaScript and defer loading scripts until they are required to decrease bytes consumed by network activity. Learn how to reduce unused JavaScript.
Multi-megabyte JavaScript bundles delay every interactive feature on the page.
This is the Lighthouse audit fired when too much JS is shipped relative to what executes. The fix isn't a config flag — it requires bundle analysis (webpack-bundle-analyzer, rollup-plugin-visualizer), splitting routes into chunks, lazy-loading off-screen components, and removing unused dependencies. Fundamentally different from minification: minifying reduces byte count, this reduces what's downloaded at all.
Source: Google web.dev / Lighthouse
| URL | Transfer Size | Est Savings |
|---|---|---|
| b.cdnst.net/javascript/speedtest-main.js?v=740e4726565b535af6c9481d7ff91b6a | 1.5 MiB | 920.4 KiB |
| cdn.ziffstatic.com/pg/speedtest.prebid.js | 199.9 KiB | 161.6 KiB |
| /pagead/managed/js/gpt/m202604130101/pubads_impl.js | 187.5 KiB | 129.4 KiB |
| accounts.google.com/gsi/client?hl=en | 95.3 KiB | 79.5 KiB |
| cdn.ziffstatic.com/jst/otBannerSdk.202512.1.0.js | 126.2 KiB | 71.9 KiB |
| www.googletagmanager.com/gtag/destination?id=G-KKLSRK6J1Z&cx=c>m=4e64f0 | 168.6 KiB | 66.4 KiB |
| openads-cdn.adsrvr.org/openadsjs/build/v1.0/ziffdavis/openads.js | 89.5 KiB | 61.6 KiB |
| www.googletagmanager.com/gtm.js?id=GTM-K7SNBZ | 138.7 KiB | 56.9 KiB |
| client.aps.amazon-adsystem.com/publisher.js | 82.1 KiB | 49.0 KiB |
| cdn.static.zdbb.net/js/z0WVjCBSEeGLoxIxOQVEwQ.min.js | 174.7 KiB | 41.9 KiB |
Consider reducing the time spent parsing, compiling, and executing JS. You may find delivering smaller JS payloads helps with this. Learn how to reduce Javascript execution time.
Performance issues directly impact user engagement and conversion rates.
| URL | Total CPU Time | Script Evaluation | Script Parse |
|---|---|---|---|
| b.cdnst.net/javascript/speedtest-main.js?v=740e4726565b535af6c9481d7ff91b6a | 1.4 s | 1.0 s | 279 ms |
| Unattributable | 338 ms | 27 ms | 0.0 ms |
| cdn.ziffstatic.com/jst/otTCF.202512.1.0.js | 309 ms | 285 ms | 2.7 ms |
| www.googletagmanager.com/gtag/destination?id=G-KKLSRK6J1Z&cx=c>m=4e64f0 | 143 ms | 117 ms | 24 ms |
| www.googletagmanager.com/gtm.js?id=GTM-K7SNBZ | 142 ms | 115 ms | 24 ms |
| /pagead/managed/js/gpt/m202604130101/pubads_impl.js | 142 ms | 111 ms | 24 ms |
| cdn.ziffstatic.com/jst/otBannerSdk.202512.1.0.js | 141 ms | 105 ms | 22 ms |
| www.speedtest.net/ | 103 ms | 11 ms | 4.2 ms |
| cdn.ziffstatic.com/pg/speedtest.prebid.js | 94 ms | 60 ms | 33 ms |
| client.aps.amazon-adsystem.com/publisher.js | 93 ms | 77 ms | 14 ms |
| cdn.ziffstatic.com/jst/zdconsent.js | 87 ms | 75 ms | 4.6 ms |
| cdn.ziffstatic.com/pg/speedtest.js | 73 ms | 38 ms | 11 ms |
| openads-cdn.adsrvr.org/openadsjs/build/v1.0/ziffdavis/openads.js | 71 ms | 50 ms | 21 ms |
| cdn.static.zdbb.net/js/z0WVjCBSEeGLoxIxOQVEwQ.min.js | 61 ms | 37 ms | 7.8 ms |
Consider reducing the time spent parsing, compiling and executing JS. You may find delivering smaller JS payloads helps with this. Learn how to minimize main-thread work
Performance issues directly impact user engagement and conversion rates.
| Category | Time Spent |
|---|---|
| Script Evaluation | 2.2 s |
| Script Parsing & Compilation | 496 ms |
| Other | 385 ms |
| Style & Layout | 89 ms |
| Garbage Collection | 81 ms |
| Parse HTML & CSS | 63 ms |
| Rendering | 24 ms |
Large network payloads cost users real money and are highly correlated with long load times. Learn how to reduce payload sizes.
Performance issues directly impact user engagement and conversion rates.
Set an explicit width and height on image elements to reduce layout shifts and improve CLS. Learn how to set image dimensions
Performance issues directly impact user engagement and conversion rates.
| URL | |
|---|---|
Speed requirement div.pure-u-1-3 > a > div.homepage-lower-btn > img.homepage-lower-icon | b.cdnst.net/images/icg_how_much_speed.png |
Desktop apps div.pure-u-1-3 > a > div.homepage-lower-btn > img.homepage-lower-icon | b.cdnst.net/images/icg_desktop_apps.svg |
QR code for downloading mobile app div.pure-u-1-3 > div.qr-and-text > div.homepage-lower-btn > img.homepage-lower-icon | b.cdnst.net/images/icg_qr_code.svg |
Wi-Fi troubleshooting div.pure-u-1-3 > a > div.homepage-lower-btn > img.homepage-lower-icon | b.cdnst.net/images/icg_troubleshoot_wifi.svg |
Check outages div.pure-u-1-3 > a > div.homepage-lower-btn > img.homepage-lower-icon | b.cdnst.net/images/icg_check_outages.svg |
Talk to ISP div.pure-u-1-3 > a > div.homepage-lower-btn > img.homepage-lower-icon | b.cdnst.net/images/icg_talk_to_isp.svg |
More information about the performance of your application. These numbers don't directly affect the Performance score.
These checks highlight opportunities to improve the accessibility of your web app. Automatic detection can only detect a subset of issues and does not guarantee the accessibility of your web app, so manual testing is also encouraged.
A value greater than 0 implies an explicit navigation ordering. Although technically valid, this often creates frustrating experiences for users who rely on assistive technologies. Learn more about the `tabindex` attribute.
Performance issues directly impact user engagement and conversion rates.
| Failing Elements |
|---|
Speedtest div.nav > div.pure-g > div.pure-u-1 > a.masthead-logo |
GO div.speedtest-view > div.speedtest-container > div.start-button > a.js-start-test |
Multi div > div.test-modes-wrapper > div.toggle > a.test-mode |
Single div > div.test-modes-wrapper > div.toggle > a.test-mode |
These are opportunities to improve keyboard navigation in your application.
Visible text labels that do not match the accessible name can result in a confusing experience for screen reader users. Learn more about accessible names.
Performance issues directly impact user engagement and conversion rates.
| Failing Elements |
|---|
GO div.speedtest-view > div.speedtest-container > div.start-button > a.js-start-test |
Our Privacy Policy div#onetrust-group-container > div#onetrust-policy > div#onetrust-policy-text > a.ot-cookie-policy-link |
These checks ensure that your page is following basic search engine optimization advice. There are many additional factors Lighthouse does not score here that may affect your search ranking, including performance on Core Web Vitals. Learn more about Google Search Essentials.
Send Feedback