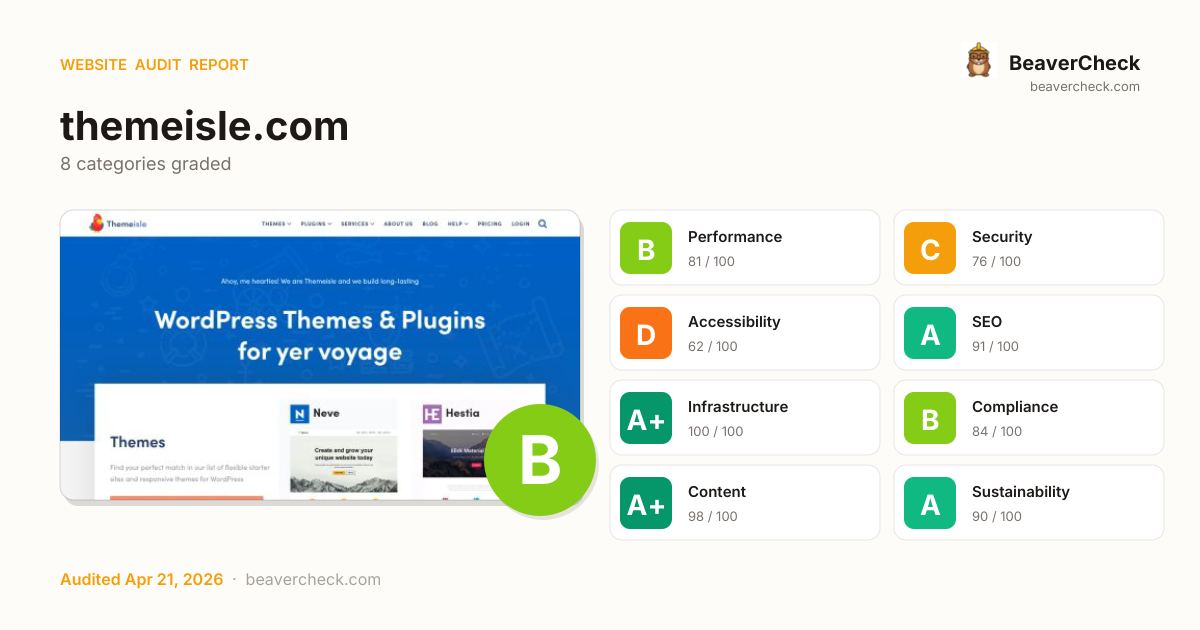
Mobile 375 × 812

Desktop 1440 × 900

Score: 81 / 100
Based on 8 categories, 0 sections
Decent speed, but optimizing further could improve engagement.
Good foundation, but a few gaps could be exploited.
Several issues make your site difficult for assistive technology users.
Well-optimized for search — your content is discoverable.
Solid infrastructure — fast server responses across the board.
Mostly compliant — a few items need attention.
Rich content metadata — your pages look great everywhere.
Lean and efficient — low environmental impact per visit.
The overall score is a weighted average of individual category scores. Categories with more impact on user experience and security carry more weight.
Weights reflect general web best practices. Individual needs may differ.
1 link(s) with no accessible text
Accessibility issues exclude users with disabilities — up to 15% of your potential audience.
4 image-only link(s) without alt text
Accessibility issues exclude users with disabilities — up to 15% of your potential audience.
5 control(s) without accessible label
Accessibility issues exclude users with disabilities — up to 15% of your potential audience.
38 third-party resources (87% of weight)
Performance issues directly impact user engagement and conversion rates.
Cookie '__cf_bm' has no SameSite attribute
Security gaps expose your site and users to attacks, eroding trust.
High impact, low effort — start here.
High impact, requires investment.
Small gains, minimal effort.
Nothing in this quadrant — good news.
Low impact, high effort — do last.
Nothing in this quadrant — good news.
[](https://beavercheck.com/results/0bafd9b2-d29f-425d-b49b-d0f58f84c513)<a href="https://beavercheck.com/results/0bafd9b2-d29f-425d-b49b-d0f58f84c513"><img src="https://beavercheck.com/badge?url=https%3A%2F%2Fthemeisle.com" alt="BeaverCheck Score"></a>https://beavercheck.com/badge?url=https%3A%2F%2Fthemeisle.comThis badge auto-updates with your latest scan result.
Your site performs reasonably well, but a few targeted fixes could meaningfully improve results. Your LCP of 2.8s exceeds Google's 2.5s 'Good' threshold and the 1 performance issue below directly contributes to it. Addressing the critical issues below would have the most immediate impact on your audience reach.
6 barrier(s) likely increasing bounce by ~25%.
Page loads in 2.8s
+5% bounceEvery additional 100ms above 2.5s costs conversions — you're 261ms over
Fix: Target <2.5s LCP: defer non-critical scripts and optimize the hero image
Page feels frozen for 750ms
+5% bounceClicks on the primary CTA are ignored while JavaScript runs
Fix: Break up long tasks; defer non-critical JavaScript to post-hydration
No HSTS header
+1% bounceReturning visitors are briefly exposed to downgrade attacks on first request
Fix: Set Strict-Transport-Security: max-age=31536000; includeSubDomains
No Content-Security-Policy header
+1% bounceHigher XSS blast radius — one compromised script can exfiltrate the checkout form
Fix: Ship a reporting-only CSP first, then enforce once violations are clean
5 form field(s) without a label
+6% bounceScreen readers skip unlabeled fields; autofill can't identify them; checkout abandonment spikes
Fix: Associate every input with a visible <label for="…">; add autocomplete attributes
2 broken link(s) on the page
+3% bounceClicks land on 404s — trust drops and the session often ends
Fix: Fix or remove the broken destinations surfaced on the Content tab
Preliminary CRO audit — each barrier links to the tab with detailed analysis.
$700 investment → $493/month returns + USD 157,500 risk avoided
$700
7h · 5 findings
$493 /mo
~$5,912 / year
USD 157,500
if kept compliant
$50 — in quick wins — start here for the fastest payback
Figures combine localized regulatory fine ceilings, search/conversion value priced against local CPC, and bandwidth waste estimates. Results depend on implementation quality and audience composition. Not legal or financial advice.
7.0 developer hours at $100/hr
Based on United States rates ($100/hr)
Start here for the best return on investment
$13,125 / month at risk
~$157,504 / year if left unfixed
$157,500
+5 more
$0.32 /mo
3964.5 MB/mo × 0.080 USD/GB
Compliance figures represent the statutory maximum fine for the most severe triggered category, capped per regulation — not the sum of per-finding penalties. Based on published regulatory fine ranges. This is not legal advice.
Unique monthly visitors from your analytics
Purchases, signups, or key actions
Optional — for revenue estimation
more engaged visitors from reduced bounce
Fix 3 critical issues to capture this value
Based on Google/Deloitte research ("Milliseconds Make Millions") showing a ~7% bounce rate increase per additional second of LCP above the 2.5s "Good" threshold.
Your site's LCP: → estimated after fixes.
These are estimates based on industry research — actual results vary
Your data stays in your browser — nothing is sent to our servers
Thanks for your feedback!
We'll use a cached audit if available, or offer to scan.
Industry-standard audits powered by Google Lighthouse.
Key metrics that affect user experience.
First Contentful Paint First Contentful Paint — how long until the browser renders the first piece of content. Under 1.8s is good.
1.39 s
Largest Contentful Paint Largest Contentful Paint — how long until the largest visible element loads. Under 2.5s is good.
2.76 s
Total Blocking Time Total Blocking Time — total time the main thread was blocked, preventing user input. Under 200ms is good.
750 ms
Cumulative Layout Shift Cumulative Layout Shift — measures visual stability. How much the page layout shifts during loading. Under 0.1 is good.
0.018
Speed Index Speed Index — how quickly content is visually displayed during load. Under 3.4s is good.
1.39 s
Time to Interactive Time to Interactive — how long until the page is fully interactive and responds to user input. Under 3.8s is good.
10.95 s
Audit breakdown by category with detailed findings.
Remove large, duplicate JavaScript modules from bundles to reduce unnecessary bytes consumed by network activity.
Performance issues directly impact user engagement and conversion rates.
Polyfills and transforms enable older browsers to use new JavaScript features. However, many aren't necessary for modern browsers. Consider modifying your JavaScript build process to not transpile Baseline features, unless you know you must support older browsers. Learn why most sites can deploy ES6+ code without transpiling
Shipping ES5 transpiled code to modern browsers wastes bytes — every user with an evergreen browser pays for compatibility you don't need.
Most users today run browsers that natively support ES6+, async/await, optional chaining, and the rest of modern JavaScript. Transpiling to ES5 'just in case' adds 20-40% to your bundle for no benefit. Configure your build to target a modern browserslist, or ship a differential bundle pair (modern + legacy) with the module/nomodule pattern.
Source: Google web.dev / Lighthouse
3rd party code can significantly impact load performance. Reduce and defer loading of 3rd party code to prioritize your page's content.
Performance issues directly impact user engagement and conversion rates.
Optimize LCP by making the LCP image discoverable from the HTML immediately, and avoiding lazy-loading
Performance issues directly impact user engagement and conversion rates.
Avoid chaining critical requests by reducing the length of chains, reducing the download size of resources, or deferring the download of unnecessary resources to improve page load.
Performance issues directly impact user engagement and conversion rates.
Requests are blocking the page's initial render, which may delay LCP. Deferring or inlining can move these network requests out of the critical path.
Performance issues directly impact user engagement and conversion rates.
| URL | Transfer Size | Duration |
|---|---|---|
| /wp-content/themes/themeisle/assets/build/blocks/style-in... | 13.5 KiB | 150 ms |
| /wp-content/plugins/neve-pro-addon/includes/modules/blog_... | 2.9 KiB | |
| themeisle.com/wp-content/themes/neve/style-main-new.min.css?ver=4.2.3 | 9.4 KiB | 150 ms |
A long cache lifetime can speed up repeat visits to your page. Learn more about caching.
Performance issues directly impact user engagement and conversion rates.
| Request | Cache TTL | Transfer Size |
|---|---|---|
| widget.docsbot.ai/chat.js | 3600.0 s | 133.0 KiB |
| scripts.clarity.ms/0.8.60-beta/clarity.js | 86400.0 s | 25.0 KiB |
| /p.css?s=1&k=set1ymb&ht=tk&f=24539.24547.24549&a=6202475&... | 604800.0 s | 172 B |
Reducing the download time of images can improve the perceived load time of the page and LCP. Learn more about optimizing image size
Performance issues directly impact user engagement and conversion rates.
| URL | Resource Size | Est Savings | |
|---|---|---|---|
div.wp-block-group__inner-container > figure.wp-block-image > a > img.wp-image-8370284 div.wp-block-group__inner-container > figure.wp-block-image > a > img.wp-image-8370284 | /cb:3970~373ad/w:322/h:362/q:mauto/dpr:1.8/f:best/https:/... | 28.7 KiB | 19.8 KiB |
div.wp-block-group__inner-container > figure.wp-block-image > a > img.wp-image-8370283 div.wp-block-group__inner-container > figure.wp-block-image > a > img.wp-image-8370283 | /cb:3970~373ad/w:322/h:362/q:mauto/dpr:1.8/f:best/https:/... | 26.5 KiB | 18.3 KiB |
These insights are also available in the Chrome DevTools Performance Panel - record a trace to view more detailed information.
Time to Interactive is the amount of time it takes for the page to become fully interactive. Learn more about the Time to Interactive metric.
Performance issues directly impact user engagement and conversion rates.
The maximum potential First Input Delay that your users could experience is the duration of the longest task. Learn more about the Maximum Potential First Input Delay metric.
Performance issues directly impact user engagement and conversion rates.
Consider reducing the time spent parsing, compiling, and executing JS. You may find delivering smaller JS payloads helps with this. Learn how to reduce Javascript execution time.
Performance issues directly impact user engagement and conversion rates.
| URL | Total CPU Time | Script Evaluation | Script Parse |
|---|---|---|---|
| themeisle.com/ | 555 ms | 55 ms | 7.8 ms |
| /ansnfdxcgr/dwb0y?b7e246d2=L2d0YWcvanM%2FaWQ9Ry1EMlE4RUdX... | 406 ms | 355 ms | 48 ms |
| load.data.themeisle.com/ansnfdxcgr.js?92=aWQ9R1RNLUtNNDRSUTg%3D&page=1 | 392 ms | 314 ms | 34 ms |
| Unattributable | 373 ms | 33 ms | 0.0 ms |
| /ansnfdxcgr/dwb0y?b7e246d2=L2d0YWcvanM%2FaWQ9Ry1QQlYyQjRX... | 241 ms | 196 ms | 44 ms |
| scripts.clarity.ms/0.8.60-beta/clarity.js | 232 ms | 212 ms | 9.2 ms |
| widget.docsbot.ai/chat.js | 227 ms | 148 ms | 76 ms |
| mllj2j8xvfl0.i.optimole.com/js-lib/v2/latest/optimole_lib_no_poly.min.js | 87 ms | 33 ms | 2.0 ms |
Consider reducing the time spent parsing, compiling and executing JS. You may find delivering smaller JS payloads helps with this. Learn how to minimize main-thread work
Performance issues directly impact user engagement and conversion rates.
| Category | Time Spent |
|---|---|
| Script Evaluation | 1.4 s |
| Other | 461 ms |
| Style & Layout | 347 ms |
| Script Parsing & Compilation | 225 ms |
| Rendering | 92 ms |
| Parse HTML & CSS | 60 ms |
| Garbage Collection | 11 ms |
Reduce unused JavaScript and defer loading scripts until they are required to decrease bytes consumed by network activity. Learn how to reduce unused JavaScript.
Multi-megabyte JavaScript bundles delay every interactive feature on the page.
This is the Lighthouse audit fired when too much JS is shipped relative to what executes. The fix isn't a config flag — it requires bundle analysis (webpack-bundle-analyzer, rollup-plugin-visualizer), splitting routes into chunks, lazy-loading off-screen components, and removing unused dependencies. Fundamentally different from minification: minifying reduces byte count, this reduces what's downloaded at all.
Source: Google web.dev / Lighthouse
| URL | Transfer Size | Est Savings |
|---|---|---|
| widget.docsbot.ai/chat.js | 132.5 KiB | 77.0 KiB |
| /ansnfdxcgr/dwb0y?b7e246d2=L2d0YWcvanM%2FaWQ9Ry1QQlYyQjRX... | 173.3 KiB | 74.2 KiB |
| load.data.themeisle.com/ansnfdxcgr.js?92=aWQ9R1RNLUtNNDRSUTg%3D&page=1 | 137.8 KiB | 58.7 KiB |
| /ansnfdxcgr/dwb0y?b7e246d2=L2d0YWcvanM%2FaWQ9Ry1EMlE4RUdX... | 173.0 KiB | 54.9 KiB |
Set an explicit width and height on image elements to reduce layout shifts and improve CLS. Learn how to set image dimensions
Performance issues directly impact user engagement and conversion rates.
| URL | |
|---|---|
div.item--inner > div.site-logo > a.brand > img.neve-site-logo div.item--inner > div.site-logo > a.brand > img.neve-site-logo | /cb:3970~373ad/w:169/h:55/q:mauto/f:best/ig:avif/dpr:2/ht... |
More information about the performance of your application. These numbers don't directly affect the Performance score.
These checks highlight opportunities to improve the accessibility of your web app. Automatic detection can only detect a subset of issues and does not guarantee the accessibility of your web app, so manual testing is also encouraged.
When an element doesn't have an accessible name, screen readers announce it with a generic name, making it unusable for users who rely on screen readers. Learn how to make command elements more accessible.
Performance issues directly impact user engagement and conversion rates.
| Failing Elements |
|---|
div.row > div.footer-cols > div.footer-box > label.caret div.row > div.footer-cols > div.footer-box > label.caret |
These are opportunities to improve the usage of ARIA in your application which may enhance the experience for users of assistive technology, like a screen reader.
Low-contrast text is difficult or impossible for many users to read. Learn how to provide sufficient color contrast.
Performance issues directly impact user engagement and conversion rates.
| Failing Elements |
|---|
Blimey! Add more firepower to yer site, theme and rule the seven seas. div.nv-content-wrap > div.wp-block-columns > div.wp-block-column > p.is-style-default |
See All Plugins div.wp-block-column > div.wp-block-buttons > div.wp-block-button > a.wp-block-button__link |
Find th’ gold wit’ our treasure maps for land lubbers and seafarers alike. div.nv-content-wrap > div.wp-block-columns > div.wp-block-column > p.has-text-color |
See what’s new div.wp-block-column > div.wp-block-buttons > div.wp-block-button > a.wp-block-button__link |
Accept body.home > div#obfx-cookie-bar > span.obfx-cookie-bar > a#obfx-accept-cookie-policy |
These are opportunities to improve the legibility of your content.
Properly ordered headings that do not skip levels convey the semantic structure of the page, making it easier to navigate and understand when using assistive technologies. Learn more about heading order.
Performance issues directly impact user engagement and conversion rates.
| Failing Elements |
|---|
How to install WordPress guide div.wp-block-column > div.wp-block-themeisle-icon-card > div.ti-card-content-wrap > h5.wp-block-heading |
These are opportunities to improve keyboard navigation in your application.
Link text (and alternate text for images, when used as links) that is discernible, unique, and focusable improves the navigation experience for screen reader users. Learn how to make links accessible.
Performance issues directly impact user engagement and conversion rates.
| Failing Elements |
|---|
div.wp-block-group > div.wp-block-group__inner-container > figure.wp-block-image > a div.wp-block-group > div.wp-block-group__inner-container > figure.wp-block-image > a |
div.wp-block-columns > div.wp-block-column > p.is-style-default > a div.wp-block-columns > div.wp-block-column > p.is-style-default > a |
These are opportunities to improve the semantics of the controls in your application. This may enhance the experience for users of assistive technology, like a screen reader.
Source maps translate minified code to the original source code. This helps developers debug in production. In addition, Lighthouse is able to provide further insights. Consider deploying source maps to take advantage of these benefits. Learn more about source maps.
Performance issues directly impact user engagement and conversion rates.
These checks ensure that your page is following basic search engine optimization advice. There are many additional factors Lighthouse does not score here that may affect your search ranking, including performance on Core Web Vitals. Learn more about Google Search Essentials.
Industry-standard audits powered by Google Lighthouse. — Desktop
Key metrics that affect user experience. — Desktop
First Contentful Paint First Contentful Paint — how long until the browser renders the first piece of content. Under 1.8s is good.
519 ms
Largest Contentful Paint Largest Contentful Paint — how long until the largest visible element loads. Under 2.5s is good.
802 ms
Total Blocking Time Total Blocking Time — total time the main thread was blocked, preventing user input. Under 200ms is good.
39 ms
Cumulative Layout Shift Cumulative Layout Shift — measures visual stability. How much the page layout shifts during loading. Under 0.1 is good.
0.017
Speed Index Speed Index — how quickly content is visually displayed during load. Under 3.4s is good.
519 ms
Time to Interactive Time to Interactive — how long until the page is fully interactive and responds to user input. Under 3.8s is good.
2.76 s
Audit breakdown by category with detailed findings.
Remove large, duplicate JavaScript modules from bundles to reduce unnecessary bytes consumed by network activity.
Performance issues directly impact user engagement and conversion rates.
Polyfills and transforms enable older browsers to use new JavaScript features. However, many aren't necessary for modern browsers. Consider modifying your JavaScript build process to not transpile Baseline features, unless you know you must support older browsers. Learn why most sites can deploy ES6+ code without transpiling
Shipping ES5 transpiled code to modern browsers wastes bytes — every user with an evergreen browser pays for compatibility you don't need.
Most users today run browsers that natively support ES6+, async/await, optional chaining, and the rest of modern JavaScript. Transpiling to ES5 'just in case' adds 20-40% to your bundle for no benefit. Configure your build to target a modern browserslist, or ship a differential bundle pair (modern + legacy) with the module/nomodule pattern.
Source: Google web.dev / Lighthouse
3rd party code can significantly impact load performance. Reduce and defer loading of 3rd party code to prioritize your page's content.
Performance issues directly impact user engagement and conversion rates.
A forced reflow occurs when JavaScript queries geometric properties (such as offsetWidth) after styles have been invalidated by a change to the DOM state. This can result in poor performance. Learn more about forced reflows and possible mitigations.
Performance issues directly impact user engagement and conversion rates.
Optimize LCP by making the LCP image discoverable from the HTML immediately, and avoiding lazy-loading
Performance issues directly impact user engagement and conversion rates.
Avoid chaining critical requests by reducing the length of chains, reducing the download size of resources, or deferring the download of unnecessary resources to improve page load.
Performance issues directly impact user engagement and conversion rates.
A long cache lifetime can speed up repeat visits to your page. Learn more about caching.
Performance issues directly impact user engagement and conversion rates.
| Request | Cache TTL | Transfer Size |
|---|---|---|
| widget.docsbot.ai/chat.js | 3600.0 s | 133.2 KiB |
| scripts.clarity.ms/0.8.60-beta/clarity.js | 86400.0 s | 25.0 KiB |
| /p.css?s=1&k=set1ymb&ht=tk&f=24539.24547.24549&a=6202475&... | 604800.0 s | 172 B |
Requests are blocking the page's initial render, which may delay LCP. Deferring or inlining can move these network requests out of the critical path.
Performance issues directly impact user engagement and conversion rates.
These insights are also available in the Chrome DevTools Performance Panel - record a trace to view more detailed information.
Time to Interactive is the amount of time it takes for the page to become fully interactive. Learn more about the Time to Interactive metric.
Performance issues directly impact user engagement and conversion rates.
Reduce unused rules from stylesheets and defer CSS not used for above-the-fold content to decrease bytes consumed by network activity. Learn how to reduce unused CSS.
Performance issues directly impact user engagement and conversion rates.
| URL | Transfer Size | Est Savings |
|---|---|---|
| /wp-content/themes/themeisle/assets/build/blocks/style-in... | 13.4 KiB | 10.5 KiB |
Reduce unused JavaScript and defer loading scripts until they are required to decrease bytes consumed by network activity. Learn how to reduce unused JavaScript.
Multi-megabyte JavaScript bundles delay every interactive feature on the page.
This is the Lighthouse audit fired when too much JS is shipped relative to what executes. The fix isn't a config flag — it requires bundle analysis (webpack-bundle-analyzer, rollup-plugin-visualizer), splitting routes into chunks, lazy-loading off-screen components, and removing unused dependencies. Fundamentally different from minification: minifying reduces byte count, this reduces what's downloaded at all.
Source: Google web.dev / Lighthouse
| URL | Transfer Size | Est Savings |
|---|---|---|
| widget.docsbot.ai/chat.js | 132.8 KiB | 77.2 KiB |
| /ansnfdxcgr/dwb0y?b7e246d2=L2d0YWcvanM%2FaWQ9Ry1QQlYyQjRX... | 173.3 KiB | 75.1 KiB |
| load.data.themeisle.com/ansnfdxcgr.js?92=aWQ9R1RNLUtNNDRSUTg%3D&page=1 | 137.9 KiB | 58.8 KiB |
| /ansnfdxcgr/dwb0y?b7e246d2=L2d0YWcvanM%2FaWQ9Ry1EMlE4RUdX... | 173.0 KiB | 54.6 KiB |
Set an explicit width and height on image elements to reduce layout shifts and improve CLS. Learn how to set image dimensions
Performance issues directly impact user engagement and conversion rates.
| URL | |
|---|---|
div.item--inner > div.site-logo > a.brand > img.neve-site-logo div.item--inner > div.site-logo > a.brand > img.neve-site-logo | /cb:3970~373ad/w:169/h:55/q:mauto/f:best/ig:avif/dpr:2/ht... |
More information about the performance of your application. These numbers don't directly affect the Performance score.
These checks highlight opportunities to improve the accessibility of your web app. Automatic detection can only detect a subset of issues and does not guarantee the accessibility of your web app, so manual testing is also encouraged.
When an element doesn't have an accessible name, screen readers announce it with a generic name, making it unusable for users who rely on screen readers. Learn how to make command elements more accessible.
Performance issues directly impact user engagement and conversion rates.
| Failing Elements |
|---|
div.row > div.footer-cols > div.footer-box > label.caret div.row > div.footer-cols > div.footer-box > label.caret |
These are opportunities to improve the usage of ARIA in your application which may enhance the experience for users of assistive technology, like a screen reader.
Low-contrast text is difficult or impossible for many users to read. Learn how to provide sufficient color contrast.
Performance issues directly impact user engagement and conversion rates.
| Failing Elements |
|---|
Blimey! Add more firepower to yer site, theme and rule the seven seas. div.nv-content-wrap > div.wp-block-columns > div.wp-block-column > p.is-style-default |
See All Plugins div.wp-block-column > div.wp-block-buttons > div.wp-block-button > a.wp-block-button__link |
Find th’ gold wit’ our treasure maps for land lubbers and seafarers alike. div.nv-content-wrap > div.wp-block-columns > div.wp-block-column > p.has-text-color |
See what’s new div.wp-block-column > div.wp-block-buttons > div.wp-block-button > a.wp-block-button__link |
Follow th’ tale div.wp-block-column > div.wp-block-buttons > div.wp-block-button > a.wp-block-button__link |
Accept body.home > div#obfx-cookie-bar > span.obfx-cookie-bar > a#obfx-accept-cookie-policy |
These are opportunities to improve the legibility of your content.
Properly ordered headings that do not skip levels convey the semantic structure of the page, making it easier to navigate and understand when using assistive technologies. Learn more about heading order.
Performance issues directly impact user engagement and conversion rates.
| Failing Elements |
|---|
How to install WordPress guide div.wp-block-column > div.wp-block-themeisle-icon-card > div.ti-card-content-wrap > h5.wp-block-heading |
These are opportunities to improve keyboard navigation in your application.
Link text (and alternate text for images, when used as links) that is discernible, unique, and focusable improves the navigation experience for screen reader users. Learn how to make links accessible.
Performance issues directly impact user engagement and conversion rates.
| Failing Elements |
|---|
div.wp-block-group > div.wp-block-group__inner-container > figure.wp-block-image > a div.wp-block-group > div.wp-block-group__inner-container > figure.wp-block-image > a |
div.wp-block-columns > div.wp-block-column > p.is-style-default > a div.wp-block-columns > div.wp-block-column > p.is-style-default > a |
These are opportunities to improve the semantics of the controls in your application. This may enhance the experience for users of assistive technology, like a screen reader.
Touch targets with sufficient size and spacing help users who may have difficulty targeting small controls to activate the targets. Learn more about touch targets.
Performance issues directly impact user engagement and conversion rates.
| Failing Elements |
|---|
Open Submenu ul#nv-primary-navigation-main > li#menu-item-8362058 > div.wrap > div.caret-wrap |
Open Submenu ul#nv-primary-navigation-main > li#menu-item-8362057 > div.wrap > div.caret-wrap |
Open Submenu ul#nv-primary-navigation-main > li#menu-item-8383129 > div.wrap > div.caret-wrap |
Open Submenu ul#nv-primary-navigation-main > li#menu-item-8362061 > div.wrap > div.caret-wrap |
These items highlight common accessibility best practices.
Source maps translate minified code to the original source code. This helps developers debug in production. In addition, Lighthouse is able to provide further insights. Consider deploying source maps to take advantage of these benefits. Learn more about source maps.
Performance issues directly impact user engagement and conversion rates.
These checks ensure that your page is following basic search engine optimization advice. There are many additional factors Lighthouse does not score here that may affect your search ranking, including performance on Core Web Vitals. Learn more about Google Search Essentials.
Send Feedback