Spain · Madrid Completed: Apr 16, 2026 16:59 UTC
Mobile 375 × 812

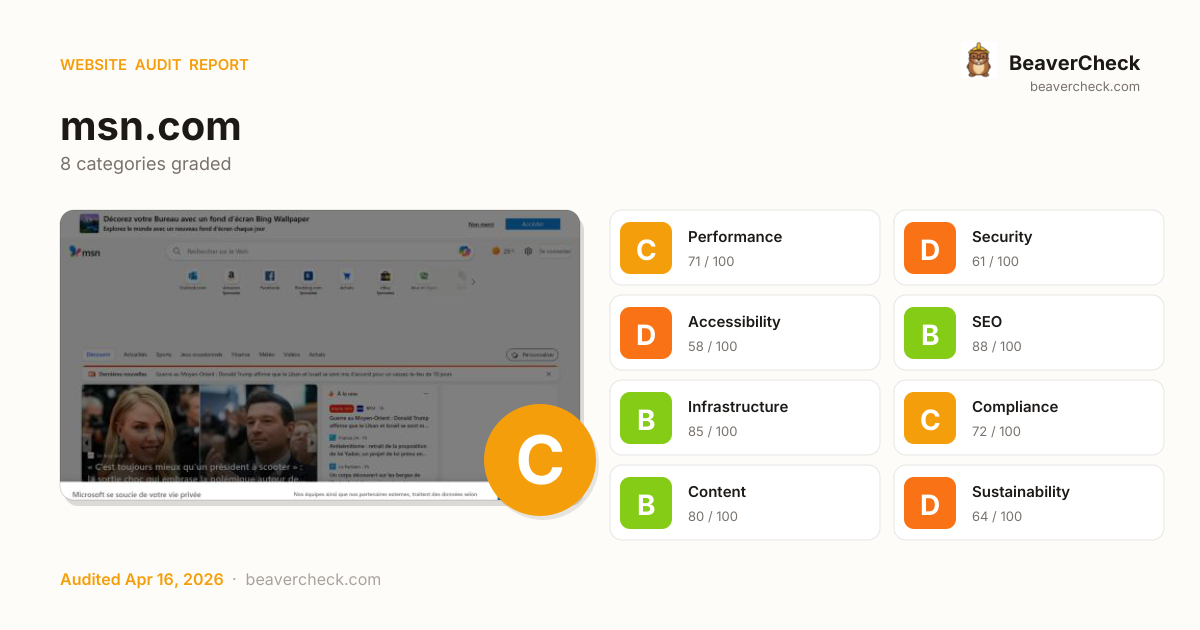
Desktop 1440 × 900

Score: 70 / 100
Based on 8 categories, 0 sections
Decent speed, but optimizing further could improve engagement.
Several missing protections leave your users and data exposed.
Several issues make your site difficult for assistive technology users.
Well-optimized for search — your content is discoverable.
Solid infrastructure — fast server responses across the board.
Mostly compliant — a few items need attention.
Good content signals with minor gaps.
Heavier than average — reducing page weight saves energy and bandwidth.
The overall score is a weighted average of individual category scores. Categories with more impact on user experience and security carry more weight.
Weights reflect general web best practices. Individual needs may differ.
Content-Security-Policy header is missing
Security gaps expose your site and users to attacks, eroding trust.
No Content-Security-Policy header found
Security gaps expose your site and users to attacks, eroding trust.
14 button(s) with no accessible text
Accessibility issues exclude users with disabilities — up to 15% of your potential audience.
No <main> landmark found
Accessibility issues exclude users with disabilities — up to 15% of your potential audience.
No H1 heading found
Accessibility issues exclude users with disabilities — up to 15% of your potential audience.
High impact, low effort — start here.
High impact, requires investment.
Small gains, minimal effort.
Nothing in this quadrant — good news.
Low impact, high effort — do last.
Nothing in this quadrant — good news.
[](https://beavercheck.com/results/0de0af75-a953-40e1-8648-afe72be2f40b)<a href="https://beavercheck.com/results/0de0af75-a953-40e1-8648-afe72be2f40b"><img src="https://beavercheck.com/badge?url=https%3A%2F%2Fmsn.com" alt="BeaverCheck Score"></a>https://beavercheck.com/badge?url=https%3A%2F%2Fmsn.comThis badge auto-updates with your latest scan result.
Your site performs reasonably well, but a few targeted fixes could meaningfully improve results. Accessibility issues exclude users who rely on assistive technology — an estimated 15% of your potential audience. Addressing the critical issues below would have the most immediate impact on your user trust.
8 barrier(s) likely increasing bounce by ~32%.
Page takes 10.3s to load
+12% bounceUsers abandon at ~3s — you're 7.8s over the 2.5s threshold
Fix: Optimize render-blocking resources, preload the hero image, and compress images
Page feels frozen for 1.7s
+5% bounceClicks on the primary CTA are ignored while JavaScript runs
Fix: Break up long tasks; defer non-critical JavaScript to post-hydration
No Content-Security-Policy header
+1% bounceHigher XSS blast radius — one compromised script can exfiltrate the checkout form
Fix: Ship a reporting-only CSP first, then enforce once violations are clean
Layout shifts during page load
+3% bounceContent movement causes mis-clicks on CTAs and form fields
Fix: Add width/height to images; reserve space for late-loading embeds
No structured data
+2% bounceNo rich-result eligibility in Google — lower SERP CTR vs competitors with stars and prices
Fix: Add JSON-LD for your page type (Product, Article, FAQPage, LocalBusiness, …)
Content is hard to read
+2% bounceGraduate-level reading difficulty — limits the addressable audience for product or blog pages
Fix: Shorten sentences; replace jargon with plain language; target Flesch ease ≥60
No skip-to-content link
+1% bounceKeyboard and screen-reader users must tab through the entire header on every page
Fix: Add a visible-on-focus <a href="#main">Skip to content</a> as the first focusable element
4 broken link(s) on the page
+5% bounceClicks land on 404s — trust drops and the session often ends
Fix: Fix or remove the broken destinations surfaced on the Content tab
Preliminary CRO audit — each barrier links to the tab with detailed analysis.
€440 investment → €4,209/month returns + EUR 120,500,000 risk avoided
€440
6h · 5 findings
€4,209 /mo
~€50,510 / year
EUR 120,500,000
if kept compliant
€80 — in quick wins — start here for the fastest payback
Figures combine localized regulatory fine ceilings, search/conversion value priced against local CPC, and bandwidth waste estimates. Results depend on implementation quality and audience composition. Not legal or financial advice.
5.5 developer hours at €80/hr
Based on France rates (€80/hr)
Start here for the best return on investment
€10,041,667 / month at risk
~€120,500,007 / year if left unfixed
€120,500,000
+8 more
€0.56 /mo
7622.5 MB/mo × 0.074 EUR/GB
Compliance figures represent the statutory maximum fine for the most severe triggered category, capped per regulation — not the sum of per-finding penalties. Based on published regulatory fine ranges. This is not legal advice.
Unique monthly visitors from your analytics
Purchases, signups, or key actions
Optional — for revenue estimation
more engaged visitors from reduced bounce
Fix 5 critical issues to capture this value
Based on Google/Deloitte research ("Milliseconds Make Millions") showing a ~7% bounce rate increase per additional second of LCP above the 2.5s "Good" threshold.
Your site's LCP: → estimated after fixes.
These are estimates based on industry research — actual results vary
Your data stays in your browser — nothing is sent to our servers
Thanks for your feedback!
We'll use a cached audit if available, or offer to scan.
Industry-standard audits powered by Google Lighthouse.
Key metrics that affect user experience.
First Contentful Paint First Contentful Paint — how long until the browser renders the first piece of content. Under 1.8s is good.
3.08 s
Largest Contentful Paint Largest Contentful Paint — how long until the largest visible element loads. Under 2.5s is good.
10.33 s
Total Blocking Time Total Blocking Time — total time the main thread was blocked, preventing user input. Under 200ms is good.
1.70 s
Cumulative Layout Shift Cumulative Layout Shift — measures visual stability. How much the page layout shifts during loading. Under 0.1 is good.
0.137
Speed Index Speed Index — how quickly content is visually displayed during load. Under 3.4s is good.
5.61 s
Time to Interactive Time to Interactive — how long until the page is fully interactive and responds to user input. Under 3.8s is good.
16.92 s
Audit breakdown by category with detailed findings.
Remove large, duplicate JavaScript modules from bundles to reduce unnecessary bytes consumed by network activity.
Performance issues directly impact user engagement and conversion rates.
Polyfills and transforms enable older browsers to use new JavaScript features. However, many aren't necessary for modern browsers. Consider modifying your JavaScript build process to not transpile Baseline features, unless you know you must support older browsers. Learn why most sites can deploy ES6+ code without transpiling
Shipping ES5 transpiled code to modern browsers wastes bytes — every user with an evergreen browser pays for compatibility you don't need.
Most users today run browsers that natively support ES6+, async/await, optional chaining, and the rest of modern JavaScript. Transpiling to ES5 'just in case' adds 20-40% to your bundle for no benefit. Configure your build to target a modern browserslist, or ship a differential bundle pair (modern + legacy) with the module/nomodule pattern.
Source: Google web.dev / Lighthouse
3rd party code can significantly impact load performance. Reduce and defer loading of 3rd party code to prioritize your page's content.
Performance issues directly impact user engagement and conversion rates.
Layout shifts occur when elements move absent any user interaction. Investigate the causes of layout shifts, such as elements being added, removed, or their fonts changing as the page loads.
Performance issues directly impact user engagement and conversion rates.
Your first network request is the most important. Reduce its latency by avoiding redirects, ensuring a fast server response, and enabling text compression.
Performance issues directly impact user engagement and conversion rates.
Reducing the download time of images can improve the perceived load time of the page and LCP. Learn more about optimizing image size
Performance issues directly impact user engagement and conversion rates.
| URL | Resource Size | Est Savings | |
|---|---|---|---|
Il volait à 2 286 mètres d’altitude - puis il s’est écrasé div.body > div.video-media-container > img.media | /tenant/amp/entityid/AA20QAf7.img?w=432&h=226&q=90&m=6&f=... | 64.0 KiB | 51.7 KiB |
Cécile Duflot sur RMC le 16 avril 2026 -
RMC
div.body > img.media | /tenant/amp/entityid/AA212yGH.img?w=432&h=226&q=90&m=6&f=... | 64.0 KiB | 51.7 KiB |
Guerre en Ukraine : « Plusieurs centaines de missiles », un contrat à 3,7 milli… div.body > img.media | /tenant/amp/entityid/AA20ZRkN.img?w=432&h=226&q=90&m=6&f=... | 32.0 KiB | 19.7 KiB |
« On se sent trahis » : la volte-face du nouveau maire de Clermont-Ferrand décl… csm-ultra-infopane.carousel > div.slides > div.infopane-image-container > img.media | /tenant/amp/entityid/AA212FhR.img?w=380&h=199&q=80&m=6&f=... | 32.0 KiB | 19.7 KiB |
"Cash Investigation" : Élise Lucet dans la tourmente, une famille porte plainte… csm-ultra-infopane.carousel > div.slides > div.infopane-image-container > img.media | /tenant/amp/entityid/AA211yC2.img?w=432&h=226&q=90&m=6&f=... | 32.0 KiB | 19.7 KiB |
Avoid chaining critical requests by reducing the length of chains, reducing the download size of resources, or deferring the download of unnecessary resources to improve page load.
Performance issues directly impact user engagement and conversion rates.
Requests are blocking the page's initial render, which may delay LCP. Deferring or inlining can move these network requests out of the critical path.
Performance issues directly impact user engagement and conversion rates.
| URL | Transfer Size | Duration |
|---|---|---|
| assets.msn.com/staticsb/statics/latest/oneTrust/2.4/scripttemplates/otSDKStub.js | 9.8 KiB | 150 ms |
| /bundles/v1/homePage/latest/mobile/SSR-extension.046330be... | 9.3 KiB |
A long cache lifetime can speed up repeat visits to your page. Learn more about caching.
Performance issues directly impact user engagement and conversion rates.
These insights are also available in the Chrome DevTools Performance Panel - record a trace to view more detailed information.
Redirects introduce additional delays before the page can be loaded. Learn how to avoid page redirects.
Performance issues directly impact user engagement and conversion rates.
| URL | Time Spent |
|---|---|
| msn.com/ | 816 ms |
| www.msn.com/ | 755 ms |
| www.msn.com/fr-fr?fastFallbackOnModuleUnavailable=1 | 0.0 ms |
These are the largest layout shifts observed on the page. Each table item represents a single layout shift, and shows the element that shifted the most. Below each item are possible root causes that led to the layout shift. Some of these layout shifts may not be included in the CLS metric value due to windowing. Learn how to improve CLS
Performance issues directly impact user engagement and conversion rates.
| Element | Layout shift score |
|---|---|
div.mobile-header-feed-container > div.feed-container > div.feed-inner-container > div.feed-section div.mobile-header-feed-container > div.feed-container > div.feed-inner-container > div.feed-section | 0.047 |
div.feed-container > div.feed-inner-container > div.feed-section > div.feed-view-wrapper div.feed-container > div.feed-inner-container > div.feed-section > div.feed-view-wrapper | 0.016 |
Microsoft se soucie de votre vie privée
Microsoft et nos fournisseurs tiers uti… body.no-scroll > div#onetrust-consent-sdk > div#onetrust-banner-sdk | 0.015 |
"Cash Investigation" : Élise Lucet dans la tourmente, une famille porte plainte… csm-ultra-infopane.carousel > div.slides | 0.013 |
"Cash Investigation" : Élise Lucet dans la tourmente, une famille porte plainte… csm-ultra-infopane.carousel > div.slides | 0.013 |
Microsoft se soucie de votre vie privée
Microsoft et nos fournisseurs tiers uti… body.no-scroll > div#onetrust-consent-sdk > div#onetrust-banner-sdk | 0.012 |
"Cash Investigation" : Élise Lucet dans la tourmente, une famille porte plainte… csm-ultra-infopane.carousel > div.slides | 0.011 |
"Cash Investigation" : Élise Lucet dans la tourmente, une famille porte plainte… csm-ultra-infopane.carousel > div.slides | 0.011 |
Microsoft se soucie de votre vie privée
Microsoft et nos fournisseurs tiers uti… body.no-scroll > div#onetrust-consent-sdk > div#onetrust-banner-sdk | 0.011 |
"Cash Investigation" : Élise Lucet dans la tourmente, une famille porte plainte… csm-ultra-infopane.carousel > div.slides | 0.009 |
Microsoft se soucie de votre vie privée
Microsoft et nos fournisseurs tiers uti… body.no-scroll > div#onetrust-consent-sdk > div#onetrust-banner-sdk | 0.008 |
Microsoft se soucie de votre vie privée
Microsoft et nos fournisseurs tiers uti… body.no-scroll > div#onetrust-consent-sdk > div#onetrust-banner-sdk | 0.008 |
"Cash Investigation" : Élise Lucet dans la tourmente, une famille porte plainte… csm-ultra-infopane.carousel > div.slides | 0.008 |
"Cash Investigation" : Élise Lucet dans la tourmente, une famille porte plainte… csm-ultra-infopane.carousel > div.slides | 0.008 |
Microsoft se soucie de votre vie privée
Microsoft et nos fournisseurs tiers uti… body.no-scroll > div#onetrust-consent-sdk > div#onetrust-banner-sdk | 0.007 |
The maximum potential First Input Delay that your users could experience is the duration of the longest task. Learn more about the Maximum Potential First Input Delay metric.
Performance issues directly impact user engagement and conversion rates.
Time to Interactive is the amount of time it takes for the page to become fully interactive. Learn more about the Time to Interactive metric.
Performance issues directly impact user engagement and conversion rates.
Reduce unused JavaScript and defer loading scripts until they are required to decrease bytes consumed by network activity. Learn how to reduce unused JavaScript.
Multi-megabyte JavaScript bundles delay every interactive feature on the page.
This is the Lighthouse audit fired when too much JS is shipped relative to what executes. The fix isn't a config flag — it requires bundle analysis (webpack-bundle-analyzer, rollup-plugin-visualizer), splitting routes into chunks, lazy-loading off-screen components, and removing unused dependencies. Fundamentally different from minification: minifying reduces byte count, this reduces what's downloaded at all.
Source: Google web.dev / Lighthouse
| URL | Transfer Size | Est Savings |
|---|---|---|
| /bundles/v1/homePage/latest/mobile/experiences_unified-mo... | 225.8 KiB | 164.2 KiB |
| assets.msn.com/bundles/v1/homePage/latest/mobile/common.b3ec8abb499b229923c0.js | 326.6 KiB | 151.4 KiB |
| assets.msn.com/staticsb/statics/latest/auth/msal-browser-5.6.2.min.js | 112.9 KiB | 67.8 KiB |
| /staticsb/statics/latest/oneTrust/2.4/scripttemplates/202... | 126.8 KiB | 61.7 KiB |
| /bundles/v1/homePage/latest/mobile/experiences_display-ad... | 109.3 KiB | 53.2 KiB |
| adsdk.microsoft.com/ast/ast.js | 51.0 KiB | 37.5 KiB |
| /bundles/v1/homePage/latest/mobile/microsoft.7872c396d332... | 99.9 KiB | 36.2 KiB |
| /bundles/v1/homePage/latest/mobile/umfChannelDataProvider... | 37.6 KiB | 27.0 KiB |
| /bundles/v1/homePage/latest/mobile/experience.c39e4cec4a8... | 42.4 KiB | 26.2 KiB |
Consider reducing the time spent parsing, compiling, and executing JS. You may find delivering smaller JS payloads helps with this. Learn how to reduce Javascript execution time.
Performance issues directly impact user engagement and conversion rates.
Consider reducing the time spent parsing, compiling and executing JS. You may find delivering smaller JS payloads helps with this. Learn how to minimize main-thread work
Performance issues directly impact user engagement and conversion rates.
| Category | Time Spent |
|---|---|
| Script Evaluation | 4.5 s |
| Other | 1.2 s |
| Script Parsing & Compilation | 510 ms |
| Style & Layout | 394 ms |
| Parse HTML & CSS | 169 ms |
| Rendering | 168 ms |
| Garbage Collection | 115 ms |
Many navigations are performed by going back to a previous page, or forwards again. The back/forward cache (bfcache) can speed up these return navigations. Learn more about the bfcache
Performance issues directly impact user engagement and conversion rates.
| Failure reason | Failure type |
|---|---|
| The page has an unload handler in the main frame. | Actionable |
| Pages with cache-control:no-store header cannot enter back/forward cache. | Actionable |
| Pages whose main resource has cache-control:no-store cannot enter back/forward cache. | Not actionable |
| Back/forward cache is disabled because some JavaScript network request received resource with Cache-Control: no-store header. | Not actionable |
Reduce unused rules from stylesheets and defer CSS not used for above-the-fold content to decrease bytes consumed by network activity. Learn how to reduce unused CSS.
Performance issues directly impact user engagement and conversion rates.
More information about the performance of your application. These numbers don't directly affect the Performance score.
These checks highlight opportunities to improve the accessibility of your web app. Automatic detection can only detect a subset of issues and does not guarantee the accessibility of your web app, so manual testing is also encouraged.
Low-contrast text is difficult or impossible for many users to read. Learn how to provide sufficient color contrast.
Performance issues directly impact user engagement and conversion rates.
| Failing Elements |
|---|
Annonce div.feed-inner-container > div.feed-ads-wrapper > div.display-ads-container > span.ad-placeholder-text |
Sponsorisé div#nativead-infopane-3 > div.footer > a.ad-slug |
Sponsorisé div.footer > a.ad-slug |
These are opportunities to improve the legibility of your content.
Disabling zooming is problematic for users with low vision who rely on screen magnification to properly see the contents of a web page. Learn more about the viewport meta tag.
Performance issues directly impact user engagement and conversion rates.
| Failing Elements |
|---|
head > meta head > meta |
These items highlight common accessibility best practices.
Image natural dimensions should be proportional to the display size and the pixel ratio to maximize image clarity. Learn how to provide responsive images.
Performance issues directly impact user engagement and conversion rates.
| URL | Displayed size | Actual size | Expected size | |
|---|---|---|---|---|
Guerre en Ukraine : « Plusieurs centaines de missiles », un contrat à 3,7 milli… div.body > img.media | /tenant/amp/entityid/AA20ZRkN.img?w=380&h=199&q=80&m=6&f=... | 380 x 199 | 380 x 199 | 570 x 299 |
Le Parisien div.body > div.text > div.attribution > img.attribution-image | /tenant/amp/entityid/AA1SevPa.img?w=16&h=16&q=100&m=6&f=p... | 16 x 16 | 16 x 16 | 24 x 24 |
Deprecated APIs will eventually be removed from the browser. Learn more about deprecated APIs.
Performance issues directly impact user engagement and conversion rates.
| Deprecation / Warning | Source |
|---|---|
| Unload event listeners are deprecated and will be removed. | /bundles/v1/homePage/latest/mobile/microsoft.7872c396d332... line 1, col 4281 |
| Synchronous XMLHttpRequest on the main thread is deprecated because of its detrimental effects to the end user's experience. For more help, check https://xhr.spec.whatwg.org/. |
Issues logged to the `Issues` panel in Chrome Devtools indicate unresolved problems. They can come from network request failures, insufficient security controls, and other browser concerns. Open up the Issues panel in Chrome DevTools for more details on each issue.
Performance issues directly impact user engagement and conversion rates.
| Issue type |
|---|
| Cookie |
Source maps translate minified code to the original source code. This helps developers debug in production. In addition, Lighthouse is able to provide further insights. Consider deploying source maps to take advantage of these benefits. Learn more about source maps.
Performance issues directly impact user engagement and conversion rates.
These checks ensure that your page is following basic search engine optimization advice. There are many additional factors Lighthouse does not score here that may affect your search ranking, including performance on Core Web Vitals. Learn more about Google Search Essentials.
Industry-standard audits powered by Google Lighthouse. — Desktop
Key metrics that affect user experience. — Desktop
First Contentful Paint First Contentful Paint — how long until the browser renders the first piece of content. Under 1.8s is good.
801 ms
Largest Contentful Paint Largest Contentful Paint — how long until the largest visible element loads. Under 2.5s is good.
3.26 s
Total Blocking Time Total Blocking Time — total time the main thread was blocked, preventing user input. Under 200ms is good.
607 ms
Cumulative Layout Shift Cumulative Layout Shift — measures visual stability. How much the page layout shifts during loading. Under 0.1 is good.
0.103
Speed Index Speed Index — how quickly content is visually displayed during load. Under 3.4s is good.
3.12 s
Time to Interactive Time to Interactive — how long until the page is fully interactive and responds to user input. Under 3.8s is good.
6.57 s
Audit breakdown by category with detailed findings.
Remove large, duplicate JavaScript modules from bundles to reduce unnecessary bytes consumed by network activity.
Performance issues directly impact user engagement and conversion rates.
Polyfills and transforms enable older browsers to use new JavaScript features. However, many aren't necessary for modern browsers. Consider modifying your JavaScript build process to not transpile Baseline features, unless you know you must support older browsers. Learn why most sites can deploy ES6+ code without transpiling
Shipping ES5 transpiled code to modern browsers wastes bytes — every user with an evergreen browser pays for compatibility you don't need.
Most users today run browsers that natively support ES6+, async/await, optional chaining, and the rest of modern JavaScript. Transpiling to ES5 'just in case' adds 20-40% to your bundle for no benefit. Configure your build to target a modern browserslist, or ship a differential bundle pair (modern + legacy) with the module/nomodule pattern.
Source: Google web.dev / Lighthouse
3rd party code can significantly impact load performance. Reduce and defer loading of 3rd party code to prioritize your page's content.
Performance issues directly impact user engagement and conversion rates.
Layout shifts occur when elements move absent any user interaction. Investigate the causes of layout shifts, such as elements being added, removed, or their fonts changing as the page loads.
Performance issues directly impact user engagement and conversion rates.
Your first network request is the most important. Reduce its latency by avoiding redirects, ensuring a fast server response, and enabling text compression.
Performance issues directly impact user engagement and conversion rates.
A forced reflow occurs when JavaScript queries geometric properties (such as offsetWidth) after styles have been invalidated by a change to the DOM state. This can result in poor performance. Learn more about forced reflows and possible mitigations.
Performance issues directly impact user engagement and conversion rates.
Optimize LCP by making the LCP image discoverable from the HTML immediately, and avoiding lazy-loading
Performance issues directly impact user engagement and conversion rates.
Avoid chaining critical requests by reducing the length of chains, reducing the download size of resources, or deferring the download of unnecessary resources to improve page load.
Performance issues directly impact user engagement and conversion rates.
Requests are blocking the page's initial render, which may delay LCP. Deferring or inlining can move these network requests out of the critical path.
Performance issues directly impact user engagement and conversion rates.
| URL | Transfer Size | Duration |
|---|---|---|
| assets.msn.com/staticsb/statics/latest/oneTrust/2.4/scripttemplates/otSDKStub.js | 9.8 KiB | 203 ms |
| www.msn.com/bundles/v1/homePage/latest/SSR-extension.06f18e74ffffd7968bc6.js | 8.6 KiB |
A long cache lifetime can speed up repeat visits to your page. Learn more about caching.
Performance issues directly impact user engagement and conversion rates.
Reducing the download time of images can improve the perceived load time of the page and LCP. Learn more about optimizing image size
Performance issues directly impact user engagement and conversion rates.
| URL | Resource Size | Est Savings | |
|---|---|---|---|
Meilleur jeu 2026 — crée ton village ! div.root > div.content-card-container > img.media | /th?id=OADD2.1155586741565793_13YASF3WHXRXO0U&pid=21.2&c=... | 67.8 KiB | 60.1 KiB |
Pass Ulys Télépéage Offert div.root > div.content-card-container > img.media | /th?id=OADD2.1287528117012185_1EG1C2V8MB5ESCE&pid=21.2&c=... | 89.6 KiB | 59.3 KiB |
« On se sent trahis » : la volte-face du nouveau maire de Clermont-Ferrand décl… div.root > div.content-card-container > img.media | /tenant/amp/entityid/AA212FhR.img?w=612&h=304&q=60&m=6&f=... | 64.0 KiB | 33.7 KiB |
Souscrivez une assurance pour animaux dès aujourd'hui afin de protéger votre ch… div.root > div.content-card-container > img.media | /th?id=OADD2.10239417397382_1M7RLPV5KB8V9P9X5&pid=21.2&c=... | 32.5 KiB | 24.8 KiB |
Amazing Bingo div.density-full-card > a > div.density-full-card-img > img | /th?id=OCGE.9p4gd7749gzw_v3_main&pid=uxf&rf=hubstream_fal... | 22.9 KiB | 21.7 KiB |
Solitaire Farm Seasons div.density-full-card > a > div.density-full-card-img > img | /th?id=OCGE.9nlm4kglwjrs_abtesting_a9ad6a31-a1e3-42b2-bbf... | 21.5 KiB | 20.4 KiB |
Casino Heist Slots div.density-full-card > a > div.density-full-card-img > img | /th?id=OCGE.9mt0xqt1zlbq_v9_main&pid=uxf&rf=hubstream_fal... | 21.2 KiB | 20.0 KiB |
static map image div.weather-minimap-container > a.weather-minimap-link > img.weather-minimap-base | /REST/v1/Imagery/Map/roadondemandfull/40.417,-3.703/6?map... | 24.6 KiB | 18.7 KiB |
Bubble Fall div.density-full-card > a > div.density-full-card-img > img | /th?id=OCGE.9nxn29r1qqn0_v4_main&pid=uxf&rf=hubstream_fal... | 19.2 KiB | 18.0 KiB |
Jewel Legend Quest div.density-full-card > a > div.density-full-card-img > img | /th?id=OCGE.9nd5d7dgsb5l_v8_main&pid=uxf&rf=hubstream_fal... | 17.7 KiB | 16.5 KiB |
Spades div.density-full-card > a > div.density-full-card-img > img | /th?id=OCGE.9n965bpl2zp1_v4_main&pid=uxf&rf=hubstream_fal... | 17.3 KiB | 16.1 KiB |
Hearts div.density-full-card > a > div.density-full-card-img > img | /th?id=OCGE.9mzhg3kjmmk4_v6_main&pid=uxf&rf=hubstream_fal... | 16.4 KiB | 15.2 KiB |
Bing Wallpaper div.wrapper > div.container > div.image-text-container > img.image1 | /creativeservice/9c6e7ead-bff6-2b01-fa23-ca14c17b14c2_835... | 14.9 KiB | 14.5 KiB |
div.sd-card-header > div.header-icon > img div.sd-card-header > div.header-icon > img | /th?id=OCGE.casualgames_gameapp_maximal_v2&w=104&h=104&ql... | 12.5 KiB | 12.4 KiB |
Amazing Spider Solitaire div.density-full-card > a > div.density-full-card-img > img | /th?id=OCGE.9pl8blkwr1n2_abtesting_1b9ea39c-e4ff-4841-818... | 12.6 KiB | 11.5 KiB |
Impôts 2026 : si vous payez une mutuelle cette année, n’oubliez pas de cocher l… div.root > div.content-card-container > img.media | /tenant/amp/entityid/AA20XGR5.img?w=268&h=140&q=60&m=6&f=... | 16.0 KiB | 9.9 KiB |
Santa Parkour div.density-full-card > a > div.density-full-card-img > img | /th?id=OCGE.9n7c9gz12jtz_v6_main&pid=uxf&rf=hubstream_fal... | 8.6 KiB | 7.4 KiB |
These insights are also available in the Chrome DevTools Performance Panel - record a trace to view more detailed information.
Redirects introduce additional delays before the page can be loaded. Learn how to avoid page redirects.
Performance issues directly impact user engagement and conversion rates.
| URL | Time Spent |
|---|---|
| msn.com/ | 265 ms |
| www.msn.com/ | 205 ms |
| www.msn.com/fr-fr | 0.0 ms |
These are the largest layout shifts observed on the page. Each table item represents a single layout shift, and shows the element that shifted the most. Below each item are possible root causes that led to the layout shift. Some of these layout shifts may not be included in the CLS metric value due to windowing. Learn how to improve CLS
Performance issues directly impact user engagement and conversion rates.
| Element | Layout shift score |
|---|---|
div#entry-point-hp-wc-root-wrapper div#entry-point-hp-wc-root-wrapper | 0.028 |
div#waterfallFeedHolder div#waterfallFeedHolder | 0.022 |
div#entry-point-hp-wc-root-wrapper div#entry-point-hp-wc-root-wrapper | 0.007 |
div#entry-point-hp-wc-root-wrapper div#entry-point-hp-wc-root-wrapper | 0.006 |
Microsoft se soucie de votre vie privée
Microsoft et nos fournisseurs tiers uti… body > div#onetrust-consent-sdk > div#onetrust-banner-sdk | 0.006 |
div#entry-point-hp-wc-root-wrapper div#entry-point-hp-wc-root-wrapper | 0.005 |
Microsoft se soucie de votre vie privée
Microsoft et nos fournisseurs tiers uti… body > div#onetrust-consent-sdk > div#onetrust-banner-sdk | 0.004 |
div#entry-point-hp-wc-root-wrapper div#entry-point-hp-wc-root-wrapper | 0.004 |
div#entry-point-hp-wc-root-wrapper div#entry-point-hp-wc-root-wrapper | 0.004 |
Microsoft se soucie de votre vie privée
Microsoft et nos fournisseurs tiers uti… body > div#onetrust-consent-sdk > div#onetrust-banner-sdk | 0.003 |
div#entry-point-hp-wc-root-wrapper div#entry-point-hp-wc-root-wrapper | 0.003 |
div#entry-point-hp-wc-root-wrapper div#entry-point-hp-wc-root-wrapper | 0.002 |
div#entry-point-hp-wc-root-wrapper div#entry-point-hp-wc-root-wrapper | 0.002 |
div#entry-point-hp-wc-root-wrapper div#entry-point-hp-wc-root-wrapper | 0.002 |
Microsoft se soucie de votre vie privée
Microsoft et nos fournisseurs tiers uti… body > div#onetrust-consent-sdk > div#onetrust-banner-sdk | 0.002 |
Time to Interactive is the amount of time it takes for the page to become fully interactive. Learn more about the Time to Interactive metric.
Performance issues directly impact user engagement and conversion rates.
The maximum potential First Input Delay that your users could experience is the duration of the longest task. Learn more about the Maximum Potential First Input Delay metric.
Performance issues directly impact user engagement and conversion rates.
Reduce unused JavaScript and defer loading scripts until they are required to decrease bytes consumed by network activity. Learn how to reduce unused JavaScript.
Multi-megabyte JavaScript bundles delay every interactive feature on the page.
This is the Lighthouse audit fired when too much JS is shipped relative to what executes. The fix isn't a config flag — it requires bundle analysis (webpack-bundle-analyzer, rollup-plugin-visualizer), splitting routes into chunks, lazy-loading off-screen components, and removing unused dependencies. Fundamentally different from minification: minifying reduces byte count, this reduces what's downloaded at all.
Source: Google web.dev / Lighthouse
Consider reducing the time spent parsing, compiling, and executing JS. You may find delivering smaller JS payloads helps with this. Learn how to reduce Javascript execution time.
Performance issues directly impact user engagement and conversion rates.
Consider reducing the time spent parsing, compiling and executing JS. You may find delivering smaller JS payloads helps with this. Learn how to minimize main-thread work
Performance issues directly impact user engagement and conversion rates.
| Category | Time Spent |
|---|---|
| Script Evaluation | 2.8 s |
| Other | 1.3 s |
| Style & Layout | 355 ms |
| Script Parsing & Compilation | 255 ms |
| Rendering | 184 ms |
| Parse HTML & CSS | 127 ms |
| Garbage Collection | 115 ms |
Many navigations are performed by going back to a previous page, or forwards again. The back/forward cache (bfcache) can speed up these return navigations. Learn more about the bfcache
Performance issues directly impact user engagement and conversion rates.
| Failure reason | Failure type |
|---|---|
| The page has an unload handler in the main frame. | Actionable |
| Pages with cache-control:no-store header cannot enter back/forward cache. | Actionable |
| Pages whose main resource has cache-control:no-store cannot enter back/forward cache. | Not actionable |
| Back/forward cache is disabled because some JavaScript network request received resource with Cache-Control: no-store header. | Not actionable |
Reduce unused rules from stylesheets and defer CSS not used for above-the-fold content to decrease bytes consumed by network activity. Learn how to reduce unused CSS.
Performance issues directly impact user engagement and conversion rates.
| URL | Transfer Size | Est Savings |
|---|---|---|
| 22.4 KiB | 19.2 KiB | |
| .mectrl_resetStyle,a.mectrl_resetStyle,button.mectrl_resetStyle{height:auto;min-width:auto; … } … | 15.2 KiB | 14.8 KiB |
| .mectrl_resetStyle,a.mectrl_resetStyle,button.mectrl_resetStyle{height:auto;min-width:auto; … } … | 10.3 KiB | 10.2 KiB |
Large network payloads cost users real money and are highly correlated with long load times. Learn how to reduce payload sizes.
Performance issues directly impact user engagement and conversion rates.
More information about the performance of your application. These numbers don't directly affect the Performance score.
These checks highlight opportunities to improve the accessibility of your web app. Automatic detection can only detect a subset of issues and does not guarantee the accessibility of your web app, so manual testing is also encouraged.
Low-contrast text is difficult or impossible for many users to read. Learn how to provide sufficient color contrast.
Performance issues directly impact user engagement and conversion rates.
| Failing Elements |
|---|
Accéder div.wrapper > div.container > div.action-dismiss-container > a#banner-button1 |
These are opportunities to improve the legibility of your content.
Visible text labels that do not match the accessible name can result in a confusing experience for screen reader users. Learn more about accessible names.
Performance issues directly impact user engagement and conversion rates.
| Failing Elements |
|---|
Décorez votre Bureau avec un fond d’écran Bing Wallpaper
Explorez le monde ave… div.wrapper > div.container > div.image-text-container > a.headline-lead-container |
Non merci div.wrapper > div.container > div.action-dismiss-container > a#dismissButton |
Accéder div.wrapper > div.container > div.action-dismiss-container > a#banner-button1 |
Amazon
Sponsorisé div.me-stripe-tile-content > a.me-stripe-tile-button |
Booking.com
Sponsorisé div.me-stripe-tile-content > a.me-stripe-tile-button |
eBay
Sponsorisé div.me-stripe-tile-content > a.me-stripe-tile-button |
25
°C div.weather-top-template > div.weather-current-leftpane > div.weather-current-temp-container > a.weather-current-temperature |
Image display dimensions should match natural aspect ratio. Learn more about image aspect ratio.
Performance issues directly impact user engagement and conversion rates.
| URL | Aspect Ratio (Displayed) | Aspect Ratio (Actual) | |
|---|---|---|---|
Les 10 Compagnies Aériennes Les Plus Détestées Par Les Voyageurs cs-card.card-outer > cs-content-card#contentcard_AA1Qz6jp > div > img.card-image | /tenant/amp/entityid/AA1Qzhxd.img?w=220&h=124&q=60&m=6&f=... | 200 x 126 (1.59) | 220 x 124 (1.77) |
Ce que personne ne disait sur le plongeon de la mort à 10 mètres cs-card.card-outer > cs-content-card#contentcard_AA1TSm45 > div > img.card-image | /tenant/amp/entityid/AA1TSwhS.img?w=220&h=124&q=60&m=6&f=... | 200 x 126 (1.59) | 220 x 124 (1.77) |
Kanye West à Marseille : le rappeur controversé jette l'éponge après le blocage… cs-card.card-outer > cs-content-card#contentcard_AA20Xr8D > div > img.card-image | /tenant/amp/entityid/AA20X7jm.img?w=220&h=124&q=60&m=6&f=... | 200 x 126 (1.59) | 220 x 124 (1.77) |
Que se passe-t-il quand une 911 GTS prend un virage trop vite ? cs-card.card-outer > cs-content-card#contentcard_AA1ZTmXM > div > img.card-image | /tenant/amp/entityid/AA1ZTJF9.img?w=220&h=124&q=60&m=6&f=... | 200 x 126 (1.59) | 220 x 124 (1.77) |
Le McDo japonais nous met la honte cs-card.card-outer > cs-content-card#contentcard_AA1WzpUs > div > img.card-image | /tenant/amp/entityid/AA1ZgzBr.img?w=220&h=124&q=60&m=6&f=... | 200 x 126 (1.59) | 220 x 124 (1.77) |
J'ai testé le Tu-22M, le cauchemar des porte-avions cs-card.card-outer > cs-content-card#contentcard_AA1VLd5f > div > img.card-image | /tenant/amp/entityid/AA1Xrm3w.img?w=220&h=124&q=60&m=6&f=... | 200 x 126 (1.59) | 220 x 124 (1.77) |
Des Frères À L'Écran Qui Étaient En Couple Dans La Vraie Vie cs-card.card-outer > cs-content-card#contentcard_AA1VN2w5 > div > img.card-image | /tenant/amp/entityid/AA1VMOvj.img?w=220&h=124&q=60&m=6&f=... | 200 x 126 (1.59) | 220 x 124 (1.77) |
Regarde ce qui se passe quand un pit-bull attaque - 1 morsure et il ne lâche pl… cs-card.card-outer > cs-content-card#contentcard_AA1ZrKvd > div > img.card-image | /tenant/amp/entityid/AA1Zr6oj.img?w=220&h=124&q=60&m=6&f=... | 200 x 126 (1.59) | 220 x 124 (1.77) |
L’homme d’affaires et escroc Éric Robic exécuté en pleine rue à Neuilly cs-card.card-outer > cs-content-card#contentcard_AA211O8K > div > img.card-image | /tenant/amp/entityid/AA211hbR.img?w=220&h=124&q=60&m=6&f=... | 200 x 126 (1.59) | 220 x 124 (1.77) |
Regarde ce qui se passe quand une orque de 5 tonnes attaque - « Elle ne lâche p… cs-card.card-outer > cs-content-card#contentcard_AA1ZmyeA > div > img.card-image | /tenant/amp/entityid/AA1Zmr2M.img?w=220&h=124&q=60&m=6&f=... | 200 x 126 (1.59) | 220 x 124 (1.77) |
Regarde ce qui se passe quand un tigre de 300 kg attaque - « il vise la gorge » cs-card.card-outer > cs-content-card#contentcard_AA20zp9h > div > img.card-image | /tenant/amp/entityid/AA20z07c.img?w=220&h=124&q=60&m=6&f=... | 200 x 126 (1.59) | 220 x 124 (1.77) |
Vues aériennes de Brisbane, Australie, partie 1 Thumbnail cs-card.card-outer > cs-content-card#contentcard_AA1UdKIa > div > img.card-image | /tenant/amp/entityid/AA1UdWqa.img?w=220&h=124&q=60&m=6&f=... | 200 x 126 (1.59) | 220 x 124 (1.77) |
Il volait à 2 286 mètres d’altitude - puis il s’est écrasé cs-card.card-outer > cs-content-card#contentcard_AA20QMwR > div > img.card-image | /tenant/amp/entityid/AA20QAf7.img?w=220&h=124&q=60&m=6&f=... | 200 x 126 (1.59) | 220 x 124 (1.77) |
Vues aériennes des îles des Caraïbes, partie 7 Thumbnail cs-card.card-outer > cs-content-card#contentcard_AA201AnB > div > img.card-image | /tenant/amp/entityid/AA201nDx.img?w=220&h=124&q=60&m=6&f=... | 200 x 126 (1.59) | 220 x 124 (1.77) |
Explosion meurtrière à Beyrouth filmée – quelques secondes avant la catastrophe cs-card.card-outer > cs-content-card#contentcard_AA20LeqD > div > img.card-image | /tenant/amp/entityid/AA20Lw0n.img?w=220&h=124&q=60&m=6&f=... | 200 x 126 (1.59) | 220 x 124 (1.77) |
Quand Mars nous joue des tours : un casque extraterrestre ? cs-card.card-outer > cs-content-card#contentcard_AA20rS4B > div > img.card-image | /tenant/amp/entityid/AA1UqgkJ.img?w=220&h=124&q=60&m=6&f=... | 200 x 126 (1.59) | 220 x 124 (1.77) |
Explorer la Jordanie vue du ciel Thumbnail cs-card.card-outer > cs-content-card#contentcard_AA1XwpzX > div > img.card-image | /tenant/amp/entityid/AA1XwfMD.img?w=220&h=124&q=60&m=6&f=... | 200 x 126 (1.59) | 220 x 124 (1.77) |
Lieux abandonnés vus par des drones en vue subjective, partie 3 Thumbnail cs-card.card-outer > cs-content-card#contentcard_AA1Un8rc > div > img.card-image | /tenant/amp/entityid/AA1UmYfk.img?w=220&h=124&q=60&m=6&f=... | 200 x 126 (1.59) | 220 x 124 (1.77) |
Les monuments historiques d'Europe, vus d'en haut, partie 2 Thumbnail cs-card.card-outer > cs-content-card#contentcard_AA1EfhAY > div > img.card-image | /tenant/amp/entityid/AA1EfmFQ.img?w=220&h=124&q=60&m=6&f=... | 200 x 126 (1.59) | 220 x 124 (1.77) |
Superbes vues aériennes d'Ostuni, la ville blanche des Pouilles, en Italie cs-card.card-outer > cs-content-card#contentcard_AA1G7tnM > div > img.card-image | /tenant/amp/entityid/AA1G7tnG.img?w=220&h=124&q=60&m=6&f=... | 200 x 126 (1.59) | 220 x 124 (1.77) |
Deprecated APIs will eventually be removed from the browser. Learn more about deprecated APIs.
Performance issues directly impact user engagement and conversion rates.
| Deprecation / Warning | Source |
|---|---|
| Unload event listeners are deprecated and will be removed. | |
| Synchronous XMLHttpRequest on the main thread is deprecated because of its detrimental effects to the end user's experience. For more help, check https://xhr.spec.whatwg.org/. |
Errors logged to the console indicate unresolved problems. They can come from network request failures and other browser concerns. Learn more about this errors in console diagnostic audit
Performance issues directly impact user engagement and conversion rates.
| Source | Description |
|---|---|
Failed to load resource: the server responded with a status of 404 () |
Issues logged to the `Issues` panel in Chrome Devtools indicate unresolved problems. They can come from network request failures, insufficient security controls, and other browser concerns. Open up the Issues panel in Chrome DevTools for more details on each issue.
Performance issues directly impact user engagement and conversion rates.
| Issue type |
|---|
| Cookie |
Source maps translate minified code to the original source code. This helps developers debug in production. In addition, Lighthouse is able to provide further insights. Consider deploying source maps to take advantage of these benefits. Learn more about source maps.
Performance issues directly impact user engagement and conversion rates.
These checks ensure that your page is following basic search engine optimization advice. There are many additional factors Lighthouse does not score here that may affect your search ranking, including performance on Core Web Vitals. Learn more about Google Search Essentials.
Send Feedback