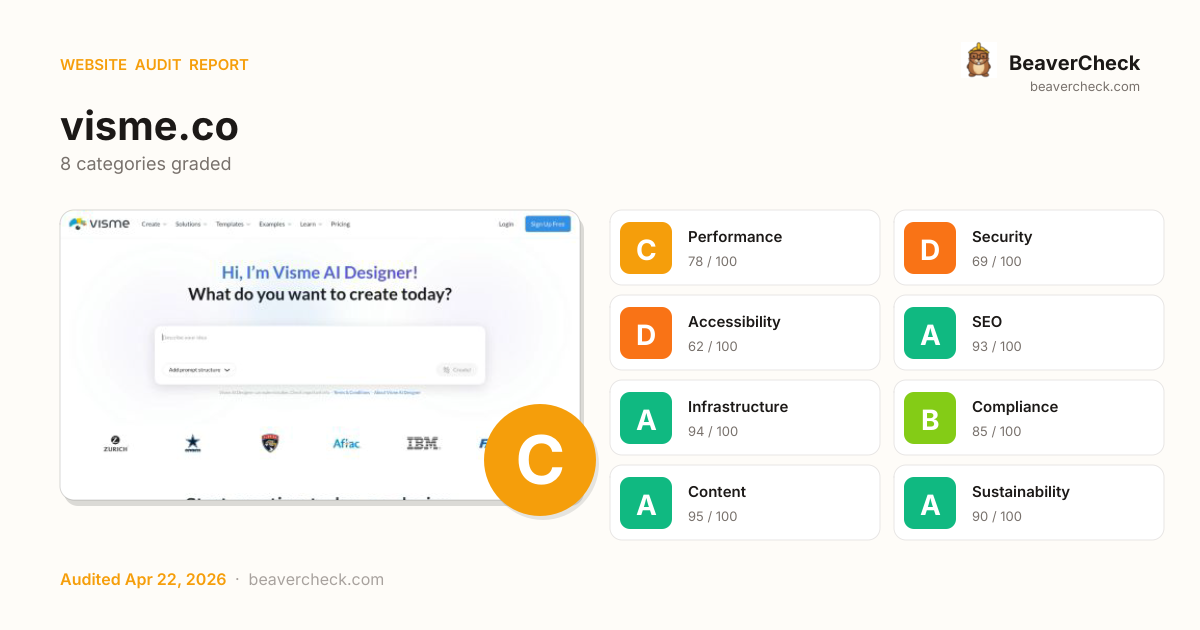
Mobile 375 × 812

Desktop 1440 × 900

Score: 78 / 100
Based on 8 categories, 0 sections
Decent speed, but optimizing further could improve engagement.
Several missing protections leave your users and data exposed.
Several issues make your site difficult for assistive technology users.
Well-optimized for search — your content is discoverable.
Solid infrastructure — fast server responses across the board.
Strong compliance posture across regulations.
Rich content metadata — your pages look great everywhere.
Lean and efficient — low environmental impact per visit.
The overall score is a weighted average of individual category scores. Categories with more impact on user experience and security carry more weight.
Weights reflect general web best practices. Individual needs may differ.
Content-Security-Policy header is missing
Security gaps expose your site and users to attacks, eroding trust.
No Content-Security-Policy header found
Security gaps expose your site and users to attacks, eroding trust.
1 image(s) missing alt attribute
Accessibility issues exclude users with disabilities — up to 15% of your potential audience.
2 button(s) with no accessible text
Accessibility issues exclude users with disabilities — up to 15% of your potential audience.
3 control(s) without accessible label
Accessibility issues exclude users with disabilities — up to 15% of your potential audience.
High impact, low effort — start here.
High impact, requires investment.
Small gains, minimal effort.
Nothing in this quadrant — good news.
Low impact, high effort — do last.
Nothing in this quadrant — good news.
[](https://beavercheck.com/results/0e5e7d38-9855-4ef7-93e6-62392d9cc5d3)<a href="https://beavercheck.com/results/0e5e7d38-9855-4ef7-93e6-62392d9cc5d3"><img src="https://beavercheck.com/badge?url=https%3A%2F%2Fvisme.co" alt="BeaverCheck Score"></a>https://beavercheck.com/badge?url=https%3A%2F%2Fvisme.coThis badge auto-updates with your latest scan result.
Your site performs reasonably well, but a few targeted fixes could meaningfully improve results. Addressing the critical issues below would have the most immediate impact on your user trust.
8 barrier(s) likely increasing bounce by ~27%.
Page loads in 2.9s
+5% bounceEvery additional 100ms above 2.5s costs conversions — you're 420ms over
Fix: Target <2.5s LCP: defer non-critical scripts and optimize the hero image
Page feels frozen for 1.3s
+5% bounceClicks on the primary CTA are ignored while JavaScript runs
Fix: Break up long tasks; defer non-critical JavaScript to post-hydration
No Content-Security-Policy header
+1% bounceHigher XSS blast radius — one compromised script can exfiltrate the checkout form
Fix: Ship a reporting-only CSP first, then enforce once violations are clean
3 form field(s) without a label
+6% bounceScreen readers skip unlabeled fields; autofill can't identify them; checkout abandonment spikes
Fix: Associate every input with a visible <label for="…">; add autocomplete attributes
Content is hard to read
+2% bounceGraduate-level reading difficulty — limits the addressable audience for product or blog pages
Fix: Shorten sentences; replace jargon with plain language; target Flesch ease ≥60
7 link(s) with generic text ("click here", "read more")
+1% bounceScreen-reader users navigating by link list see no context — and search engines can't infer relevance
Fix: Rewrite with descriptive phrases that identify the destination
No skip-to-content link
+1% bounceKeyboard and screen-reader users must tab through the entire header on every page
Fix: Add a visible-on-focus <a href="#main">Skip to content</a> as the first focusable element
1 broken link(s) on the page
+2% bounceClicks land on 404s — trust drops and the session often ends
Fix: Fix or remove the broken destinations surfaced on the Content tab
Preliminary CRO audit — each barrier links to the tab with detailed analysis.
$550 investment → $791/month returns + USD 157,500 risk avoided
$550
6h · 5 findings
$791 /mo
~$9,494 / year
USD 157,500
if kept compliant
$100 — in quick wins — start here for the fastest payback
Figures combine localized regulatory fine ceilings, search/conversion value priced against local CPC, and bandwidth waste estimates. Results depend on implementation quality and audience composition. Not legal or financial advice.
5.5 developer hours at $100/hr
Based on United States rates ($100/hr)
Start here for the best return on investment
$13,125 / month at risk
~$157,504 / year if left unfixed
$157,500
+4 more
$0.37 /mo
4580.6 MB/mo × 0.080 USD/GB
Compliance figures represent the statutory maximum fine for the most severe triggered category, capped per regulation — not the sum of per-finding penalties. Based on published regulatory fine ranges. This is not legal advice.
Unique monthly visitors from your analytics
Purchases, signups, or key actions
Optional — for revenue estimation
more engaged visitors from reduced bounce
Fix 5 critical issues to capture this value
Based on Google/Deloitte research ("Milliseconds Make Millions") showing a ~7% bounce rate increase per additional second of LCP above the 2.5s "Good" threshold.
Your site's LCP: → estimated after fixes.
These are estimates based on industry research — actual results vary
Your data stays in your browser — nothing is sent to our servers
Thanks for your feedback!
We'll use a cached audit if available, or offer to scan.
Industry-standard audits powered by Google Lighthouse.
Key metrics that affect user experience.
First Contentful Paint First Contentful Paint — how long until the browser renders the first piece of content. Under 1.8s is good.
1.96 s
Largest Contentful Paint Largest Contentful Paint — how long until the largest visible element loads. Under 2.5s is good.
2.92 s
Total Blocking Time Total Blocking Time — total time the main thread was blocked, preventing user input. Under 200ms is good.
1.29 s
Cumulative Layout Shift Cumulative Layout Shift — measures visual stability. How much the page layout shifts during loading. Under 0.1 is good.
0.003
Speed Index Speed Index — how quickly content is visually displayed during load. Under 3.4s is good.
2.46 s
Time to Interactive Time to Interactive — how long until the page is fully interactive and responds to user input. Under 3.8s is good.
14.90 s
Audit breakdown by category with detailed findings.
Remove large, duplicate JavaScript modules from bundles to reduce unnecessary bytes consumed by network activity.
Performance issues directly impact user engagement and conversion rates.
Polyfills and transforms enable older browsers to use new JavaScript features. However, many aren't necessary for modern browsers. Consider modifying your JavaScript build process to not transpile Baseline features, unless you know you must support older browsers. Learn why most sites can deploy ES6+ code without transpiling
Shipping ES5 transpiled code to modern browsers wastes bytes — every user with an evergreen browser pays for compatibility you don't need.
Most users today run browsers that natively support ES6+, async/await, optional chaining, and the rest of modern JavaScript. Transpiling to ES5 'just in case' adds 20-40% to your bundle for no benefit. Configure your build to target a modern browserslist, or ship a differential bundle pair (modern + legacy) with the module/nomodule pattern.
Source: Google web.dev / Lighthouse
3rd party code can significantly impact load performance. Reduce and defer loading of 3rd party code to prioritize your page's content.
Performance issues directly impact user engagement and conversion rates.
A forced reflow occurs when JavaScript queries geometric properties (such as offsetWidth) after styles have been invalidated by a change to the DOM state. This can result in poor performance. Learn more about forced reflows and possible mitigations.
Performance issues directly impact user engagement and conversion rates.
Avoid chaining critical requests by reducing the length of chains, reducing the download size of resources, or deferring the download of unnecessary resources to improve page load.
Performance issues directly impact user engagement and conversion rates.
A long cache lifetime can speed up repeat visits to your page. Learn more about caching.
Performance issues directly impact user engagement and conversion rates.
| Request | Cache TTL | Transfer Size |
|---|---|---|
| js.hs-analytics.net/analytics/1776896400000/21774584.js | 300.0 s | 42.3 KiB |
| js.usemessages.com/conversations-embed.js | 600.0 s | 33.0 KiB |
| js.hubspot.com/web-interactives-embed.js | 600.0 s | 28.5 KiB |
| js.hs-banner.com/v2/21774584/banner.js | 300.0 s | 24.1 KiB |
| snap.licdn.com/li.lms-analytics/insight.min.js | 86400.0 s | 18.7 KiB |
| /beacon.min.js/v8c78df7c7c0f484497ecbca7046644da177152312... | 86400.0 s | 10.7 KiB |
| js.hsadspixel.net/pixels.js | 600.0 s | 3.9 KiB |
| script.crazyegg.com/pages/scripts/0071/0991.js | 300.0 s | 2.7 KiB |
| cdn.firstpromoter.com/fpr.js | 0.0 ms | 2.5 KiB |
| js.hs-scripts.com/21774584.js | 90.0 s | 1.1 KiB |
| /collect?v=2&fmt=js&pid=1201353&time=1776896567633&li_ads... | 0.0 ms | 453 B |
| dashboard.visme.co/register-visme3.js | 691200.0 s | 2.5 KiB |
Your first network request is the most important. Reduce its latency by avoiding redirects, ensuring a fast server response, and enabling text compression.
Performance issues directly impact user engagement and conversion rates.
Reducing the download time of images can improve the perceived load time of the page and LCP. Learn more about optimizing image size
Performance issues directly impact user engagement and conversion rates.
| URL | Resource Size | Est Savings | |
|---|---|---|---|
Collaboration div.col-lg-4 > div.bg-white > picture.d-block > img.br-12 | www.visme.co/wp-content/themes/visme/images/2022/teams/hp-team-1@2x.webp | 229.6 KiB | 216.9 KiB |
Precise communication div.col-lg-4 > div.bg-white > picture.d-block > img.br-12 | www.visme.co/wp-content/themes/visme/images/2022/teams/hp-team-2@2x.webp | 70.9 KiB | 59.2 KiB |
div.visme-video-hero > div.visme-video-hero__video-wrapper > picture > img.visme-video-hero__preview div.visme-video-hero > div.visme-video-hero__video-wrapper > picture > img.visme-video-hero__preview | www.visme.co/wp-content/themes/visme/images/2022/hero/homepage/video-preview.jpg | 51.3 KiB | 47.0 KiB |
div.flickity-viewport > div.flickity-slider > div.visme-companies-slider-item > div.visme-companies-slider-item-logo div.flickity-viewport > div.flickity-slider > div.visme-companies-slider-item > div.visme-companies-slider-item-logo | www.visme.co/wp-content/themes/visme/images/partners/florida-panthers.png | 12.6 KiB | 5.3 KiB |
li.visme-types__item > a.visme-types__link > div.visme-type__wrapper > div.visme-type__thumb li.visme-types__item > a.visme-types__link > div.visme-type__wrapper > div.visme-type__thumb | www.visme.co/wp-content/themes/visme/images/2024/homepage/data.png | 6.4 KiB | 4.3 KiB |
li.visme-types__item > a.visme-types__link > div.visme-type__wrapper > div.visme-type__thumb li.visme-types__item > a.visme-types__link > div.visme-type__wrapper > div.visme-type__thumb | www.visme.co/wp-content/themes/visme/images/2024/homepage/whiteboards.png | 6.1 KiB | 4.0 KiB |
Requests are blocking the page's initial render, which may delay LCP. Deferring or inlining can move these network requests out of the critical path.
Performance issues directly impact user engagement and conversion rates.
These insights are also available in the Chrome DevTools Performance Panel - record a trace to view more detailed information.
Redirects introduce additional delays before the page can be loaded. Learn how to avoid page redirects.
Performance issues directly impact user engagement and conversion rates.
| URL | Time Spent |
|---|---|
| visme.co/ | 756 ms |
| www.visme.co/ | 0.0 ms |
Time to Interactive is the amount of time it takes for the page to become fully interactive. Learn more about the Time to Interactive metric.
Performance issues directly impact user engagement and conversion rates.
The maximum potential First Input Delay that your users could experience is the duration of the longest task. Learn more about the Maximum Potential First Input Delay metric.
Performance issues directly impact user engagement and conversion rates.
Consider reducing the time spent parsing, compiling, and executing JS. You may find delivering smaller JS payloads helps with this. Learn how to reduce Javascript execution time.
Performance issues directly impact user engagement and conversion rates.
Consider reducing the time spent parsing, compiling and executing JS. You may find delivering smaller JS payloads helps with this. Learn how to minimize main-thread work
Performance issues directly impact user engagement and conversion rates.
| Category | Time Spent |
|---|---|
| Script Evaluation | 2.7 s |
| Other | 1.7 s |
| Style & Layout | 1.2 s |
| Script Parsing & Compilation | 405 ms |
| Rendering | 393 ms |
| Parse HTML & CSS | 120 ms |
| Garbage Collection | 61 ms |
Many navigations are performed by going back to a previous page, or forwards again. The back/forward cache (bfcache) can speed up these return navigations. Learn more about the bfcache
Performance issues directly impact user engagement and conversion rates.
| Failure reason | Failure type |
|---|---|
| The page has an unload handler in a sub frame. | Actionable |
Reduce unused JavaScript and defer loading scripts until they are required to decrease bytes consumed by network activity. Learn how to reduce unused JavaScript.
Multi-megabyte JavaScript bundles delay every interactive feature on the page.
This is the Lighthouse audit fired when too much JS is shipped relative to what executes. The fix isn't a config flag — it requires bundle analysis (webpack-bundle-analyzer, rollup-plugin-visualizer), splitting routes into chunks, lazy-loading off-screen components, and removing unused dependencies. Fundamentally different from minification: minifying reduces byte count, this reduces what's downloaded at all.
Source: Google web.dev / Lighthouse
| URL | Transfer Size | Est Savings |
|---|---|---|
| www.googletagmanager.com/gtag/js?id=AW-1053096647&cx=c>m=4e64k0 | 144.3 KiB | 105.9 KiB |
| www.googletagmanager.com/gtag/js?id=G-QXSBG5DLSV | 177.2 KiB | 58.4 KiB |
| www.googletagmanager.com/gtag/js?id=AW-1053096647 | 144.3 KiB | 55.7 KiB |
| /pages/versioned/commontransformations-scripts/df70602680... | 71.7 KiB | 35.3 KiB |
More information about the performance of your application. These numbers don't directly affect the Performance score.
These checks highlight opportunities to improve the accessibility of your web app. Automatic detection can only detect a subset of issues and does not guarantee the accessibility of your web app, so manual testing is also encouraged.
Focusable descendents within an `[aria-hidden="true"]` element prevent those interactive elements from being available to users of assistive technologies like screen readers. Learn how `aria-hidden` affects focusable elements.
Performance issues directly impact user engagement and conversion rates.
| Failing Elements |
|---|
“In this digital age, social media is playing an increasingly larger role in th… div.visme-testimonial-slider > div.flickity-viewport > div.flickity-slider > div.visme-testimonial-slider__slide |
“At the Broncos, we recommend Visme to other teams, brands, or organizations lo… div.visme-testimonial-slider > div.flickity-viewport > div.flickity-slider > div.visme-testimonial-slider__slide |
“We use Visme not just for reporting but also for engaging our stakeholders and… div.visme-testimonial-slider > div.flickity-viewport > div.flickity-slider > div.visme-testimonial-slider__slide |
“The hours saved each month from meeting time, working back and forth between t… div.visme-testimonial-slider > div.flickity-viewport > div.flickity-slider > div.visme-testimonial-slider__slide |
“It’s easy to create something in Visme quickly that looks like we sent it out … div.visme-testimonial-slider > div.flickity-viewport > div.flickity-slider > div.visme-testimonial-slider__slide |
“I absolutely recommend Visme due to its dynamic functionality and ability to i… div.visme-testimonial-slider > div.flickity-viewport > div.flickity-slider > div.visme-testimonial-slider__slide |
“Visme is something that I would highly recommend. It made us look a lot better… div.visme-testimonial-slider > div.flickity-viewport > div.flickity-slider > div.visme-testimonial-slider__slide |
These are opportunities to improve the usage of ARIA in your application which may enhance the experience for users of assistive technology, like a screen reader.
Low-contrast text is difficult or impossible for many users to read. Learn how to provide sufficient color contrast.
Performance issues directly impact user engagement and conversion rates.
| Failing Elements |
|---|
Sign up free div.hero > div.container > button.d-inline-block > span |
CASE STUDIES main.has-sticky-menu > section.pt-5 > div.container > p.user-select-none |
Read this case study div > div.visme-testimonial-slider__slide-author > p.ps-1 > a.visme-testimonial-slider__slide-button |
FEATURES main.has-sticky-menu > section.pt-5 > div.container > p.text-center |
TEAMWORK main.has-sticky-menu > section.pt-5 > div.container > p.text-center |
CREATE FROM A TO Z main.has-sticky-menu > section.pt-5 > div.container > p.text-center |
SOLUTIONS FOR EVERYONE main.has-sticky-menu > section.pt-5 > div.container > p.text-center |
INTEGRATIONS main.has-sticky-menu > section.pt-5 > div.container > p.text-center |
CREATE div.footer-container > div.block-menus-container > div.menus-container > strong.heading |
USE CASES div.footer-container > div.block-menus-container > div.menus-container > strong.heading |
RESOURCES div.footer-container > div.block-menus-container > div.menus-container > strong.heading |
COMPANY div.footer-container > div.block-menus-container > div.menus-container > strong.heading |
SUPPORT div.footer-container > div.block-menus-container > div.menus-container > strong.heading |
RECENT FEATURES & ARTICLES footer.footer-21-v1 > div.footer-container > div.block-blog-container > strong.heading |
Copyright 2026 Easy WebContent, LLC. (DBA Visme). All rights reserved. Proudly … footer.footer-21-v1 > div.footer-container > div.block-menus-container > p.copyright |
These are opportunities to improve the legibility of your content.
Deprecated APIs will eventually be removed from the browser. Learn more about deprecated APIs.
Performance issues directly impact user engagement and conversion rates.
| Deprecation / Warning | Source |
|---|---|
| AttributionReporting | www.googleadservices.com/pagead/conversion_async.js line 31, col 421 |
These checks ensure that your page is following basic search engine optimization advice. There are many additional factors Lighthouse does not score here that may affect your search ranking, including performance on Core Web Vitals. Learn more about Google Search Essentials.
Descriptive link text helps search engines understand your content. Learn how to make links more accessible.
Performance issues directly impact user engagement and conversion rates.
| Link destination | Link Text |
|---|---|
| www.visme.co/templates/ | More |
| www.visme.co/graph-maker/ | Learn more |
| www.visme.co/templates/ | Learn more |
| www.visme.co/brand-design-tool/ | Learn more |
| www.visme.co/social-media-scheduler/ | Learn more |
| www.visme.co/icon-finder/ | Learn more |
| www.visme.co/animation-interactivity/ | Learn more |
Format your HTML in a way that enables crawlers to better understand your app’s content.
Industry-standard audits powered by Google Lighthouse. — Desktop
Key metrics that affect user experience. — Desktop
First Contentful Paint First Contentful Paint — how long until the browser renders the first piece of content. Under 1.8s is good.
551 ms
Largest Contentful Paint Largest Contentful Paint — how long until the largest visible element loads. Under 2.5s is good.
965 ms
Total Blocking Time Total Blocking Time — total time the main thread was blocked, preventing user input. Under 200ms is good.
46 ms
Cumulative Layout Shift Cumulative Layout Shift — measures visual stability. How much the page layout shifts during loading. Under 0.1 is good.
0.019
Speed Index Speed Index — how quickly content is visually displayed during load. Under 3.4s is good.
1.51 s
Time to Interactive Time to Interactive — how long until the page is fully interactive and responds to user input. Under 3.8s is good.
3.88 s
Audit breakdown by category with detailed findings.
Remove large, duplicate JavaScript modules from bundles to reduce unnecessary bytes consumed by network activity.
Performance issues directly impact user engagement and conversion rates.
Polyfills and transforms enable older browsers to use new JavaScript features. However, many aren't necessary for modern browsers. Consider modifying your JavaScript build process to not transpile Baseline features, unless you know you must support older browsers. Learn why most sites can deploy ES6+ code without transpiling
Shipping ES5 transpiled code to modern browsers wastes bytes — every user with an evergreen browser pays for compatibility you don't need.
Most users today run browsers that natively support ES6+, async/await, optional chaining, and the rest of modern JavaScript. Transpiling to ES5 'just in case' adds 20-40% to your bundle for no benefit. Configure your build to target a modern browserslist, or ship a differential bundle pair (modern + legacy) with the module/nomodule pattern.
Source: Google web.dev / Lighthouse
3rd party code can significantly impact load performance. Reduce and defer loading of 3rd party code to prioritize your page's content.
Performance issues directly impact user engagement and conversion rates.
A forced reflow occurs when JavaScript queries geometric properties (such as offsetWidth) after styles have been invalidated by a change to the DOM state. This can result in poor performance. Learn more about forced reflows and possible mitigations.
Performance issues directly impact user engagement and conversion rates.
Avoid chaining critical requests by reducing the length of chains, reducing the download size of resources, or deferring the download of unnecessary resources to improve page load.
Performance issues directly impact user engagement and conversion rates.
A long cache lifetime can speed up repeat visits to your page. Learn more about caching.
Performance issues directly impact user engagement and conversion rates.
| Request | Cache TTL | Transfer Size |
|---|---|---|
| js.hs-analytics.net/analytics/1776896400000/21774584.js | 300.0 s | 42.3 KiB |
| js.usemessages.com/conversations-embed.js | 600.0 s | 33.0 KiB |
| js.hubspot.com/web-interactives-embed.js | 600.0 s | 28.5 KiB |
| js.hs-banner.com/v2/21774584/banner.js | 300.0 s | 24.1 KiB |
| snap.licdn.com/li.lms-analytics/insight.min.js | 86400.0 s | 18.7 KiB |
| /beacon.min.js/v8c78df7c7c0f484497ecbca7046644da177152312... | 86400.0 s | 10.7 KiB |
| js.hsadspixel.net/pixels.js | 600.0 s | 3.9 KiB |
| script.crazyegg.com/pages/scripts/0071/0991.js | 300.0 s | 2.7 KiB |
| cdn.firstpromoter.com/fpr.js | 0.0 ms | 2.5 KiB |
| js.hs-scripts.com/21774584.js | 90.0 s | 1.1 KiB |
| /collect?v=2&fmt=js&pid=1201353&time=1776896587097&li_ads... | 0.0 ms | 271 B |
| dashboard.visme.co/register-visme3.js | 691200.0 s | 2.5 KiB |
Your first network request is the most important. Reduce its latency by avoiding redirects, ensuring a fast server response, and enabling text compression.
Performance issues directly impact user engagement and conversion rates.
Reducing the download time of images can improve the perceived load time of the page and LCP. Learn more about optimizing image size
Performance issues directly impact user engagement and conversion rates.
| URL | Resource Size | Est Savings | |
|---|---|---|---|
Collaboration div.col-lg-4 > div.bg-white > picture.d-block > img.br-12 | www.visme.co/wp-content/themes/visme/images/2022/teams/hp-team-1.webp | 75.5 KiB | 60.8 KiB |
div.visme-video-hero > div.visme-video-hero__video-wrapper > picture > img.visme-video-hero__preview div.visme-video-hero > div.visme-video-hero__video-wrapper > picture > img.visme-video-hero__preview | www.visme.co/wp-content/themes/visme/images/2022/hero/homepage/video-preview.jpg | 51.3 KiB | 34.9 KiB |
Precise communication div.col-lg-4 > div.bg-white > picture.d-block > img.br-12 | www.visme.co/wp-content/themes/visme/images/2022/teams/hp-team-2.webp | 26.8 KiB | 7.6 KiB |
Asset management div.col-lg-4 > div.bg-white > picture.d-block > img.br-12 | www.visme.co/wp-content/themes/visme/images/2022/teams/hp-team-3.webp | 25.3 KiB | 6.1 KiB |
div.flickity-viewport > div.flickity-slider > div.visme-companies-slider-item > div.visme-companies-slider-item-logo div.flickity-viewport > div.flickity-slider > div.visme-companies-slider-item > div.visme-companies-slider-item-logo | www.visme.co/wp-content/themes/visme/images/partners/florida-panthers.png | 12.6 KiB | 5.3 KiB |
div.flickity-viewport > div.flickity-slider > div.visme-companies-slider-item > div.visme-companies-slider-item-logo div.flickity-viewport > div.flickity-slider > div.visme-companies-slider-item > div.visme-companies-slider-item-logo | www.visme.co/wp-content/themes/visme/images/partners/denver-broncos.png | 12.2 KiB | 4.9 KiB |
li.visme-types__item > a.visme-types__link > div.visme-type__wrapper > div.visme-type__thumb li.visme-types__item > a.visme-types__link > div.visme-type__wrapper > div.visme-type__thumb | www.visme.co/wp-content/themes/visme/images/2024/homepage/data.png | 6.4 KiB | 4.3 KiB |
li.visme-types__item > a.visme-types__link > div.visme-type__wrapper > div.visme-type__thumb li.visme-types__item > a.visme-types__link > div.visme-type__wrapper > div.visme-type__thumb | www.visme.co/wp-content/themes/visme/images/2024/homepage/whiteboards.png | 6.1 KiB | 4.0 KiB |
Requests are blocking the page's initial render, which may delay LCP. Deferring or inlining can move these network requests out of the critical path.
Performance issues directly impact user engagement and conversion rates.
These insights are also available in the Chrome DevTools Performance Panel - record a trace to view more detailed information.
Redirects introduce additional delays before the page can be loaded. Learn how to avoid page redirects.
Performance issues directly impact user engagement and conversion rates.
| URL | Time Spent |
|---|---|
| visme.co/ | 205 ms |
| www.visme.co/ | 0.0 ms |
Time to Interactive is the amount of time it takes for the page to become fully interactive. Learn more about the Time to Interactive metric.
Performance issues directly impact user engagement and conversion rates.
Consider reducing the time spent parsing, compiling and executing JS. You may find delivering smaller JS payloads helps with this. Learn how to minimize main-thread work
Performance issues directly impact user engagement and conversion rates.
| Category | Time Spent |
|---|---|
| Script Evaluation | 779 ms |
| Other | 624 ms |
| Style & Layout | 388 ms |
| Rendering | 122 ms |
| Script Parsing & Compilation | 97 ms |
| Parse HTML & CSS | 28 ms |
| Garbage Collection | 13 ms |
Many navigations are performed by going back to a previous page, or forwards again. The back/forward cache (bfcache) can speed up these return navigations. Learn more about the bfcache
Performance issues directly impact user engagement and conversion rates.
| Failure reason | Failure type |
|---|---|
| The page has an unload handler in a sub frame. | Actionable |
Reduce unused JavaScript and defer loading scripts until they are required to decrease bytes consumed by network activity. Learn how to reduce unused JavaScript.
Multi-megabyte JavaScript bundles delay every interactive feature on the page.
This is the Lighthouse audit fired when too much JS is shipped relative to what executes. The fix isn't a config flag — it requires bundle analysis (webpack-bundle-analyzer, rollup-plugin-visualizer), splitting routes into chunks, lazy-loading off-screen components, and removing unused dependencies. Fundamentally different from minification: minifying reduces byte count, this reduces what's downloaded at all.
Source: Google web.dev / Lighthouse
| URL | Transfer Size | Est Savings |
|---|---|---|
| www.googletagmanager.com/gtag/js?id=AW-1053096647&cx=c>m=4e64k1 | 144.4 KiB | 105.9 KiB |
| www.googletagmanager.com/gtag/js?id=G-QXSBG5DLSV | 177.2 KiB | 58.2 KiB |
| www.googletagmanager.com/gtag/js?id=AW-1053096647 | 144.3 KiB | 55.6 KiB |
| /pages/versioned/commontransformations-scripts/df70602680... | 71.7 KiB | 25.2 KiB |
More information about the performance of your application. These numbers don't directly affect the Performance score.
These checks highlight opportunities to improve the accessibility of your web app. Automatic detection can only detect a subset of issues and does not guarantee the accessibility of your web app, so manual testing is also encouraged.
Focusable descendents within an `[aria-hidden="true"]` element prevent those interactive elements from being available to users of assistive technologies like screen readers. Learn how `aria-hidden` affects focusable elements.
Performance issues directly impact user engagement and conversion rates.
| Failing Elements |
|---|
“In this digital age, social media is playing an increasingly larger role in th… div.visme-testimonial-slider > div.flickity-viewport > div.flickity-slider > div.visme-testimonial-slider__slide |
“At the Broncos, we recommend Visme to other teams, brands, or organizations lo… div.visme-testimonial-slider > div.flickity-viewport > div.flickity-slider > div.visme-testimonial-slider__slide |
“We use Visme not just for reporting but also for engaging our stakeholders and… div.visme-testimonial-slider > div.flickity-viewport > div.flickity-slider > div.visme-testimonial-slider__slide |
“The hours saved each month from meeting time, working back and forth between t… div.visme-testimonial-slider > div.flickity-viewport > div.flickity-slider > div.visme-testimonial-slider__slide |
“It’s easy to create something in Visme quickly that looks like we sent it out … div.visme-testimonial-slider > div.flickity-viewport > div.flickity-slider > div.visme-testimonial-slider__slide |
“I absolutely recommend Visme due to its dynamic functionality and ability to i… div.visme-testimonial-slider > div.flickity-viewport > div.flickity-slider > div.visme-testimonial-slider__slide |
“Visme is something that I would highly recommend. It made us look a lot better… div.visme-testimonial-slider > div.flickity-viewport > div.flickity-slider > div.visme-testimonial-slider__slide |
These are opportunities to improve the usage of ARIA in your application which may enhance the experience for users of assistive technology, like a screen reader.
Low-contrast text is difficult or impossible for many users to read. Learn how to provide sufficient color contrast.
Performance issues directly impact user engagement and conversion rates.
| Failing Elements |
|---|
Sign Up Free nav.v-nav > ul.v-actions > li.v-action > button.v-action-btn |
CASE STUDIES main.has-sticky-menu > section.pt-5 > div.container > p.user-select-none |
Read this case study div > div.visme-testimonial-slider__slide-author > p.ps-1 > a.visme-testimonial-slider__slide-button |
FEATURES main.has-sticky-menu > section.pt-5 > div.container > p.text-center |
TEAMWORK main.has-sticky-menu > section.pt-5 > div.container > p.text-center |
CREATE FROM A TO Z main.has-sticky-menu > section.pt-5 > div.container > p.text-center |
SOLUTIONS FOR EVERYONE main.has-sticky-menu > section.pt-5 > div.container > p.text-center |
INTEGRATIONS main.has-sticky-menu > section.pt-5 > div.container > p.text-center |
CREATE div.footer-container > div.block-menus-container > div.menus-container > strong.heading |
USE CASES div.footer-container > div.block-menus-container > div.menus-container > strong.heading |
RESOURCES div.footer-container > div.block-menus-container > div.menus-container > strong.heading |
COMPANY div.footer-container > div.block-menus-container > div.menus-container > strong.heading |
SUPPORT div.footer-container > div.block-menus-container > div.menus-container > strong.heading |
RECENT FEATURES & ARTICLES footer.footer-21-v1 > div.footer-container > div.block-blog-container > strong.heading |
Copyright 2026 Easy WebContent, LLC. (DBA Visme). All rights reserved. Proudly … footer.footer-21-v1 > div.footer-container > div.block-menus-container > p.copyright |
These are opportunities to improve the legibility of your content.
Deprecated APIs will eventually be removed from the browser. Learn more about deprecated APIs.
Performance issues directly impact user engagement and conversion rates.
| Deprecation / Warning | Source |
|---|---|
| AttributionReporting | www.googleadservices.com/pagead/conversion_async.js line 31, col 421 |
These checks ensure that your page is following basic search engine optimization advice. There are many additional factors Lighthouse does not score here that may affect your search ranking, including performance on Core Web Vitals. Learn more about Google Search Essentials.
Descriptive link text helps search engines understand your content. Learn how to make links more accessible.
Performance issues directly impact user engagement and conversion rates.
| Link destination | Link Text |
|---|---|
| www.visme.co/templates/ | More |
| www.visme.co/graph-maker/ | Learn more |
| www.visme.co/templates/ | Learn more |
| www.visme.co/brand-design-tool/ | Learn more |
| www.visme.co/social-media-scheduler/ | Learn more |
| www.visme.co/icon-finder/ | Learn more |
| www.visme.co/animation-interactivity/ | Learn more |
Format your HTML in a way that enables crawlers to better understand your app’s content.
Send Feedback