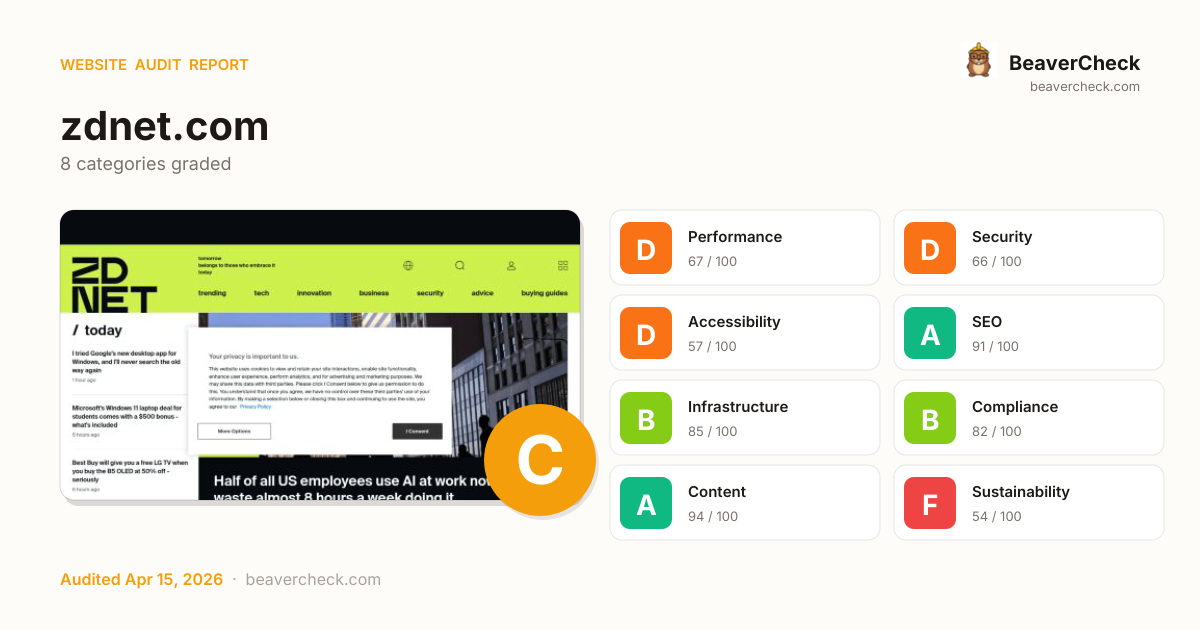
Skip to content
Audit Complete

Results for https://zdnet.com

Visit site
Corporate / Enterprise · estimated Tracking: leads
Brazil Brazil · Sao Paulo Completed: Apr 15, 2026 23:23 UTC
Download JSON Download Markdown Report

Mobile 375 × 812

Screenshot of the audited page (Mobile 375×812)

Desktop 1440 × 900

Screenshot of the audited page (Desktop 1440×900)
C72

Site Health

Score: 72 / 100

Based on 8 categories, 0 sections

Room to improve — your 19.8s load time is above Google's 2.5s 'Good' threshold.

Several missing protections leave your users and data exposed.

Several issues make your site difficult for assistive technology users.

Well-optimized for search — your content is discoverable.

Solid infrastructure — fast server responses across the board.

Mostly compliant — a few items need attention.

Rich content metadata — your pages look great everywhere.

Heavier than average — reducing page weight saves energy and bandwidth.

How is this calculated?

The overall score is a weighted average of individual category scores. Categories with more impact on user experience and security carry more weight.

Performance 25%Security 25%Accessibility 15%SEO 10%Infrastructure 10%Compliance 8%Content 5%Sustainability 2%

Weights reflect general web best practices. Individual needs may differ.

How the composite score is calculated

How you compare

Admiral sites average 73
At average
Better than 25% of Admiral sites See full Admiral benchmark →
Confiant sites average 72
At average
Better than 20% of Confiant sites See full Confiant benchmark →

Top Priorities (5)

1

Content-Security-Policy header is missing

Security gaps expose your site and users to attacks, eroding trust.

Security › Security Headers
2

No Content-Security-Policy header found

Security gaps expose your site and users to attacks, eroding trust.

Security › Content Security Policy
3

Page weighs 22.4 MB (6.5 MB transferred)

Performance issues directly impact user engagement and conversion rates.

Performance › Page Weight Budget
4

1 link(s) with no accessible text

Accessibility issues exclude users with disabilities — up to 15% of your potential audience.

Accessibility › Link & Button Quality
5

4 button(s) with no accessible text

Accessibility issues exclude users with disabilities — up to 15% of your potential audience.

Accessibility › Link & Button Quality
View fix priority matrix

Fix Priority Matrix

5 findings

Quick Wins

2

High impact, low effort — start here.

Strategic

3

High impact, requires investment.

Easy Improvements

0

Small gains, minimal effort.

Nothing in this quadrant — good news.

Deprioritize

0

Low impact, high effort — do last.

Nothing in this quadrant — good news.

← Low effort High effort →
BeaverCheck badge
Embed this badge
[![BeaverCheck](https://beavercheck.com/badge?url=https%3A%2F%2Fzdnet.com)](https://beavercheck.com/results/0f548176-a977-4a51-8779-7ca8529610bf)
<a href="https://beavercheck.com/results/0f548176-a977-4a51-8779-7ca8529610bf"><img src="https://beavercheck.com/badge?url=https%3A%2F%2Fzdnet.com" alt="BeaverCheck Score"></a>
https://beavercheck.com/badge?url=https%3A%2F%2Fzdnet.com

This badge auto-updates with your latest scan result.

What fixing these means

Your site performs reasonably well, but a few targeted fixes could meaningfully improve results. Your LCP of 19.8s exceeds Google's 2.5s 'Good' threshold and the 1 performance issue below directly contributes to it. Accessibility issues exclude users who rely on assistive technology — an estimated 15% of your potential audience. Addressing the critical issues below would have the most immediate impact on your user trust.

2 security gaps detected — browsers may warn visitors about your site.
Your LCP is 19.8s — fixing the 1 performance critical could bring it under Google's 2.5s 'Good' threshold.
2 accessibility issues exclude users who rely on assistive technology.

Conversion Barriers

2 critical 4 warning

6 barrier(s) likely increasing bounce by ~27%.

Speed (2)

Page takes 19.8s to load

+12% bounce

Users abandon at ~3s — you're 17.3s over the 2.5s threshold

Fix: Optimize render-blocking resources, preload the hero image, and compress images

Page feels frozen for 5.7s

+5% bounce

Clicks on the primary CTA are ignored while JavaScript runs

Fix: Break up long tasks; defer non-critical JavaScript to post-hydration

Trust (1)

No Content-Security-Policy header

+1% bounce

Higher XSS blast radius — one compromised script can exfiltrate the checkout form

Fix: Ship a reporting-only CSP first, then enforce once violations are clean

Content (1)

Content is hard to read

+2% bounce

Graduate-level reading difficulty — limits the addressable audience for product or blog pages

Fix: Shorten sentences; replace jargon with plain language; target Flesch ease ≥60

Navigation (2)

No skip-to-content link

+1% bounce

Keyboard and screen-reader users must tab through the entire header on every page

Fix: Add a visible-on-focus <a href="#main">Skip to content</a> as the first focusable element

1 broken link(s) on the page

+2% bounce

Clicks land on 404s — trust drops and the session often ends

Fix: Fix or remove the broken destinations surfaced on the Content tab

Preliminary CRO audit — each barrier links to the tab with detailed analysis.

Return on Investment

€510 investment → €1.52/month returns + EUR 120,500,000 risk avoided

Payback period: > 2 years First-year ROI: -96%

Investment

€510

6h · 5 findings

Monthly returns

€1.52 /mo

~€18 / year

  • Bandwidth savings €1.52

Regulatory risk avoided

EUR 120,500,000

if kept compliant

  • ePrivacy Directive EUR 100,000,000
  • GDPR EUR 20,000,000
  • EAA EUR 500,000

€85 — in quick wins — start here for the fastest payback

Figures combine localized regulatory fine ceilings, search/conversion value priced against local CPC, and bandwidth waste estimates. Results depend on implementation quality and audience composition. Not legal or financial advice.

Full methodology & sources

Estimated Remediation Cost

€510

6.0 developer hours at €85/hr

Based on European Union rates (€85/hr)

Quick wins
€85 2 fixes in ~60 minutes

Start here for the best return on investment

Cost by category

Cost by effort level

Adjust assumptions
/hr

Rates reflect fully-loaded developer cost including overhead

How developer rates are sourced

What Inaction Is Costing You

€10,041,668 / month at risk

~€120,500,018 / year if left unfixed

Compliance Risk

€120,500,000

ePrivacy DirectiveGDPREAA
  • No privacy policy link detected
    GDPR: EUR 10,000 – EUR 20,000,000
  • 7 advertising/retargeting trackers detected
    GDPR: EUR 10,000 – EUR 20,000,000
  • Trackers detected but no cookie policy found
    GDPR: EUR 5,000 – EUR 10,000,000

+6 more

Bandwidth Waste

€1.52 /mo

20512.1 MB/mo × 0.074 EUR/GB

  • Optimize transfer: save ~2.1 MB per page load
    Saves €1.52/mo

Compliance figures represent the statutory maximum fine for the most severe triggered category, capped per regulation — not the sum of per-finding penalties. Based on published regulatory fine ranges. This is not legal advice.

Compliance methodology · SEO assumptions · Bandwidth model

Your performance is already good — improvements may show diminishing returns

Unique monthly visitors from your analytics

Purchases, signups, or key actions

Optional — for revenue estimation

additional conversions/month

more engaged visitors from reduced bounce

potential monthly revenue
Current bounce (est.)
After fixes (est.)
Estimated bounce reduction

Fix 5 critical issues to capture this value

How this is calculated

Based on Google/Deloitte research ("Milliseconds Make Millions") showing a ~7% bounce rate increase per additional second of LCP above the 2.5s "Good" threshold.

Your site's LCP: → estimated after fixes.

These are estimates based on industry research — actual results vary

Bounce-rate model & assumptions

Your data stays in your browser — nothing is sent to our servers

Was this report useful?

Thanks for your feedback!

We'll use a cached audit if available, or offer to scan.

Checking for existing audit...

Lighthouse Scores

Industry-standard audits powered by Google Lighthouse.

26
Performance Overall performance score (0–100) based on Core Web Vitals and other metrics. 90+ is good.
100
Accessibility Measures how accessible the page is for users with disabilities. Checks color contrast, ARIA labels, and semantic HTML.
77
Best Practices Checks for modern web development best practices including HTTPS, no console errors, and secure JavaScript.
100
SEO Measures basic SEO optimizations: meta tags, crawlability, link text, and mobile friendliness.

Core Web Vitals

Key metrics that affect user experience.

First Contentful Paint First Contentful Paint — how long until the browser renders the first piece of content. Under 1.8s is good.

6.04 s

Largest Contentful Paint Largest Contentful Paint — how long until the largest visible element loads. Under 2.5s is good.

19.77 s

Total Blocking Time Total Blocking Time — total time the main thread was blocked, preventing user input. Under 200ms is good.

5.73 s

Cumulative Layout Shift Cumulative Layout Shift — measures visual stability. How much the page layout shifts during loading. Under 0.1 is good.

0.000

Speed Index Speed Index — how quickly content is visually displayed during load. Under 3.4s is good.

12.28 s

Time to Interactive Time to Interactive — how long until the page is fully interactive and responds to user input. Under 3.8s is good.

47.47 s

Detailed Report

Audit breakdown by category with detailed findings.

26

Performance

Insights

Remove large, duplicate JavaScript modules from bundles to reduce unnecessary bytes consumed by network activity.

Why this matters

Performance issues directly impact user engagement and conversion rates.

Polyfills and transforms enable older browsers to use new JavaScript features. However, many aren't necessary for modern browsers. Consider modifying your JavaScript build process to not transpile Baseline features, unless you know you must support older browsers. Learn why most sites can deploy ES6+ code without transpiling

Why this matters

Shipping ES5 transpiled code to modern browsers wastes bytes — every user with an evergreen browser pays for compatibility you don't need.

Learn more

Most users today run browsers that natively support ES6+, async/await, optional chaining, and the rest of modern JavaScript. Transpiling to ES5 'just in case' adds 20-40% to your bundle for no benefit. Configure your build to target a modern browserslist, or ship a differential bundle pair (modern + legacy) with the module/nomodule pattern.

Source: Google web.dev / Lighthouse

3rd party code can significantly impact load performance. Reduce and defer loading of 3rd party code to prioritize your page's content.

Why this matters

Performance issues directly impact user engagement and conversion rates.

A long cache lifetime can speed up repeat visits to your page. Learn more about caching.

Why this matters

Performance issues directly impact user engagement and conversion rates.

RequestCache TTLTransfer Size
cdn.ziffstatic.com/pg/zdnet.prebid.js2682.0 s232.1 KiB
/signals/config/789754228632403?v=2.9.298&r=stable&domain...1200.0 s127.0 KiB
openads-cdn.adsrvr.org/openadsjs/build/v1.0/ziffdavis/openads.js0.0 ms98.4 KiB
cdn.ziffstatic.com/pg/zdnet.js55.0 s86.2 KiB
connect.facebook.net/en_US/fbevents.js1200.0 s96.4 KiB
cdn.static.zdbb.net/js/z0WVjCBSEeGLoxIxOQVEwQ.min.js86400.0 s175.1 KiB
client.aps.amazon-adsystem.com/publisher.js3600.0 s82.4 KiB
/J3UXFee1xclY-bfFlWh1mIZ_phU/gpt_and_prebid/config.js1100.0 s57.9 KiB
pub.doubleverify.com/dvtag/33936767/DV1379166/pub.js900.0 s30.8 KiB
cdn.ziffstatic.com/jst/zdconsent_optin.js773.0 s27.8 KiB
cdn.ziffstatic.com/jst/otBannerSdk.202512.1.0.js600004.0 s126.2 KiB
ml314.com/tag.aspx?15320263600.0 s12.7 KiB
static.chartbeat.com/js/chartbeat.js86400.0 s15.9 KiB
static.chartbeat.com/js/chartbeat_mab.js86400.0 s10.1 KiB
assets.bounceexchange.com/cache/8310/website-09af3c966364268622c11b8cc09fd20a.js120.0 s4.0 KiB
/SIE/?Q_ZID=ZN_bfKEXqBR8EloLWK&Q_LOC=https%3A%2F%2Fwww.zd...3600.0 s4.6 KiB
/dxjsmodule/12.1a2b7192fd54e87d3971.chunk.js?Q_CLIENTVERS...604800.0 s35.9 KiB
tag.wknd.ai/8310/i.js60.0 s3.3 KiB
/logos/f73513a8-7a10-4a9d-939a-703f8d994839/68ba5107-2631...86400.0 s6.3 KiB
/1479487/trc/3/json?tim=1776295350373&data=%7B%22id%22%3A...0.0 ms2.3 KiB
config.aps.amazon-adsystem.com/configs/31583600.0 s2.8 KiB
/w37htfhcq2/vendor/ba40392e-53a4-46b9-9b6c-8bd62e52bb5b/l...60.0 s2.1 KiB
/dxjsmodule/37.7ea1ffe71ad8c0799cc1.chunk.js?Q_CLIENTVERS...604800.0 s18.6 KiB
/a4flkt7l2b/z9gd/ba40392e-53a4-46b9-9b6c-8bd62e52bb5b/www...0.0 ms1.1 KiB
/state/js?website_id=8310&device_id=612169968478683710&vi...0.0 ms1.0 KiB
cdn.ziffstatic.com/pg/zdnet.css2682.0 s981 B
/pixel?c=bd8618c307ae9885a12561b7191e2cea&cid=96947025159...0.0 ms616 B
lis.zdnet.com/baker?dtstmp=17762953503490.0 ms537 B
in.ml314.com/ud.ashx?topiclimit=&cb=1532026&v=2.8.2.2570.0 ms482 B
/w37htfhcq2/z9g/digibox.gif?c=1776295350641&h=www.zdnet.c...0.0 ms451 B
/usersync/liveintent/?cb=%2F%2Fi.liadm.com%2Fs%2F35004%3F...0.0 ms405 B
ps.eyeota.net/pixel/bounce/?pid=r8hrb20&t=gif0.0 ms354 B
match.adsrvr.org/track/cmb/generic?ttd_pid=d0tro1j&ttd_tpi=10.0 ms254 B
/track/cmb/generic?ttd_pid=liveintent&ttd_tpi=1&gdpr=0&us...0.0 ms254 B
cdn.ziffstatic.com/ajs?zoneid=a3600.0 s298 B
ml314.com/csync.ashx?fp=1473582782012935840&person_id=3660420492952600679&eid=286384.0 s56 B

Your first network request is the most important. Reduce its latency by avoiding redirects, ensuring a fast server response, and enabling text compression.

Why this matters

Performance issues directly impact user engagement and conversion rates.

A forced reflow occurs when JavaScript queries geometric properties (such as offsetWidth) after styles have been invalidated by a change to the DOM state. This can result in poor performance. Learn more about forced reflows and possible mitigations.

Why this matters

Performance issues directly impact user engagement and conversion rates.

headings: [map[key:source label:Top function call valueType:source-location] map[granularity:1 key:reflowTime label:Total reflow time valueType:ms]]
items: [map[reflowTime:47.289 source:map[column:111 line:153 type:source-location url:https://cdn.ziffstatic.com/pg/zdnet.js urlProvider:network]]]
headings: [map[key:source label:Source valueType:source-location] map[granularity:1 key:reflowTime label:Total reflow time valueType:ms]]
items: [map[reflowTime:19.627 source:map[type:text value:[unattributed]]] map[reflowTime:49.991 source:map[column:104 line:160 type:source-location url:https://cdn.ziffstatic.com/pg/zdnet.js urlProvider:network]] map[reflowTime:2.228 source:map[column:447 line:107 type:source-location url:https://cdn.ziffstatic.com/jst/zdconsent.js urlProvider:network]] map[reflowTime:1.741 source:map[column:249951 line:1 type:source-location url:https://www.zdnet.com/a/neutron/a9b03a097529.modern.js urlProvider:network]] map[reflowTime:13.469 source:map[column:256906 line:0 type:source-location url:https://www.zdnet.com/a/neutron/b92267d72792.modern.js urlProvider:network]] map[reflowTime:7.721 source:map[column:142934 line:0 type:source-location url:https://www.zdnet.com/a/neutron/b92267d72792.modern.js urlProvider:network]]]

Each subpart has specific improvement strategies. Ideally, most of the LCP time should be spent on loading the resources, not within delays.

Why this matters

Performance issues directly impact user engagement and conversion rates.

headings: [map[key:label label:Subpart valueType:text] map[key:duration label:Duration valueType:ms]]
items: [map[duration:736.52 label:Time to first byte subpart:timeToFirstByte] map[duration:1519.034 label:Resource load delay subpart:resourceLoadDelay] map[duration:125.349 label:Resource load duration subpart:resourceLoadDuration] map[duration:188.67 label:Element render delay subpart:elementRenderDelay]]
lhId: page-0-IMG
nodeLabel: rising tide
path: 1,HTML,1,BODY,0,DIV,1,DIV,0,DIV,6,DIV,1,MAIN,0,DIV,0,DIV,0,DIV,0,DIV,0,DIV,1,DIV,1,DIV,0,A,0,DIV,0,PICTURE,3,IMG
selector: a.c-featureDeepDive_itemLink > div.c-featureDeepDive_mainImage > picture.c-cmsImage > img
snippet: <img src="https://www.zdnet.com/a/img/resize/c11eba0248e9ec2af18e563ef781fffe16f5b80…" alt="rising tide" width="1449" height="814.5" fetchpriority="low">

Optimize LCP by making the LCP image discoverable from the HTML immediately, and avoiding lazy-loading

Why this matters

Performance issues directly impact user engagement and conversion rates.

lhId: page-0-IMG
nodeLabel: rising tide
path: 1,HTML,1,BODY,0,DIV,1,DIV,0,DIV,6,DIV,1,MAIN,0,DIV,0,DIV,0,DIV,0,DIV,0,DIV,1,DIV,1,DIV,0,A,0,DIV,0,PICTURE,3,IMG
selector: a.c-featureDeepDive_itemLink > div.c-featureDeepDive_mainImage > picture.c-cmsImage > img
snippet: <img src="https://www.zdnet.com/a/img/resize/c11eba0248e9ec2af18e563ef781fffe16f5b80…" alt="rising tide" width="1449" height="814.5" fetchpriority="low">

Avoid chaining critical requests by reducing the length of chains, reducing the download size of resources, or deferring the download of unnecessary resources to improve page load.

Why this matters

Performance issues directly impact user engagement and conversion rates.

description: [preconnect](https://developer.chrome.com/docs/lighthouse/performance/uses-rel-preconnect/) hints help the browser establish a connection earlier in the page load, saving time when the first request for that origin is made. The following are the origins that the page preconnected to.
title: Preconnected origins
description: Add [preconnect](https://developer.chrome.com/docs/lighthouse/performance/uses-rel-preconnect/) hints to your most important origins, but try to use no more than 4.
title: Preconnect candidates

Reducing the download time of images can improve the perceived load time of the page and LCP. Learn more about optimizing image size

Why this matters

Performance issues directly impact user engagement and conversion rates.

URLResource SizeEst Savings
gettyimages-2248374027-1 a.c-featureFeaturedStory_link > div.c-featureFeaturedStory_mainImage > picture.c-cmsImage > img
/a/img/resize/7a568e218f9d67e691b3dc1f1360922715c8c928/20...131.7 KiB99.1 KiB
rising tide a.c-featureDeepDive_itemLink > div.c-featureDeepDive_mainImage > picture.c-cmsImage > img
/a/img/resize/c11eba0248e9ec2af18e563ef781fffe16f5b807/20...126.8 KiB44.8 KiB

Requests are blocking the page's initial render, which may delay LCP. Deferring or inlining can move these network requests out of the critical path.

Why this matters

Performance issues directly impact user engagement and conversion rates.

URLTransfer SizeDuration
cdn.ziffstatic.com/pg/zdnet.css981 B755 ms

These insights are also available in the Chrome DevTools Performance Panel - record a trace to view more detailed information.

Time to Interactive is the amount of time it takes for the page to become fully interactive. Learn more about the Time to Interactive metric.

Why this matters

Performance issues directly impact user engagement and conversion rates.

TTI

The maximum potential First Input Delay that your users could experience is the duration of the longest task. Learn more about the Maximum Potential First Input Delay metric.

Why this matters

Performance issues directly impact user engagement and conversion rates.

Redirects introduce additional delays before the page can be loaded. Learn how to avoid page redirects.

Why this matters

Performance issues directly impact user engagement and conversion rates.

Estimated savings: 1.1 s
URLTime Spent
zdnet.com/1.1 s
www.zdnet.com/0.0 ms

Diagnostics

Reduce unused JavaScript and defer loading scripts until they are required to decrease bytes consumed by network activity. Learn how to reduce unused JavaScript.

Why this matters

Multi-megabyte JavaScript bundles delay every interactive feature on the page.

Learn more

This is the Lighthouse audit fired when too much JS is shipped relative to what executes. The fix isn't a config flag — it requires bundle analysis (webpack-bundle-analyzer, rollup-plugin-visualizer), splitting routes into chunks, lazy-loading off-screen components, and removing unused dependencies. Fundamentally different from minification: minifying reduces byte count, this reduces what's downloaded at all.

Source: Google web.dev / Lighthouse

Estimated savings: 5.2 s 2.4 MiB
URLTransfer SizeEst Savings
/_/mss/boq-cloud-ai-ucs/_/js/k=boq-cloud-ai-ucs.UcsWidget...2.2 MiB714.2 KiB
www.zdnet.com/a/neutron/2febdb49c6ca.modern.js460.9 KiB263.2 KiB
cdn.ziffstatic.com/pg/zdnet.prebid.js231.9 KiB161.7 KiB
/pagead/managed/js/gpt/m202604100101/pubads_impl.js186.4 KiB130.0 KiB
www.googletagmanager.com/gtag/js?id=G-1Q25KQB2WE159.9 KiB110.6 KiB
www.googletagmanager.com/gtag/js?id=G-1Q25KQB2WE&cx=c&gtm=4e64e1h1&bs=ctrl159.9 KiB110.5 KiB
cdn.confiant-integrations.net/gptprebidnative/202603241056/wrap.js141.5 KiB84.6 KiB
cdn.ziffstatic.com/jst/otBannerSdk.202512.1.0.js126.2 KiB75.6 KiB
/assets/smart-tag/versioned/main-v2_a8ec0b4e51efd1e1ddbdf...116.2 KiB71.2 KiB
www.zdnet.com/a/neutron/b92267d72792.modern.js240.6 KiB69.7 KiB
/w37htfhcq2/vendor/ba40392e-53a4-46b9-9b6c-8bd62e52bb5b/m...116.2 KiB68.7 KiB
cdn.ziffstatic.com/pg/zdnet.js86.0 KiB68.0 KiB
www.googletagmanager.com/gtm.js?id=GTM-KDH2N5HJ111.1 KiB67.0 KiB
/gtag/destination?id=G-1Q25KQB2WE&cx=c&gtm=4e64e1h1&bs=ctrl159.9 KiB65.1 KiB
openads-cdn.adsrvr.org/openadsjs/build/v1.0/ziffdavis/openads.js98.0 KiB61.7 KiB
/signals/config/789754228632403?v=2.9.298&r=stable&domain...126.8 KiB48.6 KiB
www.zdnet.com/a/neutron/a9b03a097529.modern.js105.7 KiB48.6 KiB
client.aps.amazon-adsystem.com/publisher.js82.0 KiB45.7 KiB
connect.facebook.net/en_US/fbevents.js96.3 KiB43.0 KiB
cdn.static.zdbb.net/js/z0WVjCBSEeGLoxIxOQVEwQ.min.js174.7 KiB41.2 KiB
www.zdnet.com/a/neutron/59897d9a5a29.modern.js70.7 KiB31.6 KiB
www.zdnet.com/a/neutron/2b4cf0b756ec.modern.js57.5 KiB28.0 KiB
/dxjsmodule/12.1a2b7192fd54e87d3971.chunk.js?Q_CLIENTVERS...35.7 KiB27.4 KiB
assets.bounceexchange.com/assets/bounce/jquery-3.7.1.min.js30.3 KiB20.9 KiB

Consider reducing the time spent parsing, compiling, and executing JS. You may find delivering smaller JS payloads helps with this. Learn how to reduce Javascript execution time.

Why this matters

Performance issues directly impact user engagement and conversion rates.

URLTotal CPU TimeScript EvaluationScript Parse
www.zdnet.com/a/neutron/a9b03a097529.modern.js3.1 s2.4 s2.6 ms
www.zdnet.com/2.1 s180 ms358 ms
/_/mss/boq-cloud-ai-ucs/_/js/k=boq-cloud-ai-ucs.UcsWidget...2.0 s908 ms1.1 s
Unattributable1.8 s333 ms0.0 ms
cdn.ziffstatic.com/pg/zdnet.js604 ms261 ms61 ms
cdn.ziffstatic.com/jst/otBannerSdk.202512.1.0.js570 ms455 ms63 ms
/assets/smart-tag/versioned/main-v2_a8ec0b4e51efd1e1ddbdf...538 ms340 ms75 ms
cdn.confiant-integrations.net/gptprebidnative/202603241056/wrap.js537 ms483 ms50 ms
/pagead/managed/js/gpt/m202604100101/pubads_impl.js488 ms403 ms77 ms
/gtag/destination?id=G-1Q25KQB2WE&cx=c&gtm=4e64e1h1&bs=ctrl420 ms351 ms65 ms
client.aps.amazon-adsystem.com/publisher.js354 ms292 ms47 ms
skullmagnets.com/public/js/7c30141/c0_f76c0a89e968f71ca4bb062649d.bundle.js318 ms191 ms14 ms
cdn.ziffstatic.com/pg/zdnet.prebid.js304 ms199 ms94 ms
/signals/config/789754228632403?v=2.9.298&r=stable&domain...287 ms233 ms53 ms
www.zdnet.com/a/neutron/59897d9a5a29.modern.js239 ms192 ms46 ms
openads-cdn.adsrvr.org/openadsjs/build/v1.0/ziffdavis/openads.js211 ms172 ms38 ms
/a4flkt7l2b/z9gd/ba40392e-53a4-46b9-9b6c-8bd62e52bb5b/www...204 ms196 ms0.5 ms
cdn.static.zdbb.net/js/z0WVjCBSEeGLoxIxOQVEwQ.min.js201 ms112 ms23 ms
/w37htfhcq2/vendor/ba40392e-53a4-46b9-9b6c-8bd62e52bb5b/m...193 ms110 ms56 ms
www.zdnet.com/a/neutron/b92267d72792.modern.js190 ms67 ms7.9 ms
connect.facebook.net/en_US/fbevents.js180 ms132 ms47 ms
/assets/smart-tag/versioned/cjs_min_92abedfd1b9757a428bfc...179 ms149 ms6.5 ms
pub.doubleverify.com/dvtag/33936767/DV1379166/pub.js140 ms111 ms14 ms
www.googletagmanager.com/gtm.js?id=GTM-KDH2N5HJ135 ms94 ms40 ms
cdn.taboola.com/libtrc/unip/1479487/tfa.js119 ms97 ms12 ms
securepubads.g.doubleclick.net/tag/js/gpt.js116 ms100 ms14 ms
cdn.ziffstatic.com/jst/zdconsent.js108 ms81 ms12 ms
static.chartbeat.com/js/chartbeat.js101 ms92 ms6.0 ms
/assets/smart-tag/versioned/onsite-v2_1238d00d70e4de87443...94 ms82 ms2.8 ms
www.googletagmanager.com/gtag/js?id=G-1Q25KQB2WE93 ms32 ms61 ms
www.googletagmanager.com/gtag/js?id=G-1Q25KQB2WE&cx=c&gtm=4e64e1h1&bs=ctrl93 ms31 ms62 ms
static.chartbeat.com/js/chartbeat_mab.js88 ms79 ms3.4 ms
/dxjsmodule/37.7ea1ffe71ad8c0799cc1.chunk.js?Q_CLIENTVERS...78 ms70 ms6.9 ms
/J3UXFee1xclY-bfFlWh1mIZ_phU/gpt_and_prebid/config.js71 ms29 ms39 ms
/state/js?website_id=8310&device_id=612169968478683710&vi...67 ms65 ms0.5 ms
/w37htfhcq2/vendor/ba40392e-53a4-46b9-9b6c-8bd62e52bb5b/l...52 ms48 ms0.6 ms

Consider reducing the time spent parsing, compiling and executing JS. You may find delivering smaller JS payloads helps with this. Learn how to minimize main-thread work

Why this matters

Performance issues directly impact user engagement and conversion rates.

CategoryTime Spent
Script Evaluation9.5 s
Script Parsing & Compilation2.6 s
Other2.3 s
Parse HTML & CSS914 ms
Style & Layout824 ms
Garbage Collection479 ms
Rendering126 ms

Reduce unused rules from stylesheets and defer CSS not used for above-the-fold content to decrease bytes consumed by network activity. Learn how to reduce unused CSS.

Why this matters

Performance issues directly impact user engagement and conversion rates.

Estimated savings: 0.0 ms 25.3 KiB

More information about the performance of your application. These numbers don't directly affect the Performance score.

Layout shift culprits
Optimize DOM size
Font display
Modern HTTP
Optimize viewport for mobile
Minify CSS
Minify JavaScript
User Timing marks and measures 23 user timings
Avoid long main-thread tasks 20 long tasks found
Avoid non-composited animations 1 animated element found
Image elements have explicit `width` and `height`
Page didn't prevent back/forward cache restoration
Network Requests
Network Round Trip Times 210 ms
Server Backend Latencies 810 ms
Tasks
Diagnostics
Metrics
Screenshot Thumbnails
Final Screenshot
Script Treemap Data
Resources Summary
Initial server response time was short Root document took 290 ms
INP breakdown
Avoid large layout shifts
100

Accessibility

These checks highlight opportunities to improve the accessibility of your web app. Automatic detection can only detect a subset of issues and does not guarantee the accessibility of your web app, so manual testing is also encouraged.

Visible text labels that do not match the accessible name can result in a confusing experience for screen reader users. Learn more about accessible names.

Why this matters

Performance issues directly impact user engagement and conversion rates.

Failing Elements
artificial intelligence Half of all US employees use AI at work now - and waste… div.u-grid-columns > div.c-pageHome_body > div.c-featureFeaturedStory > a.c-featureFeaturedStory_link
windows Microsoft's latest Windows update now confirms if your PC is Secure Boo… div.u-grid-columns > div.c-pageHome_body > div.c-featureFeaturedStory > a.c-featureFeaturedStory_link
linux Can this $70 Linux app make up for the lack of Photoshop? I tried it to f… div.u-grid-columns > div.c-pageHome_body > div.c-featureFeaturedStory > a.c-featureFeaturedStory_link
Privacy Policy div#onetrust-group-container > div#onetrust-policy > div#onetrust-policy-text > a.ot-cookie-policy-link
Interactive controls are keyboard focusable
Interactive elements indicate their purpose and state
The page has a logical tab order
Visual order on the page follows DOM order
User focus is not accidentally trapped in a region
The user's focus is directed to new content added to the page
HTML5 landmark elements are used to improve navigation
Offscreen content is hidden from assistive technology
Custom controls have associated labels
Custom controls have ARIA roles
`[aria-*]` attributes match their roles
`[aria-hidden="true"]` is not present on the document `<body>`
`[role]`s have all required `[aria-*]` attributes
`[role]` values are valid
`[aria-*]` attributes have valid values
`[aria-*]` attributes are valid and not misspelled
Buttons have an accessible name
Image elements have `[alt]` attributes
`[user-scalable="no"]` is not used in the `<meta name="viewport">` element and the `[maximum-scale]` attribute is not less than 5.
`button`, `link`, and `menuitem` elements have accessible names
ARIA attributes are used as specified for the element's role
Elements with `role="dialog"` or `role="alertdialog"` have accessible names.
`[aria-hidden="true"]` elements do not contain focusable descendents
Elements use only permitted ARIA attributes
Background and foreground colors have a sufficient contrast ratio
Document has a `<title>` element
`<frame>` or `<iframe>` elements have a title
`<html>` element has a `[lang]` attribute
`<html>` element has a valid value for its `[lang]` attribute
Links are distinguishable without relying on color.
Links have a discernible name
Lists contain only `<li>` elements and script supporting elements (`<script>` and `<template>`).
List items (`<li>`) are contained within `<ul>`, `<ol>` or `<menu>` parent elements
No element has a `[tabindex]` value greater than 0
Touch targets have sufficient size and spacing.
Heading elements appear in a sequentially-descending order
Document has a main landmark.
Deprecated ARIA roles were not used
`[accesskey]` values are unique
ARIA input fields have accessible names
ARIA `meter` elements have accessible names
ARIA `progressbar` elements have accessible names
Elements with an ARIA `[role]` that require children to contain a specific `[role]` have all required children.
`[role]`s are contained by their required parent element
Elements with the `role=text` attribute do not have focusable descendents.
ARIA toggle fields have accessible names
ARIA `tooltip` elements have accessible names
ARIA `treeitem` elements have accessible names
The page contains a heading, skip link, or landmark region
`<dl>`'s contain only properly-ordered `<dt>` and `<dd>` groups, `<script>`, `<template>` or `<div>` elements.
Definition list items are wrapped in `<dl>` elements
ARIA IDs are unique
No form fields have multiple labels
`<html>` element has an `[xml:lang]` attribute with the same base language as the `[lang]` attribute.
Input buttons have discernible text.
`<input type="image">` elements have `[alt]` text
Form elements have associated labels
The document does not use `<meta http-equiv="refresh">`
`<object>` elements have alternate text
Select elements have associated label elements.
Skip links are focusable.
Cells in a `<table>` element that use the `[headers]` attribute refer to table cells within the same table.
`<th>` elements and elements with `[role="columnheader"/"rowheader"]` have data cells they describe.
`[lang]` attributes have a valid value
`<video>` elements contain a `<track>` element with `[kind="captions"]`
Tables have different content in the summary attribute and `<caption>`.
All heading elements contain content.
Uses ARIA roles only on compatible elements
Image elements do not have `[alt]` attributes that are redundant text.
Identical links have the same purpose.
Tables use `<caption>` instead of cells with the `[colspan]` attribute to indicate a caption.
`<td>` elements in a large `<table>` have one or more table headers.
77

Best Practices

General

Deprecated APIs will eventually be removed from the browser. Learn more about deprecated APIs.

Why this matters

Performance issues directly impact user engagement and conversion rates.

Deprecation / WarningSource
AttributionReporting

Errors logged to the console indicate unresolved problems. They can come from network request failures and other browser concerns. Learn more about this errors in console diagnostic audit

Why this matters

Performance issues directly impact user engagement and conversion rates.

SourceDescription
Failed to load resource: the server responded with a status of 451 ()

Source maps translate minified code to the original source code. This helps developers debug in production. In addition, Lighthouse is able to provide further insights. Consider deploying source maps to take advantage of these benefits. Learn more about source maps.

Why this matters

Performance issues directly impact user engagement and conversion rates.

Uses HTTPS
Avoids third-party cookies
Allows users to paste into input fields
Avoids requesting the geolocation permission on page load
Avoids requesting the notification permission on page load
Displays images with correct aspect ratio
Serves images with appropriate resolution
Page has the HTML doctype
Properly defines charset
No issues in the `Issues` panel in Chrome Devtools
Ensure CSP is effective against XSS attacks
Ensure proper origin isolation with COOP
Mitigate DOM-based XSS with Trusted Types
Detected JavaScript libraries
Redirects HTTP traffic to HTTPS
Use a strong HSTS policy
Mitigate clickjacking with XFO or CSP
100

SEO

These checks ensure that your page is following basic search engine optimization advice. There are many additional factors Lighthouse does not score here that may affect your search ranking, including performance on Core Web Vitals. Learn more about Google Search Essentials.

Structured data is valid
Page isn’t blocked from indexing
Document has a `<title>` element
Document has a meta description
Page has successful HTTP status code
Links have descriptive text
Links are crawlable
robots.txt is valid
Image elements have `[alt]` attributes
Document has a valid `hreflang`
Document has a valid `rel=canonical`

Lighthouse Scores

Industry-standard audits powered by Google Lighthouse. — Desktop

44
Performance Overall performance score (0–100) based on Core Web Vitals and other metrics. 90+ is good.
100
Accessibility Measures how accessible the page is for users with disabilities. Checks color contrast, ARIA labels, and semantic HTML.
77
Best Practices Checks for modern web development best practices including HTTPS, no console errors, and secure JavaScript.
100
SEO Measures basic SEO optimizations: meta tags, crawlability, link text, and mobile friendliness.

Core Web Vitals

Key metrics that affect user experience. — Desktop

First Contentful Paint First Contentful Paint — how long until the browser renders the first piece of content. Under 1.8s is good.

1.77 s

Largest Contentful Paint Largest Contentful Paint — how long until the largest visible element loads. Under 2.5s is good.

2.70 s

Total Blocking Time Total Blocking Time — total time the main thread was blocked, preventing user input. Under 200ms is good.

801 ms

Cumulative Layout Shift Cumulative Layout Shift — measures visual stability. How much the page layout shifts during loading. Under 0.1 is good.

0.000

Speed Index Speed Index — how quickly content is visually displayed during load. Under 3.4s is good.

3.66 s

Time to Interactive Time to Interactive — how long until the page is fully interactive and responds to user input. Under 3.8s is good.

11.25 s

Detailed Report

Audit breakdown by category with detailed findings.

44

Performance

Insights

Remove large, duplicate JavaScript modules from bundles to reduce unnecessary bytes consumed by network activity.

Why this matters

Performance issues directly impact user engagement and conversion rates.

Polyfills and transforms enable older browsers to use new JavaScript features. However, many aren't necessary for modern browsers. Consider modifying your JavaScript build process to not transpile Baseline features, unless you know you must support older browsers. Learn why most sites can deploy ES6+ code without transpiling

Why this matters

Shipping ES5 transpiled code to modern browsers wastes bytes — every user with an evergreen browser pays for compatibility you don't need.

Learn more

Most users today run browsers that natively support ES6+, async/await, optional chaining, and the rest of modern JavaScript. Transpiling to ES5 'just in case' adds 20-40% to your bundle for no benefit. Configure your build to target a modern browserslist, or ship a differential bundle pair (modern + legacy) with the module/nomodule pattern.

Source: Google web.dev / Lighthouse

3rd party code can significantly impact load performance. Reduce and defer loading of 3rd party code to prioritize your page's content.

Why this matters

Performance issues directly impact user engagement and conversion rates.

A long cache lifetime can speed up repeat visits to your page. Learn more about caching.

Why this matters

Performance issues directly impact user engagement and conversion rates.

RequestCache TTLTransfer Size
cdn.ziffstatic.com/pg/zdnet.prebid.js2650.0 s232.1 KiB
/signals/config/789754228632403?v=2.9.298&r=stable&domain...1200.0 s127.0 KiB
openads-cdn.adsrvr.org/openadsjs/build/v1.0/ziffdavis/openads.js0.0 ms98.4 KiB
cdn.ziffstatic.com/pg/zdnet.js23.0 s86.2 KiB
connect.facebook.net/en_US/fbevents.js1200.0 s96.4 KiB
cdn.static.zdbb.net/js/z0WVjCBSEeGLoxIxOQVEwQ.min.js86400.0 s175.1 KiB
pagead2.googlesyndication.com/pagead/js/lidar.js?fcd=true3600.0 s83.1 KiB
client.aps.amazon-adsystem.com/publisher.js3600.0 s82.3 KiB
/pagead/managed/js/activeview/current/ufs_web_display.js3600.0 s73.1 KiB
/J3UXFee1xclY-bfFlWh1mIZ_phU/gpt_and_prebid/config.js1100.0 s57.9 KiB
pub.doubleverify.com/dvtag/33936767/DV1379166/pub.js900.0 s30.8 KiB
cdn.ziffstatic.com/jst/zdconsent_optin.js209.0 s27.8 KiB
cdn.ziffstatic.com/jst/otBannerSdk.202512.1.0.js599972.0 s126.2 KiB
ml314.com/tag.aspx?15320263600.0 s12.7 KiB
static.chartbeat.com/js/chartbeat.js86400.0 s15.9 KiB
pub.dv.tech/display-omnitag/33936767/DV1583346/pub.js900.0 s6.0 KiB
static.chartbeat.com/js/chartbeat_mab.js86400.0 s10.1 KiB
assets.bounceexchange.com/cache/8310/website-09af3c966364268622c11b8cc09fd20a.js120.0 s4.0 KiB
/SIE/?Q_ZID=ZN_bfKEXqBR8EloLWK&Q_LOC=https%3A%2F%2Fwww.zd...3600.0 s4.6 KiB
/dxjsmodule/12.1a2b7192fd54e87d3971.chunk.js?Q_CLIENTVERS...604800.0 s35.8 KiB
/dvtp_src.js900.0 s3.8 KiB
tag.wknd.ai/8310/i.js60.0 s3.3 KiB
/logos/f73513a8-7a10-4a9d-939a-703f8d994839/68ba5107-2631...86400.0 s6.3 KiB
/1479487/trc/3/json?tim=1776295382873&data=%7B%22id%22%3A...0.0 ms2.3 KiB
config.aps.amazon-adsystem.com/configs/31583600.0 s2.8 KiB
/w37htfhcq2/vendor/ba40392e-53a4-46b9-9b6c-8bd62e52bb5b/l...60.0 s2.1 KiB
/dxjsmodule/37.7ea1ffe71ad8c0799cc1.chunk.js?Q_CLIENTVERS...604800.0 s18.7 KiB
/state/js?website_id=8310&device_id=368582910307325922&vi...0.0 ms1.0 KiB
/a4flkt7l2b/z9gd/ba40392e-53a4-46b9-9b6c-8bd62e52bb5b/www...0.0 ms934 B
cdn.ziffstatic.com/pg/zdnet.css2650.0 s981 B
/pixel?c=bd8618c307ae9885a12561b7191e2cea&cid=96862582541...0.0 ms616 B
lis.zdnet.com/baker?dtstmp=17762953824800.0 ms538 B
cdn.ziffstatic.com/ajs?zoneid=a3600.0 s660 B
in.ml314.com/ud.ashx?topiclimit=&cb=1532026&v=2.8.2.2570.0 ms482 B
/w37htfhcq2/z9g/digibox.gif?c=1776295382518&h=www.zdnet.c...0.0 ms450 B
/usersync/liveintent/?cb=%2F%2Fi.liadm.com%2Fs%2F35004%3F...0.0 ms405 B
ps.eyeota.net/pixel/bounce/?pid=r8hrb20&t=gif0.0 ms354 B
/track/cmb/generic?ttd_pid=liveintent&ttd_tpi=1&gdpr=0&us...0.0 ms254 B
match.adsrvr.org/track/cmb/generic?ttd_pid=d0tro1j&ttd_tpi=10.0 ms254 B
ml314.com/csync.ashx?fp=1133576927475162785&person_id=3660420501943615518&eid=286383.0 s56 B

Your first network request is the most important. Reduce its latency by avoiding redirects, ensuring a fast server response, and enabling text compression.

Why this matters

Performance issues directly impact user engagement and conversion rates.

Optimize LCP by making the LCP image discoverable from the HTML immediately, and avoiding lazy-loading

Why this matters

Performance issues directly impact user engagement and conversion rates.

lhId: page-0-IMG
nodeLabel: gettyimages-2248374027-1
path: 1,HTML,1,BODY,0,DIV,1,DIV,0,DIV,6,DIV,1,MAIN,0,DIV,0,DIV,0,DIV,0,DIV,0,DIV,1,DIV,0,DIV,0,A,0,DIV,0,PICTURE,0,IMG
selector: a.c-featureFeaturedStory_link > div.c-featureFeaturedStory_mainImage > picture.c-cmsImage > img
snippet: <img src="https://www.zdnet.com/a/img/resize/7a568e218f9d67e691b3dc1f1360922715c8c92…" alt="gettyimages-2248374027-1" width="1449" height="814.5" fetchpriority="high">

Avoid chaining critical requests by reducing the length of chains, reducing the download size of resources, or deferring the download of unnecessary resources to improve page load.

Why this matters

Performance issues directly impact user engagement and conversion rates.

description: [preconnect](https://developer.chrome.com/docs/lighthouse/performance/uses-rel-preconnect/) hints help the browser establish a connection earlier in the page load, saving time when the first request for that origin is made. The following are the origins that the page preconnected to.
title: Preconnected origins
description: Add [preconnect](https://developer.chrome.com/docs/lighthouse/performance/uses-rel-preconnect/) hints to your most important origins, but try to use no more than 4.
title: Preconnect candidates
value: No additional origins are good candidates for preconnecting

Reducing the download time of images can improve the perceived load time of the page and LCP. Learn more about optimizing image size

Why this matters

Performance issues directly impact user engagement and conversion rates.

URLResource SizeEst Savings
rising tide a.c-featureDeepDive_itemLink > div.c-featureDeepDive_mainImage > picture.c-cmsImage > img
/a/img/resize/9ab1154cbedde1728c9ac40468296852db82a394/20...159.7 KiB88.3 KiB
gettyimages-2248374027-1 a.c-featureFeaturedStory_link > div.c-featureFeaturedStory_mainImage > picture.c-cmsImage > img
/a/img/resize/7a568e218f9d67e691b3dc1f1360922715c8c928/20...131.7 KiB74.1 KiB

Requests are blocking the page's initial render, which may delay LCP. Deferring or inlining can move these network requests out of the critical path.

Why this matters

Performance issues directly impact user engagement and conversion rates.

URLTransfer SizeDuration
cdn.ziffstatic.com/pg/zdnet.css981 B203 ms

These insights are also available in the Chrome DevTools Performance Panel - record a trace to view more detailed information.

Redirects introduce additional delays before the page can be loaded. Learn how to avoid page redirects.

Why this matters

Performance issues directly impact user engagement and conversion rates.

Estimated savings: 527 ms
URLTime Spent
zdnet.com/527 ms
www.zdnet.com/0.0 ms

Time to Interactive is the amount of time it takes for the page to become fully interactive. Learn more about the Time to Interactive metric.

Why this matters

Performance issues directly impact user engagement and conversion rates.

TTI

The maximum potential First Input Delay that your users could experience is the duration of the longest task. Learn more about the Maximum Potential First Input Delay metric.

Why this matters

Performance issues directly impact user engagement and conversion rates.

Diagnostics

Reduce unused JavaScript and defer loading scripts until they are required to decrease bytes consumed by network activity. Learn how to reduce unused JavaScript.

Why this matters

Multi-megabyte JavaScript bundles delay every interactive feature on the page.

Learn more

This is the Lighthouse audit fired when too much JS is shipped relative to what executes. The fix isn't a config flag — it requires bundle analysis (webpack-bundle-analyzer, rollup-plugin-visualizer), splitting routes into chunks, lazy-loading off-screen components, and removing unused dependencies. Fundamentally different from minification: minifying reduces byte count, this reduces what's downloaded at all.

Source: Google web.dev / Lighthouse

Estimated savings: 490 ms 2.5 MiB
URLTransfer SizeEst Savings
/_/mss/boq-cloud-ai-ucs/_/js/k=boq-cloud-ai-ucs.UcsWidget...2.2 MiB714.2 KiB
www.zdnet.com/a/neutron/2febdb49c6ca.modern.js460.9 KiB263.2 KiB
cdn.ziffstatic.com/pg/zdnet.prebid.js231.9 KiB160.2 KiB
www.googletagmanager.com/gtag/js?id=G-1Q25KQB2WE159.9 KiB110.5 KiB
www.googletagmanager.com/gtag/js?id=G-1Q25KQB2WE&cx=c&gtm=4e64e1159.9 KiB110.5 KiB
/pagead/managed/js/gpt/m202604100101/pubads_impl.js186.4 KiB89.4 KiB
cdn.ziffstatic.com/jst/otBannerSdk.202512.1.0.js126.2 KiB75.6 KiB
cdn.confiant-integrations.net/gptprebidnative/202603241056/wrap.js141.5 KiB72.1 KiB
/assets/smart-tag/versioned/main-v2_a8ec0b4e51efd1e1ddbdf...116.2 KiB71.2 KiB
www.zdnet.com/a/neutron/b92267d72792.modern.js240.6 KiB69.3 KiB
/w37htfhcq2/vendor/ba40392e-53a4-46b9-9b6c-8bd62e52bb5b/m...116.2 KiB68.7 KiB
cdn.ziffstatic.com/pg/zdnet.js86.0 KiB67.2 KiB
www.googletagmanager.com/gtm.js?id=GTM-KDH2N5HJ111.1 KiB67.0 KiB
www.googletagmanager.com/gtag/destination?id=G-1Q25KQB2WE&cx=c&gtm=4e64e1159.9 KiB65.1 KiB
pagead2.googlesyndication.com/pagead/js/lidar.js?fcd=true83.1 KiB64.9 KiB
openads-cdn.adsrvr.org/openadsjs/build/v1.0/ziffdavis/openads.js98.0 KiB61.7 KiB
/signals/config/789754228632403?v=2.9.298&r=stable&domain...126.9 KiB48.6 KiB
www.zdnet.com/a/neutron/a9b03a097529.modern.js105.7 KiB48.6 KiB
client.aps.amazon-adsystem.com/publisher.js81.9 KiB45.4 KiB
connect.facebook.net/en_US/fbevents.js96.3 KiB43.1 KiB
cdn.static.zdbb.net/js/z0WVjCBSEeGLoxIxOQVEwQ.min.js174.7 KiB41.0 KiB
cdn.doubleverify.com/dv-measurements9748.js94.2 KiB37.4 KiB
fundingchoicesmessages.google.com/i/pub-8038936283815017?ers=168.5 KiB34.3 KiB
www.zdnet.com/a/neutron/59897d9a5a29.modern.js70.7 KiB31.6 KiB
/pagead/managed/js/activeview/current/ufs_web_display.js73.1 KiB31.0 KiB
www.zdnet.com/a/neutron/2b4cf0b756ec.modern.js57.5 KiB28.0 KiB
/dxjsmodule/12.1a2b7192fd54e87d3971.chunk.js?Q_CLIENTVERS...35.7 KiB27.4 KiB
assets.bounceexchange.com/assets/bounce/jquery-3.7.1.min.js30.3 KiB20.9 KiB

Consider reducing the time spent parsing, compiling, and executing JS. You may find delivering smaller JS payloads helps with this. Learn how to reduce Javascript execution time.

Why this matters

Performance issues directly impact user engagement and conversion rates.

Consider reducing the time spent parsing, compiling and executing JS. You may find delivering smaller JS payloads helps with this. Learn how to minimize main-thread work

Why this matters

Performance issues directly impact user engagement and conversion rates.

CategoryTime Spent
Script Evaluation3.0 s
Other743 ms
Script Parsing & Compilation701 ms
Style & Layout236 ms
Parse HTML & CSS230 ms
Garbage Collection131 ms
Rendering47 ms

Many navigations are performed by going back to a previous page, or forwards again. The back/forward cache (bfcache) can speed up these return navigations. Learn more about the bfcache

Why this matters

Performance issues directly impact user engagement and conversion rates.

Failure reasonFailure type
The page has an unload handler in the main frame.Actionable

Reduce unused rules from stylesheets and defer CSS not used for above-the-fold content to decrease bytes consumed by network activity. Learn how to reduce unused CSS.

Why this matters

Performance issues directly impact user engagement and conversion rates.

Estimated savings: 0.0 ms 24.1 KiB

More information about the performance of your application. These numbers don't directly affect the Performance score.

Layout shift culprits
Optimize DOM size
Font display
Forced reflow
LCP breakdown
Modern HTTP
Optimize viewport for mobile
Minify CSS
Minify JavaScript
User Timing marks and measures 26 user timings
Avoid long main-thread tasks 18 long tasks found
Avoid non-composited animations 1 animated element found
Image elements have explicit `width` and `height`
Network Requests
Network Round Trip Times 210 ms
Server Backend Latencies 800 ms
Tasks
Diagnostics
Metrics
Screenshot Thumbnails
Final Screenshot
Script Treemap Data
Resources Summary
Initial server response time was short Root document took 150 ms
Avoid large layout shifts 1 layout shift found
INP breakdown
100

Accessibility

These checks highlight opportunities to improve the accessibility of your web app. Automatic detection can only detect a subset of issues and does not guarantee the accessibility of your web app, so manual testing is also encouraged.

Visible text labels that do not match the accessible name can result in a confusing experience for screen reader users. Learn more about accessible names.

Why this matters

Performance issues directly impact user engagement and conversion rates.

Failing Elements
artificial intelligence Half of all US employees use AI at work now - and waste… div.u-grid-columns > div.c-pageHome_body > div.c-featureFeaturedStory > a.c-featureFeaturedStory_link
windows Microsoft's latest Windows update now confirms if your PC is Secure Boo… div.u-grid-columns > div.c-pageHome_body > div.c-featureFeaturedStory > a.c-featureFeaturedStory_link
linux Can this $70 Linux app make up for the lack of Photoshop? I tried it to f… div.u-grid-columns > div.c-pageHome_body > div.c-featureFeaturedStory > a.c-featureFeaturedStory_link
Privacy Policy div#onetrust-group-container > div#onetrust-policy > div#onetrust-policy-text > a.ot-cookie-policy-link
Interactive controls are keyboard focusable
Interactive elements indicate their purpose and state
The page has a logical tab order
Visual order on the page follows DOM order
User focus is not accidentally trapped in a region
The user's focus is directed to new content added to the page
HTML5 landmark elements are used to improve navigation
Offscreen content is hidden from assistive technology
Custom controls have associated labels
Custom controls have ARIA roles
`[aria-*]` attributes match their roles
`[aria-hidden="true"]` is not present on the document `<body>`
`[role]`s have all required `[aria-*]` attributes
`[role]` values are valid
`[aria-*]` attributes have valid values
`[aria-*]` attributes are valid and not misspelled
Buttons have an accessible name
Image elements have `[alt]` attributes
`[user-scalable="no"]` is not used in the `<meta name="viewport">` element and the `[maximum-scale]` attribute is not less than 5.
`button`, `link`, and `menuitem` elements have accessible names
ARIA attributes are used as specified for the element's role
Elements with `role="dialog"` or `role="alertdialog"` have accessible names.
`[aria-hidden="true"]` elements do not contain focusable descendents
Elements use only permitted ARIA attributes
Background and foreground colors have a sufficient contrast ratio
Document has a `<title>` element
`<frame>` or `<iframe>` elements have a title
`<html>` element has a `[lang]` attribute
`<html>` element has a valid value for its `[lang]` attribute
Links are distinguishable without relying on color.
Links have a discernible name
Lists contain only `<li>` elements and script supporting elements (`<script>` and `<template>`).
List items (`<li>`) are contained within `<ul>`, `<ol>` or `<menu>` parent elements
No element has a `[tabindex]` value greater than 0
Touch targets have sufficient size and spacing.
Heading elements appear in a sequentially-descending order
Document has a main landmark.
Deprecated ARIA roles were not used
`[accesskey]` values are unique
ARIA input fields have accessible names
ARIA `meter` elements have accessible names
ARIA `progressbar` elements have accessible names
Elements with an ARIA `[role]` that require children to contain a specific `[role]` have all required children.
`[role]`s are contained by their required parent element
Elements with the `role=text` attribute do not have focusable descendents.
ARIA toggle fields have accessible names
ARIA `tooltip` elements have accessible names
ARIA `treeitem` elements have accessible names
The page contains a heading, skip link, or landmark region
`<dl>`'s contain only properly-ordered `<dt>` and `<dd>` groups, `<script>`, `<template>` or `<div>` elements.
Definition list items are wrapped in `<dl>` elements
ARIA IDs are unique
No form fields have multiple labels
`<html>` element has an `[xml:lang]` attribute with the same base language as the `[lang]` attribute.
Input buttons have discernible text.
`<input type="image">` elements have `[alt]` text
Form elements have associated labels
The document does not use `<meta http-equiv="refresh">`
`<object>` elements have alternate text
Select elements have associated label elements.
Skip links are focusable.
Cells in a `<table>` element that use the `[headers]` attribute refer to table cells within the same table.
`<th>` elements and elements with `[role="columnheader"/"rowheader"]` have data cells they describe.
`[lang]` attributes have a valid value
`<video>` elements contain a `<track>` element with `[kind="captions"]`
Tables have different content in the summary attribute and `<caption>`.
All heading elements contain content.
Uses ARIA roles only on compatible elements
Image elements do not have `[alt]` attributes that are redundant text.
Identical links have the same purpose.
Tables use `<caption>` instead of cells with the `[colspan]` attribute to indicate a caption.
`<td>` elements in a large `<table>` have one or more table headers.
77

Best Practices

General

Deprecated APIs will eventually be removed from the browser. Learn more about deprecated APIs.

Why this matters

Performance issues directly impact user engagement and conversion rates.

Deprecation / WarningSource
SharedStorage
Unload event listeners are deprecated and will be removed.
AttributionReporting

Errors logged to the console indicate unresolved problems. They can come from network request failures and other browser concerns. Learn more about this errors in console diagnostic audit

Why this matters

Performance issues directly impact user engagement and conversion rates.

SourceDescription
Failed to load resource: the server responded with a status of 451 ()

Source maps translate minified code to the original source code. This helps developers debug in production. In addition, Lighthouse is able to provide further insights. Consider deploying source maps to take advantage of these benefits. Learn more about source maps.

Why this matters

Performance issues directly impact user engagement and conversion rates.

Uses HTTPS
Avoids third-party cookies
Allows users to paste into input fields
Avoids requesting the geolocation permission on page load
Avoids requesting the notification permission on page load
Displays images with correct aspect ratio
Serves images with appropriate resolution
Page has the HTML doctype
Properly defines charset
No issues in the `Issues` panel in Chrome Devtools
Ensure CSP is effective against XSS attacks
Ensure proper origin isolation with COOP
Mitigate DOM-based XSS with Trusted Types
Detected JavaScript libraries
Redirects HTTP traffic to HTTPS
Use a strong HSTS policy
Mitigate clickjacking with XFO or CSP
100

SEO

These checks ensure that your page is following basic search engine optimization advice. There are many additional factors Lighthouse does not score here that may affect your search ranking, including performance on Core Web Vitals. Learn more about Google Search Essentials.

Structured data is valid
Page isn’t blocked from indexing
Document has a `<title>` element
Document has a meta description
Page has successful HTTP status code
Links have descriptive text
Links are crawlable
robots.txt is valid
Image elements have `[alt]` attributes
Document has a valid `hreflang`
Document has a valid `rel=canonical`

Send Feedback