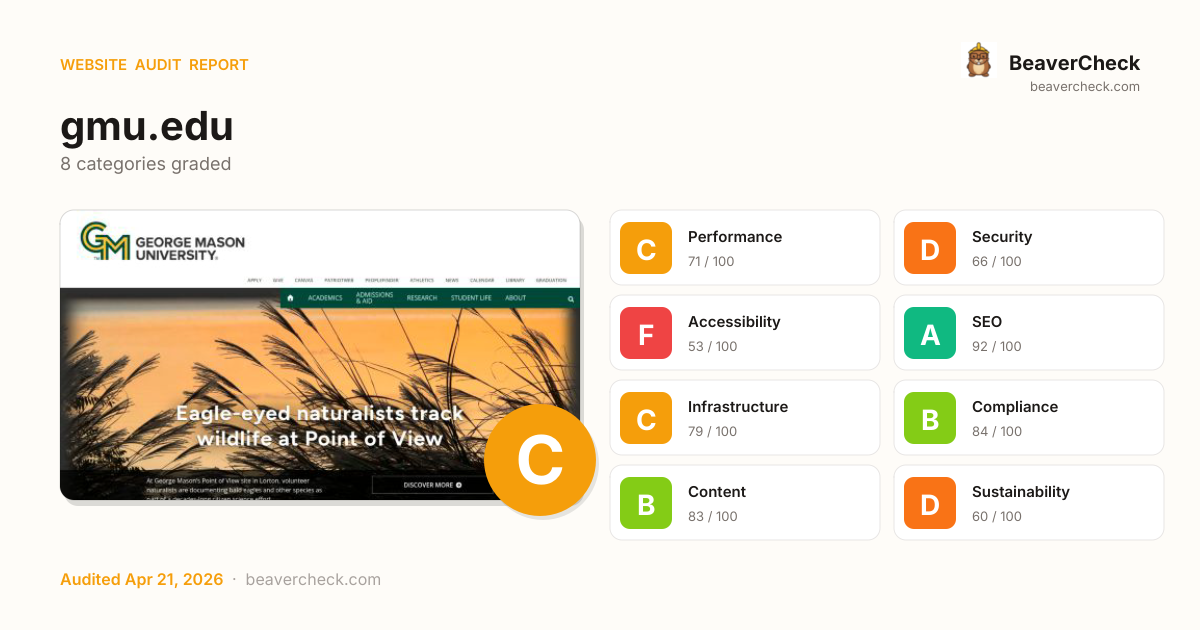
Mobile 375 × 812

Desktop 1440 × 900

Score: 71 / 100
Based on 8 categories, 0 sections
Decent speed, but optimizing further could improve engagement.
Several missing protections leave your users and data exposed.
Several issues make your site difficult for assistive technology users.
Well-optimized for search — your content is discoverable.
Good server performance with room for optimization.
Mostly compliant — a few items need attention.
Good content signals with minor gaps.
Heavier than average — reducing page weight saves energy and bandwidth.
The overall score is a weighted average of individual category scores. Categories with more impact on user experience and security carry more weight.
Weights reflect general web best practices. Individual needs may differ.
HSTS header is missing
Security gaps expose your site and users to attacks, eroding trust.
Page weighs 10.5 MB (5.5 MB transferred)
Performance issues directly impact user engagement and conversion rates.
1 control(s) without accessible label
Accessibility issues exclude users with disabilities — up to 15% of your potential audience.
4 button(s) with no accessible text
Accessibility issues exclude users with disabilities — up to 15% of your potential audience.
No <main> landmark found
Accessibility issues exclude users with disabilities — up to 15% of your potential audience.
High impact, low effort — start here.
High impact, requires investment.
Small gains, minimal effort.
Nothing in this quadrant — good news.
Low impact, high effort — do last.
Nothing in this quadrant — good news.
[](https://beavercheck.com/results/107825cb-c5ce-4602-bdbc-62829bddc6a7)<a href="https://beavercheck.com/results/107825cb-c5ce-4602-bdbc-62829bddc6a7"><img src="https://beavercheck.com/badge?url=https%3A%2F%2Fgmu.edu" alt="BeaverCheck Score"></a>https://beavercheck.com/badge?url=https%3A%2F%2Fgmu.eduThis badge auto-updates with your latest scan result.
Your site performs reasonably well, but a few targeted fixes could meaningfully improve results. Your LCP of 32.1s exceeds Google's 2.5s 'Good' threshold and the 1 performance issue below directly contributes to it. Accessibility issues exclude users who rely on assistive technology — an estimated 15% of your potential audience. Addressing the critical issues below would have the most immediate impact on your user trust.
8 barrier(s) likely increasing bounce by ~31%.
Page takes 32.1s to load
+12% bounceUsers abandon at ~3s — you're 29.6s over the 2.5s threshold
Fix: Optimize render-blocking resources, preload the hero image, and compress images
Page feels frozen for 1.4s
+5% bounceClicks on the primary CTA are ignored while JavaScript runs
Fix: Break up long tasks; defer non-critical JavaScript to post-hydration
No HSTS header
+1% bounceReturning visitors are briefly exposed to downgrade attacks on first request
Fix: Set Strict-Transport-Security: max-age=31536000; includeSubDomains
No Content-Security-Policy header
+1% bounceHigher XSS blast radius — one compromised script can exfiltrate the checkout form
Fix: Ship a reporting-only CSP first, then enforce once violations are clean
1 form field(s) without a label
+2% bounceScreen readers skip unlabeled fields; autofill can't identify them; checkout abandonment spikes
Fix: Associate every input with a visible <label for="…">; add autocomplete attributes
No structured data
+2% bounceNo rich-result eligibility in Google — lower SERP CTR vs competitors with stars and prices
Fix: Add JSON-LD for your page type (Product, Article, FAQPage, LocalBusiness, …)
Content is hard to read
+2% bounceGraduate-level reading difficulty — limits the addressable audience for product or blog pages
Fix: Shorten sentences; replace jargon with plain language; target Flesch ease ≥60
2 broken link(s) on the page
+3% bounceClicks land on 404s — trust drops and the session often ends
Fix: Fix or remove the broken destinations surfaced on the Content tab
Preliminary CRO audit — each barrier links to the tab with detailed analysis.
$700 investment → $1.38/month returns + USD 157,500 risk avoided
$700
7h · 5 findings
$1.38 /mo
~$17 / year
USD 157,500
if kept compliant
$50 — in quick wins — start here for the fastest payback
Figures combine localized regulatory fine ceilings, search/conversion value priced against local CPC, and bandwidth waste estimates. Results depend on implementation quality and audience composition. Not legal or financial advice.
7.0 developer hours at $100/hr
Based on United States rates ($100/hr)
Start here for the best return on investment
$13,126 / month at risk
~$157,517 / year if left unfixed
$157,500
+6 more
$1.38 /mo
17209.1 MB/mo × 0.080 USD/GB
Compliance figures represent the statutory maximum fine for the most severe triggered category, capped per regulation — not the sum of per-finding penalties. Based on published regulatory fine ranges. This is not legal advice.
Unique monthly visitors from your analytics
Purchases, signups, or key actions
Optional — for revenue estimation
more engaged visitors from reduced bounce
Fix 5 critical issues to capture this value
Based on Google/Deloitte research ("Milliseconds Make Millions") showing a ~7% bounce rate increase per additional second of LCP above the 2.5s "Good" threshold.
Your site's LCP: → estimated after fixes.
These are estimates based on industry research — actual results vary
Your data stays in your browser — nothing is sent to our servers
Thanks for your feedback!
We'll use a cached audit if available, or offer to scan.
Industry-standard audits powered by Google Lighthouse.
Key metrics that affect user experience.
First Contentful Paint First Contentful Paint — how long until the browser renders the first piece of content. Under 1.8s is good.
5.20 s
Largest Contentful Paint Largest Contentful Paint — how long until the largest visible element loads. Under 2.5s is good.
32.12 s
Total Blocking Time Total Blocking Time — total time the main thread was blocked, preventing user input. Under 200ms is good.
1.42 s
Cumulative Layout Shift Cumulative Layout Shift — measures visual stability. How much the page layout shifts during loading. Under 0.1 is good.
0.054
Speed Index Speed Index — how quickly content is visually displayed during load. Under 3.4s is good.
11.37 s
Time to Interactive Time to Interactive — how long until the page is fully interactive and responds to user input. Under 3.8s is good.
32.14 s
Audit breakdown by category with detailed findings.
Remove large, duplicate JavaScript modules from bundles to reduce unnecessary bytes consumed by network activity.
Performance issues directly impact user engagement and conversion rates.
Polyfills and transforms enable older browsers to use new JavaScript features. However, many aren't necessary for modern browsers. Consider modifying your JavaScript build process to not transpile Baseline features, unless you know you must support older browsers. Learn why most sites can deploy ES6+ code without transpiling
Shipping ES5 transpiled code to modern browsers wastes bytes — every user with an evergreen browser pays for compatibility you don't need.
Most users today run browsers that natively support ES6+, async/await, optional chaining, and the rest of modern JavaScript. Transpiling to ES5 'just in case' adds 20-40% to your bundle for no benefit. Configure your build to target a modern browserslist, or ship a differential bundle pair (modern + legacy) with the module/nomodule pattern.
Source: Google web.dev / Lighthouse
3rd party code can significantly impact load performance. Reduce and defer loading of 3rd party code to prioritize your page's content.
Performance issues directly impact user engagement and conversion rates.
A long cache lifetime can speed up repeat visits to your page. Learn more about caching.
Performance issues directly impact user engagement and conversion rates.
| Request | Cache TTL | Transfer Size |
|---|---|---|
| cookie-cdn.cookiepro.com/scripttemplates/202405.1.0/otBannerSdk.js | 86400.0 s | 109.5 KiB |
| cookie-cdn.cookiepro.com/scripttemplates/otSDKStub.js | 86400.0 s | 9.3 KiB |
| /consent/bf886dba-bf8f-4844-8acb-cfdc11c842e6/OtAutoBlock.js | 86400.0 s | 5.6 KiB |
| /logos/1e230229-d2a5-43c4-abb0-23c55faa6c2b/018fc62f-ff09... | 86400.0 s | 5.2 KiB |
| cookie-cdn.cookiepro.com/logos/static/poweredBy_cp_logo.svg | 86400.0 s | 2.8 KiB |
| cookie-cdn.cookiepro.com/logos/static/ot_close.svg | 86400.0 s | 844 B |
Your first network request is the most important. Reduce its latency by avoiding redirects, ensuring a fast server response, and enabling text compression.
Performance issues directly impact user engagement and conversion rates.
Consider setting font-display to swap or optional to ensure text is consistently visible. swap can be further optimized to mitigate layout shifts with font metric overrides.
Performance issues directly impact user engagement and conversion rates.
A forced reflow occurs when JavaScript queries geometric properties (such as offsetWidth) after styles have been invalidated by a change to the DOM state. This can result in poor performance. Learn more about forced reflows and possible mitigations.
Performance issues directly impact user engagement and conversion rates.
Reducing the download time of images can improve the perceived load time of the page and LCP. Learn more about optimizing image size
Performance issues directly impact user engagement and conversion rates.
| URL | Resource Size | Est Savings | |
|---|---|---|---|
Spring flowers bloom in front of the Engineering building div.block > div.feature-image > div.narrow-overlaid-image > img | /sites/default/files/styles/feature_image_small/public/20... | 94.4 KiB | 78.4 KiB |
Deepthi Murali (second from right) and team outside the National Museum of Afri… div.block > div.feature-image > div.narrow-overlaid-image > img | /sites/default/files/styles/feature_image_small/public/20... | 90.3 KiB | 74.3 KiB |
George Mason graduate programs rank #1 in Virginia, Top 50 nationally
U.S. New… div.slick-slider > div.slick-list > div.slick-track > div.slick__slide | /sites/default/files/styles/crop_slide/public/2026-04/Wil... | 584.3 KiB | 73.8 KiB |
Volunteers work in the University Greenhouse div.block > div.feature-image > div.narrow-overlaid-image > img | /sites/default/files/styles/feature_image_small/public/20... | 72.7 KiB | 56.6 KiB |
President Gregory Washington a > div > div.field > img | /sites/default/files/2025-09/PGW headshot 25 aira 7x5 250... | 31.2 KiB | 28.0 KiB |
Home div.region > div#block-sf-mason-2024-sitebranding > a.logo > img | www.gmu.edu/sites/default/files/Header_logo_George-Mason-University-2024_0.png | 24.8 KiB | 23.0 KiB |
Each subpart has specific improvement strategies. Ideally, most of the LCP time should be spent on loading the resources, not within delays.
Performance issues directly impact user engagement and conversion rates.
Optimize LCP by making the LCP image discoverable from the HTML immediately, and avoiding lazy-loading
Performance issues directly impact user engagement and conversion rates.
Avoid chaining critical requests by reducing the length of chains, reducing the download size of resources, or deferring the download of unnecessary resources to improve page load.
Performance issues directly impact user engagement and conversion rates.
Requests are blocking the page's initial render, which may delay LCP. Deferring or inlining can move these network requests out of the critical path.
Performance issues directly impact user engagement and conversion rates.
These insights are also available in the Chrome DevTools Performance Panel - record a trace to view more detailed information.
Time to Interactive is the amount of time it takes for the page to become fully interactive. Learn more about the Time to Interactive metric.
Performance issues directly impact user engagement and conversion rates.
Redirects introduce additional delays before the page can be loaded. Learn how to avoid page redirects.
Performance issues directly impact user engagement and conversion rates.
| URL | Time Spent |
|---|---|
| gmu.edu/ | 1.0 s |
| www.gmu.edu/ | 809 ms |
| www.gmu.edu/ | 0.0 ms |
The maximum potential First Input Delay that your users could experience is the duration of the longest task. Learn more about the Maximum Potential First Input Delay metric.
Performance issues directly impact user engagement and conversion rates.
Reduce unused JavaScript and defer loading scripts until they are required to decrease bytes consumed by network activity. Learn how to reduce unused JavaScript.
Multi-megabyte JavaScript bundles delay every interactive feature on the page.
This is the Lighthouse audit fired when too much JS is shipped relative to what executes. The fix isn't a config flag — it requires bundle analysis (webpack-bundle-analyzer, rollup-plugin-visualizer), splitting routes into chunks, lazy-loading off-screen components, and removing unused dependencies. Fundamentally different from minification: minifying reduces byte count, this reduces what's downloaded at all.
Source: Google web.dev / Lighthouse
| URL | Transfer Size | Est Savings |
|---|---|---|
| /sites/default/files/js/js_YA3389NXyVrf3RJNzG535wKOt9HP4I... | 246.2 KiB | 145.4 KiB |
| cookie-cdn.cookiepro.com/scripttemplates/202405.1.0/otBannerSdk.js | 109.1 KiB | 59.2 KiB |
Consider reducing the time spent parsing, compiling, and executing JS. You may find delivering smaller JS payloads helps with this. Learn how to reduce Javascript execution time.
Performance issues directly impact user engagement and conversion rates.
| URL | Total CPU Time | Script Evaluation | Script Parse |
|---|---|---|---|
| www.gmu.edu/ | 703 ms | 18 ms | 5.1 ms |
| Unattributable | 645 ms | 57 ms | 0.0 ms |
| /sites/default/files/js/js_YA3389NXyVrf3RJNzG535wKOt9HP4I... | 571 ms | 317 ms | 60 ms |
| www.gmu.edu/libraries/fontawesome/js/regular.min.js?v=6.4.0 | 445 ms | 183 ms | 238 ms |
| www.gmu.edu/libraries/fontawesome/js/solid.min.js?v=6.4.0 | 395 ms | 178 ms | 174 ms |
| cookie-cdn.cookiepro.com/scripttemplates/202405.1.0/otBannerSdk.js | 317 ms | 192 ms | 60 ms |
| www.gmu.edu/libraries/fontawesome/js/custom-icons.min.js?v=6.4.0 | 297 ms | 281 ms | 1.9 ms |
| www.gmu.edu/libraries/fontawesome/js/sharp-solid.min.js?v=6.4.0 | 280 ms | 127 ms | 141 ms |
| www.gmu.edu/libraries/fontawesome/js/brands.min.js?v=6.4.0 | 268 ms | 221 ms | 46 ms |
| www.gmu.edu/libraries/fontawesome/js/fontawesome.min.js?v=6.4.0 | 182 ms | 111 ms | 4.7 ms |
Consider reducing the time spent parsing, compiling and executing JS. You may find delivering smaller JS payloads helps with this. Learn how to minimize main-thread work
Performance issues directly impact user engagement and conversion rates.
| Category | Time Spent |
|---|---|
| Script Evaluation | 1.7 s |
| Style & Layout | 755 ms |
| Script Parsing & Compilation | 739 ms |
| Other | 706 ms |
| Garbage Collection | 86 ms |
| Rendering | 78 ms |
| Parse HTML & CSS | 72 ms |
Reduce unused rules from stylesheets and defer CSS not used for above-the-fold content to decrease bytes consumed by network activity. Learn how to reduce unused CSS.
Performance issues directly impact user engagement and conversion rates.
| URL | Transfer Size | Est Savings |
|---|---|---|
| #onetrust-banner-sdk{-ms-text-size-adjust:100%;-webkit-text-size-adjust:100%} … | 21.1 KiB | 18.6 KiB |
Large network payloads cost users real money and are highly correlated with long load times. Learn how to reduce payload sizes.
Performance issues directly impact user engagement and conversion rates.
Set an explicit width and height on image elements to reduce layout shifts and improve CLS. Learn how to set image dimensions
Performance issues directly impact user engagement and conversion rates.
| URL | |
|---|---|
Home div.region > div#block-sf-mason-2024-sitebranding > a.logo > img | www.gmu.edu/sites/default/files/Header_logo_George-Mason-University-2024_0.png |
Volunteers work in the University Greenhouse div.block > div.feature-image > div.narrow-overlaid-image > img | /sites/default/files/styles/feature_image_small/public/20... |
Spring flowers bloom in front of the Engineering building div.block > div.feature-image > div.narrow-overlaid-image > img | /sites/default/files/styles/feature_image_small/public/20... |
Deepthi Murali (second from right) and team outside the National Museum of Afri… div.block > div.feature-image > div.narrow-overlaid-image > img | /sites/default/files/styles/feature_image_small/public/20... |
George Mason University div#block-sf-mason-2024-footerinformation > div.site-info > span.footer-logo > img.logo | www.gmu.edu/themes/custom/sf_mason_2024/images/mason-logo.png |
More information about the performance of your application. These numbers don't directly affect the Performance score.
These checks highlight opportunities to improve the accessibility of your web app. Automatic detection can only detect a subset of issues and does not guarantee the accessibility of your web app, so manual testing is also encouraged.
Screen reader users rely on frame titles to describe the contents of frames. Learn more about frame titles.
Performance issues directly impact user engagement and conversion rates.
| Failing Elements |
|---|
div > div.field > div.video-embed-field-provider-youtube > iframe.optanon-category-C0004 div > div.field > div.video-embed-field-provider-youtube > iframe.optanon-category-C0004 |
div.align-center > div.field > div.video-embed-field-provider-youtube > iframe.optanon-category-C0004 div.align-center > div.field > div.video-embed-field-provider-youtube > iframe.optanon-category-C0004 |
These are opportunities to improve the semantics of the controls in your application. This may enhance the experience for users of assistive technology, like a screen reader.
Properly ordered headings that do not skip levels convey the semantic structure of the page, making it easier to navigate and understand when using assistive technologies. Learn more about heading order.
Performance issues directly impact user engagement and conversion rates.
| Failing Elements |
|---|
Scholarship for Service students commit to America’s cyber defense div.layout__region > div.block > div.field > h4 |
Around Campus div.block > div.field > div > h4 |
These are opportunities to improve keyboard navigation in your application.
One main landmark helps screen reader users navigate a web page. Learn more about landmarks.
Performance issues directly impact user engagement and conversion rates.
| Failing Elements |
|---|
html.js html.js |
These items highlight common accessibility best practices.
Visible text labels that do not match the accessible name can result in a confusing experience for screen reader users. Learn more about accessible names.
Performance issues directly impact user engagement and conversion rates.
| Failing Elements |
|---|
Help George Mason meet the challenge. div.field > div > p.text-align-center > a |
Cookie Policy div#onetrust-group-container > div#onetrust-policy > div#onetrust-policy-text > a.ot-cookie-policy-link |
All sites should be protected with HTTPS, even ones that don't handle sensitive data. This includes avoiding mixed content, where some resources are loaded over HTTP despite the initial request being served over HTTPS. HTTPS prevents intruders from tampering with or passively listening in on the communications between your app and your users, and is a prerequisite for HTTP/2 and many new web platform APIs. Learn more about HTTPS.
Performance issues directly impact user engagement and conversion rates.
| Insecure URL | Request Resolution |
|---|---|
| www.gmu.edu/ | Allowed |
Source maps translate minified code to the original source code. This helps developers debug in production. In addition, Lighthouse is able to provide further insights. Consider deploying source maps to take advantage of these benefits. Learn more about source maps.
Performance issues directly impact user engagement and conversion rates.
These checks ensure that your page is following basic search engine optimization advice. There are many additional factors Lighthouse does not score here that may affect your search ranking, including performance on Core Web Vitals. Learn more about Google Search Essentials.
Meta descriptions may be included in search results to concisely summarize page content. Learn more about the meta description.
Performance issues directly impact user engagement and conversion rates.
Descriptive link text helps search engines understand your content. Learn how to make links more accessible.
Performance issues directly impact user engagement and conversion rates.
| Link destination | Link Text |
|---|---|
| www.gmu.edu/news/2026-04/patriot-profile-logan-messer | LEARN MORE |
| www.gmu.edu/news/2026-04/patriot-profile-logan-messer | LEARN MORE |
| www.gmu.edu/news/2026-04/patriot-profile-logan-messer | LEARN MORE |
| www.gmu.edu/cookie-policy | More information |
Format your HTML in a way that enables crawlers to better understand your app’s content.
Industry-standard audits powered by Google Lighthouse. — Desktop
Key metrics that affect user experience. — Desktop
First Contentful Paint First Contentful Paint — how long until the browser renders the first piece of content. Under 1.8s is good.
1.42 s
Largest Contentful Paint Largest Contentful Paint — how long until the largest visible element loads. Under 2.5s is good.
5.99 s
Total Blocking Time Total Blocking Time — total time the main thread was blocked, preventing user input. Under 200ms is good.
160 ms
Cumulative Layout Shift Cumulative Layout Shift — measures visual stability. How much the page layout shifts during loading. Under 0.1 is good.
0.004
Speed Index Speed Index — how quickly content is visually displayed during load. Under 3.4s is good.
2.45 s
Time to Interactive Time to Interactive — how long until the page is fully interactive and responds to user input. Under 3.8s is good.
6.00 s
Audit breakdown by category with detailed findings.
Remove large, duplicate JavaScript modules from bundles to reduce unnecessary bytes consumed by network activity.
Performance issues directly impact user engagement and conversion rates.
Polyfills and transforms enable older browsers to use new JavaScript features. However, many aren't necessary for modern browsers. Consider modifying your JavaScript build process to not transpile Baseline features, unless you know you must support older browsers. Learn why most sites can deploy ES6+ code without transpiling
Shipping ES5 transpiled code to modern browsers wastes bytes — every user with an evergreen browser pays for compatibility you don't need.
Most users today run browsers that natively support ES6+, async/await, optional chaining, and the rest of modern JavaScript. Transpiling to ES5 'just in case' adds 20-40% to your bundle for no benefit. Configure your build to target a modern browserslist, or ship a differential bundle pair (modern + legacy) with the module/nomodule pattern.
Source: Google web.dev / Lighthouse
3rd party code can significantly impact load performance. Reduce and defer loading of 3rd party code to prioritize your page's content.
Performance issues directly impact user engagement and conversion rates.
A long cache lifetime can speed up repeat visits to your page. Learn more about caching.
Performance issues directly impact user engagement and conversion rates.
| Request | Cache TTL | Transfer Size |
|---|---|---|
| cookie-cdn.cookiepro.com/scripttemplates/202405.1.0/otBannerSdk.js | 86400.0 s | 109.6 KiB |
| cookie-cdn.cookiepro.com/scripttemplates/otSDKStub.js | 86400.0 s | 9.3 KiB |
| /consent/bf886dba-bf8f-4844-8acb-cfdc11c842e6/OtAutoBlock.js | 86400.0 s | 5.6 KiB |
| /logos/1e230229-d2a5-43c4-abb0-23c55faa6c2b/018fc62f-ff09... | 86400.0 s | 5.3 KiB |
| cookie-cdn.cookiepro.com/logos/static/poweredBy_cp_logo.svg | 86400.0 s | 2.7 KiB |
| cookie-cdn.cookiepro.com/logos/static/ot_close.svg | 86400.0 s | 845 B |
Your first network request is the most important. Reduce its latency by avoiding redirects, ensuring a fast server response, and enabling text compression.
Performance issues directly impact user engagement and conversion rates.
Consider setting font-display to swap or optional to ensure text is consistently visible. swap can be further optimized to mitigate layout shifts with font metric overrides.
Performance issues directly impact user engagement and conversion rates.
A forced reflow occurs when JavaScript queries geometric properties (such as offsetWidth) after styles have been invalidated by a change to the DOM state. This can result in poor performance. Learn more about forced reflows and possible mitigations.
Performance issues directly impact user engagement and conversion rates.
Reducing the download time of images can improve the perceived load time of the page and LCP. Learn more about optimizing image size
Performance issues directly impact user engagement and conversion rates.
| URL | Resource Size | Est Savings | |
|---|---|---|---|
Volunteers work in the University Greenhouse div.block > div.feature-image > div.narrow-overlaid-image > img | /sites/default/files/styles/feature_image_large/public/20... | 138.9 KiB | 107.1 KiB |
President Gregory Washington a > div > div.field > img | /sites/default/files/2025-09/PGW headshot 25 aira 7x5 250... | 69.7 KiB | 52.1 KiB |
Abby Weening goes over the high jump div.block > div.feature-image > div.narrow-overlaid-image > img | /sites/default/files/styles/feature_image_large/public/20... | 43.6 KiB | 29.6 KiB |
Heather Apostol with the Jefferson Memorial in the background div.block > div.feature-image > div.narrow-overlaid-image > img | /sites/default/files/styles/feature_image_large/public/20... | 54.3 KiB | 26.6 KiB |
Home div.region > div#block-sf-mason-2024-sitebranding > a.logo > img | www.gmu.edu/sites/default/files/Header_logo_George-Mason-University-2024_0.png | 12.7 KiB | 10.4 KiB |
Grand Challenge Initiative creative div.field > div.align-center > div.field > img | /sites/default/files/styles/small_content_image/public/20... | 11.8 KiB | 5.1 KiB |
Optimize LCP by making the LCP image discoverable from the HTML immediately, and avoiding lazy-loading
Performance issues directly impact user engagement and conversion rates.
Avoid chaining critical requests by reducing the length of chains, reducing the download size of resources, or deferring the download of unnecessary resources to improve page load.
Performance issues directly impact user engagement and conversion rates.
Requests are blocking the page's initial render, which may delay LCP. Deferring or inlining can move these network requests out of the critical path.
Performance issues directly impact user engagement and conversion rates.
These insights are also available in the Chrome DevTools Performance Panel - record a trace to view more detailed information.
Redirects introduce additional delays before the page can be loaded. Learn how to avoid page redirects.
Performance issues directly impact user engagement and conversion rates.
| URL | Time Spent |
|---|---|
| gmu.edu/ | 486 ms |
| www.gmu.edu/ | 235 ms |
| www.gmu.edu/ | 0.0 ms |
Time to Interactive is the amount of time it takes for the page to become fully interactive. Learn more about the Time to Interactive metric.
Performance issues directly impact user engagement and conversion rates.
Reduce unused JavaScript and defer loading scripts until they are required to decrease bytes consumed by network activity. Learn how to reduce unused JavaScript.
Multi-megabyte JavaScript bundles delay every interactive feature on the page.
This is the Lighthouse audit fired when too much JS is shipped relative to what executes. The fix isn't a config flag — it requires bundle analysis (webpack-bundle-analyzer, rollup-plugin-visualizer), splitting routes into chunks, lazy-loading off-screen components, and removing unused dependencies. Fundamentally different from minification: minifying reduces byte count, this reduces what's downloaded at all.
Source: Google web.dev / Lighthouse
| URL | Transfer Size | Est Savings |
|---|---|---|
| /sites/default/files/js/js_YA3389NXyVrf3RJNzG535wKOt9HP4I... | 246.2 KiB | 145.6 KiB |
| cookie-cdn.cookiepro.com/scripttemplates/202405.1.0/otBannerSdk.js | 109.1 KiB | 59.2 KiB |
Reduce unused rules from stylesheets and defer CSS not used for above-the-fold content to decrease bytes consumed by network activity. Learn how to reduce unused CSS.
Performance issues directly impact user engagement and conversion rates.
| URL | Transfer Size | Est Savings |
|---|---|---|
| #onetrust-banner-sdk{-ms-text-size-adjust:100%;-webkit-text-size-adjust:100%} … | 21.1 KiB | 18.2 KiB |
Large network payloads cost users real money and are highly correlated with long load times. Learn how to reduce payload sizes.
Performance issues directly impact user engagement and conversion rates.
Set an explicit width and height on image elements to reduce layout shifts and improve CLS. Learn how to set image dimensions
Performance issues directly impact user engagement and conversion rates.
| URL | |
|---|---|
Home div.region > div#block-sf-mason-2024-sitebranding > a.logo > img | www.gmu.edu/sites/default/files/Header_logo_George-Mason-University-2024_0.png |
Heather Apostol with the Jefferson Memorial in the background div.block > div.feature-image > div.narrow-overlaid-image > img | /sites/default/files/styles/feature_image_large/public/20... |
Abby Weening goes over the high jump div.block > div.feature-image > div.narrow-overlaid-image > img | /sites/default/files/styles/feature_image_large/public/20... |
Volunteers work in the University Greenhouse div.block > div.feature-image > div.narrow-overlaid-image > img | /sites/default/files/styles/feature_image_large/public/20... |
George Mason University div#block-sf-mason-2024-footerinformation > div.site-info > span.footer-logo > img.logo | www.gmu.edu/themes/custom/sf_mason_2024/images/mason-logo.png |
More information about the performance of your application. These numbers don't directly affect the Performance score.
These checks highlight opportunities to improve the accessibility of your web app. Automatic detection can only detect a subset of issues and does not guarantee the accessibility of your web app, so manual testing is also encouraged.
Focusable descendents within an `[aria-hidden="true"]` element prevent those interactive elements from being available to users of assistive technologies like screen readers. Learn how `aria-hidden` affects focusable elements.
Performance issues directly impact user engagement and conversion rates.
| Failing Elements |
|---|
Eagle-eyed naturalists track wildlife at Point of View
At George Mason’s Point… div.slick-slider > div.slick-list > div.slick-track > div.slick__slide |
These are opportunities to improve the usage of ARIA in your application which may enhance the experience for users of assistive technology, like a screen reader.
Screen reader users rely on frame titles to describe the contents of frames. Learn more about frame titles.
Performance issues directly impact user engagement and conversion rates.
| Failing Elements |
|---|
div > div.field > div.video-embed-field-provider-youtube > iframe.optanon-category-C0004 div > div.field > div.video-embed-field-provider-youtube > iframe.optanon-category-C0004 |
div.align-center > div.field > div.video-embed-field-provider-youtube > iframe.optanon-category-C0004 div.align-center > div.field > div.video-embed-field-provider-youtube > iframe.optanon-category-C0004 |
These are opportunities to improve the semantics of the controls in your application. This may enhance the experience for users of assistive technology, like a screen reader.
Properly ordered headings that do not skip levels convey the semantic structure of the page, making it easier to navigate and understand when using assistive technologies. Learn more about heading order.
Performance issues directly impact user engagement and conversion rates.
| Failing Elements |
|---|
MSW program skills helped this student turn her internship into a full-time role div.layout__region > div.block > div.field > h4 |
Around Campus div.block > div.field > div > h4 |
These are opportunities to improve keyboard navigation in your application.
One main landmark helps screen reader users navigate a web page. Learn more about landmarks.
Performance issues directly impact user engagement and conversion rates.
| Failing Elements |
|---|
html.js html.js |
These items highlight common accessibility best practices.
Visible text labels that do not match the accessible name can result in a confusing experience for screen reader users. Learn more about accessible names.
Performance issues directly impact user engagement and conversion rates.
| Failing Elements |
|---|
Help George Mason meet the challenge. div.field > div > p.text-align-center > a |
Cookie Policy div#onetrust-group-container > div#onetrust-policy > div#onetrust-policy-text > a.ot-cookie-policy-link |
All sites should be protected with HTTPS, even ones that don't handle sensitive data. This includes avoiding mixed content, where some resources are loaded over HTTP despite the initial request being served over HTTPS. HTTPS prevents intruders from tampering with or passively listening in on the communications between your app and your users, and is a prerequisite for HTTP/2 and many new web platform APIs. Learn more about HTTPS.
Performance issues directly impact user engagement and conversion rates.
| Insecure URL | Request Resolution |
|---|---|
| www.gmu.edu/ | Allowed |
Source maps translate minified code to the original source code. This helps developers debug in production. In addition, Lighthouse is able to provide further insights. Consider deploying source maps to take advantage of these benefits. Learn more about source maps.
Performance issues directly impact user engagement and conversion rates.
These checks ensure that your page is following basic search engine optimization advice. There are many additional factors Lighthouse does not score here that may affect your search ranking, including performance on Core Web Vitals. Learn more about Google Search Essentials.
Meta descriptions may be included in search results to concisely summarize page content. Learn more about the meta description.
Performance issues directly impact user engagement and conversion rates.
Descriptive link text helps search engines understand your content. Learn how to make links more accessible.
Performance issues directly impact user engagement and conversion rates.
| Link destination | Link Text |
|---|---|
| www.gmu.edu/news/2026-04/patriot-profile-logan-messer | LEARN MORE |
| www.gmu.edu/news/2026-04/patriot-profile-logan-messer | LEARN MORE |
| www.gmu.edu/news/2026-04/patriot-profile-logan-messer | LEARN MORE |
| www.gmu.edu/cookie-policy | More information |
Format your HTML in a way that enables crawlers to better understand your app’s content.
Send Feedback