Spain · Madrid Completed: Apr 15, 2026 23:26 UTC
Mobile 375 × 812

Desktop 1440 × 900

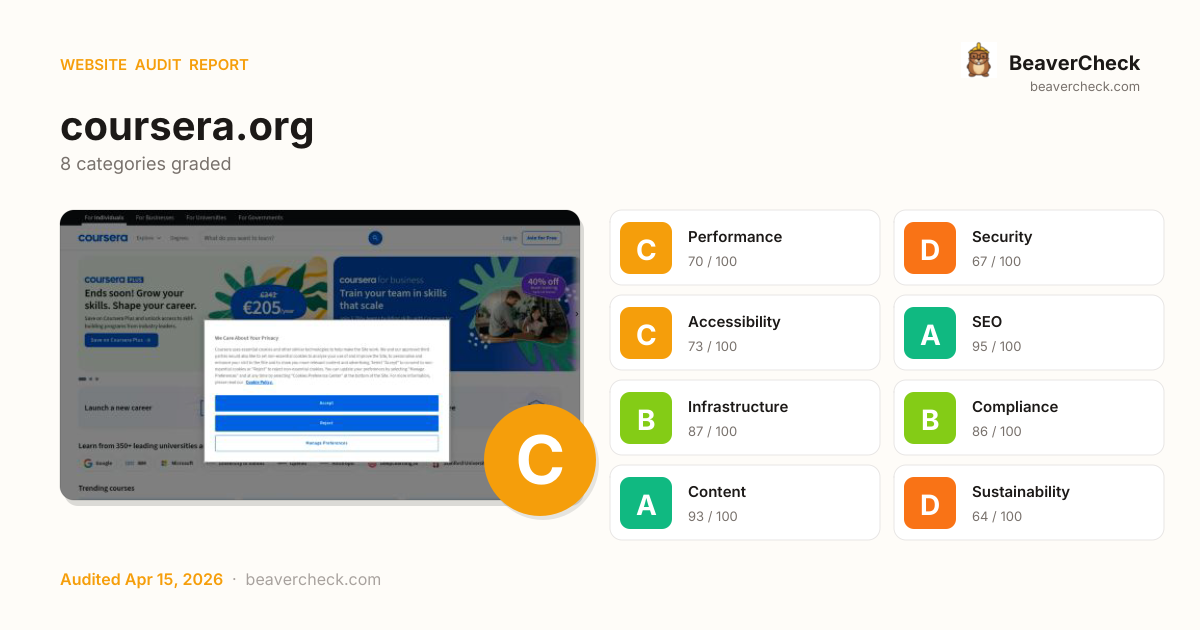
Score: 76 / 100
Based on 8 categories, 0 sections
Decent speed, but optimizing further could improve engagement.
Several missing protections leave your users and data exposed.
Mostly accessible, but some users still face barriers.
Well-optimized for search — your content is discoverable.
Solid infrastructure — fast server responses across the board.
Strong compliance posture across regulations.
Rich content metadata — your pages look great everywhere.
Heavier than average — reducing page weight saves energy and bandwidth.
The overall score is a weighted average of individual category scores. Categories with more impact on user experience and security carry more weight.
Weights reflect general web best practices. Individual needs may differ.
Content-Security-Policy header is missing
Security gaps expose your site and users to attacks, eroding trust.
Cookie '__204u' is missing the Secure flag
Security gaps expose your site and users to attacks, eroding trust.
No Content-Security-Policy header found
Security gaps expose your site and users to attacks, eroding trust.
13 image-only link(s) without alt text
Accessibility issues exclude users with disabilities — up to 15% of your potential audience.
142 third-party resources (100% of weight)
Performance issues directly impact user engagement and conversion rates.
High impact, low effort — start here.
High impact, requires investment.
Small gains, minimal effort.
Nothing in this quadrant — good news.
Low impact, high effort — do last.
Nothing in this quadrant — good news.
[](https://beavercheck.com/results/1270f3a0-b63c-4dbd-93a5-069d190b9bc1)<a href="https://beavercheck.com/results/1270f3a0-b63c-4dbd-93a5-069d190b9bc1"><img src="https://beavercheck.com/badge?url=https%3A%2F%2Fcoursera.org" alt="BeaverCheck Score"></a>https://beavercheck.com/badge?url=https%3A%2F%2Fcoursera.orgThis badge auto-updates with your latest scan result.
Your site performs reasonably well, but a few targeted fixes could meaningfully improve results. Your LCP of 18.1s exceeds Google's 2.5s 'Good' threshold and the 1 performance issue below directly contributes to it. Addressing the critical issues below would have the most immediate impact on your user trust.
€425 investment → €0.63/month returns + EUR 120,500,000 risk avoided
€425
5h · 5 findings
€0.63 /mo
~€7.53 / year
EUR 120,500,000
if kept compliant
€128 — in quick wins — start here for the fastest payback
Figures combine localized regulatory fine ceilings, search/conversion value priced against local CPC, and bandwidth waste estimates. Results depend on implementation quality and audience composition. Not legal or financial advice.
5.0 developer hours at €85/hr
Based on European Union rates (€85/hr)
Start here for the best return on investment
€10,041,667 / month at risk
~€120,500,008 / year if left unfixed
€120,500,000
+5 more
€0.63 /mo
8472.5 MB/mo × 0.074 EUR/GB
Compliance figures represent the statutory maximum fine for the most severe triggered category, capped per regulation — not the sum of per-finding penalties. Based on published regulatory fine ranges. This is not legal advice.
Unique monthly visitors from your analytics
Purchases, signups, or key actions
Optional — for revenue estimation
more engaged visitors from reduced bounce
Fix 4 critical issues to capture this value
Based on Google/Deloitte research ("Milliseconds Make Millions") showing a ~7% bounce rate increase per additional second of LCP above the 2.5s "Good" threshold.
Your site's LCP: → estimated after fixes.
These are estimates based on industry research — actual results vary
Your data stays in your browser — nothing is sent to our servers
Thanks for your feedback!
We'll use a cached audit if available, or offer to scan.
Industry-standard audits powered by Google Lighthouse.
Key metrics that affect user experience.
First Contentful Paint First Contentful Paint — how long until the browser renders the first piece of content. Under 1.8s is good.
3.57 s
Largest Contentful Paint Largest Contentful Paint — how long until the largest visible element loads. Under 2.5s is good.
18.09 s
Total Blocking Time Total Blocking Time — total time the main thread was blocked, preventing user input. Under 200ms is good.
2.45 s
Cumulative Layout Shift Cumulative Layout Shift — measures visual stability. How much the page layout shifts during loading. Under 0.1 is good.
0.000
Speed Index Speed Index — how quickly content is visually displayed during load. Under 3.4s is good.
5.96 s
Time to Interactive Time to Interactive — how long until the page is fully interactive and responds to user input. Under 3.8s is good.
19.11 s
Audit breakdown by category with detailed findings.
Remove large, duplicate JavaScript modules from bundles to reduce unnecessary bytes consumed by network activity.
Performance issues directly impact user engagement and conversion rates.
Polyfills and transforms enable older browsers to use new JavaScript features. However, many aren't necessary for modern browsers. Consider modifying your JavaScript build process to not transpile Baseline features, unless you know you must support older browsers. Learn why most sites can deploy ES6+ code without transpiling
Shipping ES5 transpiled code to modern browsers wastes bytes — every user with an evergreen browser pays for compatibility you don't need.
Most users today run browsers that natively support ES6+, async/await, optional chaining, and the rest of modern JavaScript. Transpiling to ES5 'just in case' adds 20-40% to your bundle for no benefit. Configure your build to target a modern browserslist, or ship a differential bundle pair (modern + legacy) with the module/nomodule pattern.
Source: Google web.dev / Lighthouse
3rd party code can significantly impact load performance. Reduce and defer loading of 3rd party code to prioritize your page's content.
Performance issues directly impact user engagement and conversion rates.
A long cache lifetime can speed up repeat visits to your page. Learn more about caching.
Performance issues directly impact user engagement and conversion rates.
Your first network request is the most important. Reduce its latency by avoiding redirects, ensuring a fast server response, and enabling text compression.
Performance issues directly impact user engagement and conversion rates.
A forced reflow occurs when JavaScript queries geometric properties (such as offsetWidth) after styles have been invalidated by a change to the DOM state. This can result in poor performance. Learn more about forced reflows and possible mitigations.
Performance issues directly impact user engagement and conversion rates.
Avoid chaining critical requests by reducing the length of chains, reducing the download size of resources, or deferring the download of unnecessary resources to improve page load.
Performance issues directly impact user engagement and conversion rates.
Requests are blocking the page's initial render, which may delay LCP. Deferring or inlining can move these network requests out of the critical path.
Performance issues directly impact user engagement and conversion rates.
| URL | Transfer Size | Duration |
|---|---|---|
| browser.sentry-cdn.com/7.116.0/bundle.tracing.min.js | 110.2 KiB | 1.4 s |
Reducing the download time of images can improve the perceived load time of the page and LCP. Learn more about optimizing image size
Performance issues directly impact user engagement and conversion rates.
| URL | Resource Size | Est Savings | |
|---|---|---|---|
40% off team training
*up to 125 licenses div.css-1rqnzpz > div.css-gstc03 > div.css-18rhart > img | /api/utilities/v1/imageproxy/https://images.ctfassets.net... | 94.1 KiB | 70.3 KiB |
Was €342/year; now €205/year. Featuring content from Google, Microsoft, IBM and… div.css-1rqnzpz > div.css-gstc03 > div.css-18rhart > img | /api/utilities/v1/imageproxy/https://images.ctfassets.net... | 67.6 KiB | 50.5 KiB |
div.cds-ProductCard-listCard > div.cds-ProductCard-listContentContainer > div.cds-ProductCard-listPreviewImage > img div.cds-ProductCard-listCard > div.cds-ProductCard-listContentContainer > div.cds-ProductCard-listPreviewImage > img | /api/utilities/v1/imageproxy/https://coursera-course-phot... | 17.0 KiB | 15.3 KiB |
div.cds-ProductCard-gridCard > div.cds-ProductCard-gridPreviewContainer > div.cds-CommonCard-previewImage > img div.cds-ProductCard-gridCard > div.cds-ProductCard-gridPreviewContainer > div.cds-CommonCard-previewImage > img | /api/utilities/v1/imageproxy/https://d15cw65ipctsrr.cloud... | 25.1 KiB | 13.3 KiB |
div.cds-ProductCard-gridCard > div.cds-ProductCard-gridPreviewContainer > div.cds-CommonCard-previewImage > img div.cds-ProductCard-gridCard > div.cds-ProductCard-gridPreviewContainer > div.cds-CommonCard-previewImage > img | /api/utilities/v1/imageproxy/https://d15cw65ipctsrr.cloud... | 24.5 KiB | 12.7 KiB |
div.css-18htstt > div.css-1ht76x9 > picture > img div.css-18htstt > div.css-1ht76x9 > picture > img | /api/utilities/v1/imageproxy/https://images.ctfassets.net... | 17.2 KiB | 12.4 KiB |
These insights are also available in the Chrome DevTools Performance Panel - record a trace to view more detailed information.
The maximum potential First Input Delay that your users could experience is the duration of the longest task. Learn more about the Maximum Potential First Input Delay metric.
Performance issues directly impact user engagement and conversion rates.
Redirects introduce additional delays before the page can be loaded. Learn how to avoid page redirects.
Performance issues directly impact user engagement and conversion rates.
| URL | Time Spent |
|---|---|
| coursera.org/ | 889 ms |
| www.coursera.org/ | 0.0 ms |
Time to Interactive is the amount of time it takes for the page to become fully interactive. Learn more about the Time to Interactive metric.
Performance issues directly impact user engagement and conversion rates.
Reduce unused JavaScript and defer loading scripts until they are required to decrease bytes consumed by network activity. Learn how to reduce unused JavaScript.
Multi-megabyte JavaScript bundles delay every interactive feature on the page.
This is the Lighthouse audit fired when too much JS is shipped relative to what executes. The fix isn't a config flag — it requires bundle analysis (webpack-bundle-analyzer, rollup-plugin-visualizer), splitting routes into chunks, lazy-loading off-screen components, and removing unused dependencies. Fundamentally different from minification: minifying reduces byte count, this reduces what's downloaded at all.
Source: Google web.dev / Lighthouse
| URL | Transfer Size | Est Savings |
|---|---|---|
| /webapps/r2-builds/br/front-page/en.app.06565108064280dec... | 426.3 KiB | 156.0 KiB |
| /webapps/r2-builds/br/front-page/en.14.27e487db002ff9d5ac... | 285.0 KiB | 116.9 KiB |
| /webapps/r2-builds/br/front-page/13.80f8f2acf86dc720779c.js | 229.9 KiB | 113.8 KiB |
| accounts.google.com/gsi/client | 95.4 KiB | 72.3 KiB |
| www.googletagmanager.com/gtm.js?id=GTM-5JKLVK&l=dataLayer | 227.8 KiB | 69.8 KiB |
| www.googletagmanager.com/gtag/destination?id=AW-927621030&cx=c>m=4e64e1 | 139.2 KiB | 68.3 KiB |
| cdn.cookielaw.org/scripttemplates/202508.2.0/otBannerSdk.js | 120.7 KiB | 63.1 KiB |
| www.googletagmanager.com/gtag/js?id=AW-11173242093&cx=c>m=4e64e1 | 139.0 KiB | 62.6 KiB |
| browser.sentry-cdn.com/7.116.0/bundle.tracing.min.js | 109.9 KiB | 60.0 KiB |
| /webapps/r2-builds/br/front-page/5.0ef11e1f293b9100f560.js | 22.1 KiB | 20.4 KiB |
Consider reducing the time spent parsing, compiling, and executing JS. You may find delivering smaller JS payloads helps with this. Learn how to reduce Javascript execution time.
Performance issues directly impact user engagement and conversion rates.
| URL | Total CPU Time | Script Evaluation | Script Parse |
|---|---|---|---|
| /webapps/r2-builds/br/front-page/en.app.06565108064280dec... | 2.8 s | 2.5 s | 138 ms |
| Unattributable | 879 ms | 21 ms | 0.0 ms |
| www.googletagmanager.com/gtm.js?id=GTM-5JKLVK&l=dataLayer | 817 ms | 733 ms | 74 ms |
| www.coursera.org/ | 814 ms | 69 ms | 28 ms |
| /webapps/r2-builds/br/front-page/en.14.27e487db002ff9d5ac... | 631 ms | 512 ms | 110 ms |
| cdn.cookielaw.org/scripttemplates/202508.2.0/otBannerSdk.js | 246 ms | 161 ms | 34 ms |
| browser.sentry-cdn.com/7.116.0/bundle.tracing.min.js | 174 ms | 100 ms | 9.0 ms |
| www.googletagmanager.com/gtag/js?id=AW-11173242093&cx=c>m=4e64e1 | 141 ms | 108 ms | 33 ms |
| www.googletagmanager.com/gtag/destination?id=AW-927621030&cx=c>m=4e64e1 | 117 ms | 85 ms | 31 ms |
| /webapps/r2-builds/br/front-page/13.80f8f2acf86dc720779c.js | 75 ms | 2.2 ms | 72 ms |
| accounts.google.com/gsi/client | 71 ms | 49 ms | 22 ms |
Consider reducing the time spent parsing, compiling and executing JS. You may find delivering smaller JS payloads helps with this. Learn how to minimize main-thread work
Performance issues directly impact user engagement and conversion rates.
| Category | Time Spent |
|---|---|
| Script Evaluation | 4.4 s |
| Other | 988 ms |
| Script Parsing & Compilation | 625 ms |
| Style & Layout | 428 ms |
| Garbage Collection | 179 ms |
| Parse HTML & CSS | 142 ms |
| Rendering | 128 ms |
Many navigations are performed by going back to a previous page, or forwards again. The back/forward cache (bfcache) can speed up these return navigations. Learn more about the bfcache
Performance issues directly impact user engagement and conversion rates.
| Failure reason | Failure type |
|---|---|
| Pages with cache-control:no-store header cannot enter back/forward cache. | Actionable |
| Pages whose main resource has cache-control:no-store cannot enter back/forward cache. | Not actionable |
| Back/forward cache is disabled because some JavaScript network request received resource with Cache-Control: no-store header. | Not actionable |
Minifying CSS files can reduce network payload sizes. Learn how to minify CSS.
Performance issues directly impact user engagement and conversion rates.
| URL | Transfer Size | Est Savings |
|---|---|---|
| .css-y40tq5 { position: relative; top: 0px; width: 100%; … } … | 27.4 KiB | 2.2 KiB |
Reduce unused rules from stylesheets and defer CSS not used for above-the-fold content to decrease bytes consumed by network activity. Learn how to reduce unused CSS.
Performance issues directly impact user engagement and conversion rates.
| URL | Transfer Size | Est Savings |
|---|---|---|
| .css-y40tq5 { position: relative; top: 0px; width: 100%; … } … | 27.4 KiB | 24.5 KiB |
| :root{-webkit-print-color-scheme:light;color-scheme:light;--cds-color-darken-975:rgba(15, 17, 20, 0… | 31.4 KiB | 20.5 KiB |
| 21.7 KiB | 18.8 KiB |
Large network payloads cost users real money and are highly correlated with long load times. Learn how to reduce payload sizes.
Performance issues directly impact user engagement and conversion rates.
Set an explicit width and height on image elements to reduce layout shifts and improve CLS. Learn how to set image dimensions
Performance issues directly impact user engagement and conversion rates.
| URL | |
|---|---|
Was €342/year; now €205/year. Featuring content from Google, Microsoft, IBM and… div.css-1rqnzpz > div.css-gstc03 > div.css-18rhart > img | /api/utilities/v1/imageproxy/https://images.ctfassets.net... |
40% off team training
*up to 125 licenses div.css-1rqnzpz > div.css-gstc03 > div.css-18rhart > img | /api/utilities/v1/imageproxy/https://images.ctfassets.net... |
div.css-18htstt > div.css-1ht76x9 > picture > img div.css-18htstt > div.css-1ht76x9 > picture > img | /api/utilities/v1/imageproxy/https://images.ctfassets.net... |
Was €342/year; now €205/year. Featuring content from Google, Microsoft, IBM and… div.css-9juyzi > div.css-tt9t7i > picture > img | /api/utilities/v1/imageproxy/https://images.ctfassets.net... |
40% off team training
*up to 125 licenses div.css-15xrox9 > div.css-tt9t7i > picture > img | /api/utilities/v1/imageproxy/https://images.ctfassets.net... |
div.css-150mpqx > div.css-tt9t7i > picture > img div.css-150mpqx > div.css-tt9t7i > picture > img | /api/utilities/v1/imageproxy/https://images.ctfassets.net... |
Coursera for Business logo div > div.css-1xgnkn7 > div > img | /api/utilities/v1/imageproxy/https://images.ctfassets.net... |
div > div.css-19incsy > div.css-phfvho > img.css-1080lsv div > div.css-19incsy > div.css-phfvho > img.css-1080lsv | /api/utilities/v1/imageproxy/https://images.ctfassets.net... |
div > div.css-19incsy > div.css-phfvho > img.css-1080lsv div > div.css-19incsy > div.css-phfvho > img.css-1080lsv | /api/utilities/v1/imageproxy/https://images.ctfassets.net... |
div > div.css-19incsy > div.css-phfvho > img.css-1080lsv div > div.css-19incsy > div.css-phfvho > img.css-1080lsv | /api/utilities/v1/imageproxy/https://images.ctfassets.net... |
div > div.css-19incsy > div.css-phfvho > img.css-1080lsv div > div.css-19incsy > div.css-phfvho > img.css-1080lsv | /api/utilities/v1/imageproxy/https://images.ctfassets.net... |
Coursera for Business logo div.css-15xrox9 > div.css-l88zs4 > div > img | /api/utilities/v1/imageproxy/https://images.ctfassets.net... |
Coursera Plus logo div.css-9juyzi > div.css-l88zs4 > div > img | /api/utilities/v1/imageproxy/https://images.ctfassets.net... |
Coursera Plus logo div > div.css-1xgnkn7 > div > img | /api/utilities/v1/imageproxy/https://images.ctfassets.net... |
div > div.css-akqzvp > a.cds-119 > img.css-11x1h9e div > div.css-akqzvp > a.cds-119 > img.css-11x1h9e | /api/utilities/v1/imageproxy/https://images.ctfassets.net... |
div > div.css-akqzvp > a.cds-119 > img.css-11x1h9e div > div.css-akqzvp > a.cds-119 > img.css-11x1h9e | /api/utilities/v1/imageproxy/https://images.ctfassets.net... |
div > div.css-akqzvp > a.cds-119 > img.css-11x1h9e div > div.css-akqzvp > a.cds-119 > img.css-11x1h9e | /api/utilities/v1/imageproxy/https://images.ctfassets.net... |
More information about the performance of your application. These numbers don't directly affect the Performance score.
These checks highlight opportunities to improve the accessibility of your web app. Automatic detection can only detect a subset of issues and does not guarantee the accessibility of your web app, so manual testing is also encouraged.
Link text (and alternate text for images, when used as links) that is discernible, unique, and focusable improves the navigation experience for screen reader users. Learn how to make links accessible.
Performance issues directly impact user engagement and conversion rates.
| Failing Elements |
|---|
div.cds-9 > div.cds-9 > div.css-1cn6k0e > a.cds-149 div.cds-9 > div.cds-9 > div.css-1cn6k0e > a.cds-149 |
These are opportunities to improve the semantics of the controls in your application. This may enhance the experience for users of assistive technology, like a screen reader.
Visible text labels that do not match the accessible name can result in a confusing experience for screen reader users. Learn more about accessible names.
Performance issues directly impact user engagement and conversion rates.
| Failing Elements |
|---|
Cookie Policy. div#onetrust-group-container > div#onetrust-policy > div#onetrust-policy-text > a.ot-cookie-policy-link |
Image display dimensions should match natural aspect ratio. Learn more about image aspect ratio.
Performance issues directly impact user engagement and conversion rates.
| URL | Aspect Ratio (Displayed) | Aspect Ratio (Actual) | |
|---|---|---|---|
Logo of Certified B Corporation div.cds-9 > div.b-corp-logo > div.css-1oxwx8r > img.css-3gbnhs | /api/utilities/v1/imageproxy/https://d3njjcbhbojbot.cloud... | 111 x 88 (1.26) | 223 x 240 (0.93) |
Deprecated APIs will eventually be removed from the browser. Learn more about deprecated APIs.
Performance issues directly impact user engagement and conversion rates.
| Deprecation / Warning | Source |
|---|---|
| Unload event listeners are deprecated and will be removed. | browser.sentry-cdn.com/7.116.0/bundle.tracing.min.js line 1, col 105184 |
Errors logged to the console indicate unresolved problems. They can come from network request failures and other browser concerns. Learn more about this errors in console diagnostic audit
Performance issues directly impact user engagement and conversion rates.
| Source | Description |
|---|---|
Not signed in with the identity provider. |
These checks ensure that your page is following basic search engine optimization advice. There are many additional factors Lighthouse does not score here that may affect your search ranking, including performance on Core Web Vitals. Learn more about Google Search Essentials.
Industry-standard audits powered by Google Lighthouse. — Desktop
Key metrics that affect user experience. — Desktop
First Contentful Paint First Contentful Paint — how long until the browser renders the first piece of content. Under 1.8s is good.
1.13 s
Largest Contentful Paint Largest Contentful Paint — how long until the largest visible element loads. Under 2.5s is good.
1.96 s
Total Blocking Time Total Blocking Time — total time the main thread was blocked, preventing user input. Under 200ms is good.
243 ms
Cumulative Layout Shift Cumulative Layout Shift — measures visual stability. How much the page layout shifts during loading. Under 0.1 is good.
0.000
Speed Index Speed Index — how quickly content is visually displayed during load. Under 3.4s is good.
2.88 s
Time to Interactive Time to Interactive — how long until the page is fully interactive and responds to user input. Under 3.8s is good.
4.20 s
Audit breakdown by category with detailed findings.
Remove large, duplicate JavaScript modules from bundles to reduce unnecessary bytes consumed by network activity.
Performance issues directly impact user engagement and conversion rates.
Polyfills and transforms enable older browsers to use new JavaScript features. However, many aren't necessary for modern browsers. Consider modifying your JavaScript build process to not transpile Baseline features, unless you know you must support older browsers. Learn why most sites can deploy ES6+ code without transpiling
Shipping ES5 transpiled code to modern browsers wastes bytes — every user with an evergreen browser pays for compatibility you don't need.
Most users today run browsers that natively support ES6+, async/await, optional chaining, and the rest of modern JavaScript. Transpiling to ES5 'just in case' adds 20-40% to your bundle for no benefit. Configure your build to target a modern browserslist, or ship a differential bundle pair (modern + legacy) with the module/nomodule pattern.
Source: Google web.dev / Lighthouse
3rd party code can significantly impact load performance. Reduce and defer loading of 3rd party code to prioritize your page's content.
Performance issues directly impact user engagement and conversion rates.
Your first network request is the most important. Reduce its latency by avoiding redirects, ensuring a fast server response, and enabling text compression.
Performance issues directly impact user engagement and conversion rates.
A forced reflow occurs when JavaScript queries geometric properties (such as offsetWidth) after styles have been invalidated by a change to the DOM state. This can result in poor performance. Learn more about forced reflows and possible mitigations.
Performance issues directly impact user engagement and conversion rates.
Avoid chaining critical requests by reducing the length of chains, reducing the download size of resources, or deferring the download of unnecessary resources to improve page load.
Performance issues directly impact user engagement and conversion rates.
Requests are blocking the page's initial render, which may delay LCP. Deferring or inlining can move these network requests out of the critical path.
Performance issues directly impact user engagement and conversion rates.
| URL | Transfer Size | Duration |
|---|---|---|
| browser.sentry-cdn.com/7.116.0/bundle.tracing.min.js | 110.2 KiB | 321 ms |
A long cache lifetime can speed up repeat visits to your page. Learn more about caching.
Performance issues directly impact user engagement and conversion rates.
Reducing the download time of images can improve the perceived load time of the page and LCP. Learn more about optimizing image size
Performance issues directly impact user engagement and conversion rates.
| URL | Resource Size | Est Savings | |
|---|---|---|---|
40% off team training
*up to 125 licenses div.css-1rqnzpz > div.css-gstc03 > div.css-18rhart > img | /api/utilities/v1/imageproxy/https://images.ctfassets.net... | 44.2 KiB | 38.4 KiB |
Was €342/year; now €205/year. Featuring content from Google, Microsoft, IBM and… div.css-1rqnzpz > div.css-gstc03 > div.css-18rhart > img | /api/utilities/v1/imageproxy/https://images.ctfassets.net... | 34.2 KiB | 29.7 KiB |
div.cds-ProductCard-gridCard > div.cds-ProductCard-gridPreviewContainer > div.cds-CommonCard-previewImage > img div.cds-ProductCard-gridCard > div.cds-ProductCard-gridPreviewContainer > div.cds-CommonCard-previewImage > img | /api/utilities/v1/imageproxy/https://d15cw65ipctsrr.cloud... | 13.7 KiB | 4.3 KiB |
These insights are also available in the Chrome DevTools Performance Panel - record a trace to view more detailed information.
Redirects introduce additional delays before the page can be loaded. Learn how to avoid page redirects.
Performance issues directly impact user engagement and conversion rates.
| URL | Time Spent |
|---|---|
| coursera.org/ | 335 ms |
| www.coursera.org/ | 0.0 ms |
Time to Interactive is the amount of time it takes for the page to become fully interactive. Learn more about the Time to Interactive metric.
Performance issues directly impact user engagement and conversion rates.
The maximum potential First Input Delay that your users could experience is the duration of the longest task. Learn more about the Maximum Potential First Input Delay metric.
Performance issues directly impact user engagement and conversion rates.
Reduce unused JavaScript and defer loading scripts until they are required to decrease bytes consumed by network activity. Learn how to reduce unused JavaScript.
Multi-megabyte JavaScript bundles delay every interactive feature on the page.
This is the Lighthouse audit fired when too much JS is shipped relative to what executes. The fix isn't a config flag — it requires bundle analysis (webpack-bundle-analyzer, rollup-plugin-visualizer), splitting routes into chunks, lazy-loading off-screen components, and removing unused dependencies. Fundamentally different from minification: minifying reduces byte count, this reduces what's downloaded at all.
Source: Google web.dev / Lighthouse
| URL | Transfer Size | Est Savings |
|---|---|---|
| /webapps/r2-builds/br/front-page/en.app.06565108064280dec... | 426.3 KiB | 152.4 KiB |
| /webapps/r2-builds/br/front-page/13.80f8f2acf86dc720779c.js | 229.9 KiB | 112.2 KiB |
| /webapps/r2-builds/br/front-page/en.14.27e487db002ff9d5ac... | 285.0 KiB | 102.8 KiB |
| www.googletagmanager.com/gtm.js?id=GTM-5JKLVK&l=dataLayer | 227.8 KiB | 69.8 KiB |
| accounts.google.com/gsi/client | 95.4 KiB | 69.2 KiB |
| www.googletagmanager.com/gtag/destination?id=AW-927621030&cx=c>m=4e64e1 | 139.2 KiB | 68.3 KiB |
| cdn.cookielaw.org/scripttemplates/202508.2.0/otBannerSdk.js | 120.7 KiB | 63.1 KiB |
| www.googletagmanager.com/gtag/js?id=AW-11173242093&cx=c>m=4e64e1 | 139.0 KiB | 62.6 KiB |
| browser.sentry-cdn.com/7.116.0/bundle.tracing.min.js | 109.9 KiB | 59.6 KiB |
| /webapps/r2-builds/br/front-page/5.0ef11e1f293b9100f560.js | 22.1 KiB | 20.0 KiB |
Many navigations are performed by going back to a previous page, or forwards again. The back/forward cache (bfcache) can speed up these return navigations. Learn more about the bfcache
Performance issues directly impact user engagement and conversion rates.
| Failure reason | Failure type |
|---|---|
| Pages with cache-control:no-store header cannot enter back/forward cache. | Actionable |
| Pages whose main resource has cache-control:no-store cannot enter back/forward cache. | Not actionable |
| Back/forward cache is disabled because some JavaScript network request received resource with Cache-Control: no-store header. | Not actionable |
Minifying CSS files can reduce network payload sizes. Learn how to minify CSS.
Performance issues directly impact user engagement and conversion rates.
| URL | Transfer Size | Est Savings |
|---|---|---|
| .css-y40tq5 { position: relative; top: 0px; width: 100%; … } … | 46.9 KiB | 3.6 KiB |
Reduce unused rules from stylesheets and defer CSS not used for above-the-fold content to decrease bytes consumed by network activity. Learn how to reduce unused CSS.
Performance issues directly impact user engagement and conversion rates.
| URL | Transfer Size | Est Savings |
|---|---|---|
| .css-y40tq5 { position: relative; top: 0px; width: 100%; … } … | 46.9 KiB | 43.6 KiB |
| :root{-webkit-print-color-scheme:light;color-scheme:light;--cds-color-darken-975:rgba(15, 17, 20, 0… | 31.9 KiB | 20.2 KiB |
| 21.7 KiB | 18.9 KiB |
Set an explicit width and height on image elements to reduce layout shifts and improve CLS. Learn how to set image dimensions
Performance issues directly impact user engagement and conversion rates.
| URL | |
|---|---|
Was €342/year; now €205/year. Featuring content from Google, Microsoft, IBM and… div.css-9juyzi > div.css-tt9t7i > picture > img | /api/utilities/v1/imageproxy/https://images.ctfassets.net... |
40% off team training
*up to 125 licenses div.css-15xrox9 > div.css-tt9t7i > picture > img | /api/utilities/v1/imageproxy/https://images.ctfassets.net... |
div.css-150mpqx > div.css-tt9t7i > picture > img div.css-150mpqx > div.css-tt9t7i > picture > img | /api/utilities/v1/imageproxy/https://images.ctfassets.net... |
Was €342/year; now €205/year. Featuring content from Google, Microsoft, IBM and… div.css-1rqnzpz > div.css-gstc03 > div.css-18rhart > img | /api/utilities/v1/imageproxy/https://images.ctfassets.net... |
40% off team training
*up to 125 licenses div.css-1rqnzpz > div.css-gstc03 > div.css-18rhart > img | /api/utilities/v1/imageproxy/https://images.ctfassets.net... |
Coursera for Business logo div.css-15xrox9 > div.css-l88zs4 > div > img | /api/utilities/v1/imageproxy/https://images.ctfassets.net... |
Coursera for Business logo div > div.css-1xgnkn7 > div > img | /api/utilities/v1/imageproxy/https://images.ctfassets.net... |
div > div.css-19incsy > div.css-phfvho > img.css-1080lsv div > div.css-19incsy > div.css-phfvho > img.css-1080lsv | /api/utilities/v1/imageproxy/https://images.ctfassets.net... |
div > div.css-19incsy > div.css-phfvho > img.css-1080lsv div > div.css-19incsy > div.css-phfvho > img.css-1080lsv | /api/utilities/v1/imageproxy/https://images.ctfassets.net... |
div > div.css-19incsy > div.css-phfvho > img.css-1080lsv div > div.css-19incsy > div.css-phfvho > img.css-1080lsv | /api/utilities/v1/imageproxy/https://images.ctfassets.net... |
div > div.css-19incsy > div.css-phfvho > img.css-1080lsv div > div.css-19incsy > div.css-phfvho > img.css-1080lsv | /api/utilities/v1/imageproxy/https://images.ctfassets.net... |
div > div.css-akqzvp > a.cds-119 > img.css-11x1h9e div > div.css-akqzvp > a.cds-119 > img.css-11x1h9e | /api/utilities/v1/imageproxy/https://images.ctfassets.net... |
div > div.css-akqzvp > a.cds-119 > img.css-11x1h9e div > div.css-akqzvp > a.cds-119 > img.css-11x1h9e | /api/utilities/v1/imageproxy/https://images.ctfassets.net... |
Coursera Plus logo div.css-9juyzi > div.css-l88zs4 > div > img | /api/utilities/v1/imageproxy/https://images.ctfassets.net... |
Coursera Plus logo div > div.css-1xgnkn7 > div > img | /api/utilities/v1/imageproxy/https://images.ctfassets.net... |
div > div.css-akqzvp > a.cds-119 > img.css-11x1h9e div > div.css-akqzvp > a.cds-119 > img.css-11x1h9e | /api/utilities/v1/imageproxy/https://images.ctfassets.net... |
More information about the performance of your application. These numbers don't directly affect the Performance score.
These checks highlight opportunities to improve the accessibility of your web app. Automatic detection can only detect a subset of issues and does not guarantee the accessibility of your web app, so manual testing is also encouraged.
Visible text labels that do not match the accessible name can result in a confusing experience for screen reader users. Learn more about accessible names.
Performance issues directly impact user engagement and conversion rates.
| Failing Elements |
|---|
Cookie Policy. div#onetrust-group-container > div#onetrust-policy > div#onetrust-policy-text > a.ot-cookie-policy-link |
Image display dimensions should match natural aspect ratio. Learn more about image aspect ratio.
Performance issues directly impact user engagement and conversion rates.
| URL | Aspect Ratio (Displayed) | Aspect Ratio (Actual) | |
|---|---|---|---|
Logo of Certified B Corporation div.cds-9 > div.b-corp-logo > div.css-1oxwx8r > img.css-3gbnhs | /api/utilities/v1/imageproxy/https://d3njjcbhbojbot.cloud... | 151 x 120 (1.26) | 223 x 240 (0.93) |
Deprecated APIs will eventually be removed from the browser. Learn more about deprecated APIs.
Performance issues directly impact user engagement and conversion rates.
| Deprecation / Warning | Source |
|---|---|
| Unload event listeners are deprecated and will be removed. | browser.sentry-cdn.com/7.116.0/bundle.tracing.min.js line 1, col 105184 |
Errors logged to the console indicate unresolved problems. They can come from network request failures and other browser concerns. Learn more about this errors in console diagnostic audit
Performance issues directly impact user engagement and conversion rates.
| Source | Description |
|---|---|
browser.sentry-cdn.com/7.116.0/bundle.tracing.min.js line 1, col 7754 | {"stack":"Error: Minified React error #419; visit https://reactjs.org/docs/error-decoder.html?invariant=419 for the full message or use the non-minified dev environment for full errors and additional helpful warnings.\n at https://d3njjcbhbojbot.cloudfront.net/webapps/r2-builds/br/front-page/en.app.06565108064280decbda.js:2:1674613\n at oj (https://d3njjcbhbojbot.cloudfront.net/webapps/r2-builds/br/front-page/en.app.06565108064280decbda.js:2:1675452)\n at Yo (https://d3njjcbhbojbot.cloudfront.net/webapps/r2-builds/br/front-page/en.app.06565108064280decbda.js:2:1717855)\n at Uk (https://d3njjcbhbojbot.cloudfront.net/webapps/r2-builds/br/front-page/en.app.06565108064280decbda.js:2:1704878)\n at Tk (https://d3njjcbhbojbot.cloudfront.net/webapps/r2-builds/br/front-page/en.app.06565108064280decbda.js:2:1704806)\n at Ik (https://d3njjcbhbojbot.cloudfront.net/webapps/r2-builds/br/front-page/en.app.06565108064280decbda.js:2:1704669)\n at Ek (https://d3njjcbhbojbot.cloudfront.net/webapps/r2-builds/br/front-page/en.app.06565108064280decbda.js:2:1701728)\n at jg (https://d3njjcbhbojbot.cloudfront.net/webapps/r2-builds/br/front-page/en.app.06565108064280decbda.js:2:1641277)\n at https://d3njjcbhbojbot.cloudfront.net/webapps/r2-builds/br/front-page/en.app.06565108064280decbda.js:2:1708317\n at Pk (https://d3njjcbhbojbot.cloudfront.net/webapps/r2-builds/br/front-page/en.app.06565108064280decbda.js:2:1708322)\n at Gk (https://d3njjcbhbojbot.cloudfront.net/webapps/r2-builds/br/front-page/en.app.06565108064280decbda.js:2:1700666)\n at J (https://d3njjcbhbojbot.cloudfront.net/webapps/r2-builds/br/front-page/en.app.06565108064280decbda.js:2:580291)\n at R (https://d3njjcbhbojbot.cloudfront.net/webapps/r2-builds/br/front-page/en.app.06565108064280decbda.js:2:580872)\n at Ge.tt.<computed> (https://d3njjcbhbojbot.cloudfront.net/webapps/r2-builds/br/front-page/en.app.06565108064280decbda.js:2:600355)\n at run (https://d3njjcbhbojbot.cloudfront.net/webapps/r2-builds/br/front-page/en.app.06565108064280decbda.js:2:600094)\n at MessagePort.listener (https://d3njjcbhbojbot.cloudfront.net/webapps/r2-builds/br/front-page/en.app.06565108064280decbda.js:2:600167)","message":"Minified React error #419; visit https://reactjs.org/docs/error-decoder.html?invariant=419 for the full message or use the non-minified dev environment for full errors and additional helpful warnings."} |
/webapps/r2-builds/br/front-page/en.app.06565108064280dec... line 1, col 1674612 | Error: Minified React error #419; visit https://reactjs.org/docs/error-decoder.html?invariant=419 for the full message or use the non-minified dev environment for full errors and additional helpful warnings.
at https://d3njjcbhbojbot.cloudfront.net/webapps/r2-builds/br/front-page/en.app.06565108064280decbda.js:2:1674613
at oj (https://d3njjcbhbojbot.cloudfront.net/webapps/r2-builds/br/front-page/en.app.06565108064280decbda.js:2:1675452)
at Yo (https://d3njjcbhbojbot.cloudfront.net/webapps/r2-builds/br/front-page/en.app.06565108064280decbda.js:2:1717855)
at Uk (https://d3njjcbhbojbot.cloudfront.net/webapps/r2-builds/br/front-page/en.app.06565108064280decbda.js:2:1704878)
at Tk (https://d3njjcbhbojbot.cloudfront.net/webapps/r2-builds/br/front-page/en.app.06565108064280decbda.js:2:1704806)
at Ik (https://d3njjcbhbojbot.cloudfront.net/webapps/r2-builds/br/front-page/en.app.06565108064280decbda.js:2:1704669)
at Ek (https://d3njjcbhbojbot.cloudfront.net/webapps/r2-builds/br/front-page/en.app.06565108064280decbda.js:2:1701728)
at jg (https://d3njjcbhbojbot.cloudfront.net/webapps/r2-builds/br/front-page/en.app.06565108064280decbda.js:2:1641277)
at https://d3njjcbhbojbot.cloudfront.net/webapps/r2-builds/br/front-page/en.app.06565108064280decbda.js:2:1708317
at Pk (https://d3njjcbhbojbot.cloudfront.net/webapps/r2-builds/br/front-page/en.app.06565108064280decbda.js:2:1708322)
at Gk (https://d3njjcbhbojbot.cloudfront.net/webapps/r2-builds/br/front-page/en.app.06565108064280decbda.js:2:1700666)
at J (https://d3njjcbhbojbot.cloudfront.net/webapps/r2-builds/br/front-page/en.app.06565108064280decbda.js:2:580291)
at R (https://d3njjcbhbojbot.cloudfront.net/webapps/r2-builds/br/front-page/en.app.06565108064280decbda.js:2:580872)
at Ge.tt.<computed> (https://d3njjcbhbojbot.cloudfront.net/webapps/r2-builds/br/front-page/en.app.06565108064280decbda.js:2:600355)
at run (https://d3njjcbhbojbot.cloudfront.net/webapps/r2-builds/br/front-page/en.app.06565108064280decbda.js:2:600094)
at MessagePort.listener (https://d3njjcbhbojbot.cloudfront.net/webapps/r2-builds/br/front-page/en.app.06565108064280decbda.js:2:600167) |
Not signed in with the identity provider. |
These checks ensure that your page is following basic search engine optimization advice. There are many additional factors Lighthouse does not score here that may affect your search ranking, including performance on Core Web Vitals. Learn more about Google Search Essentials.
Send Feedback