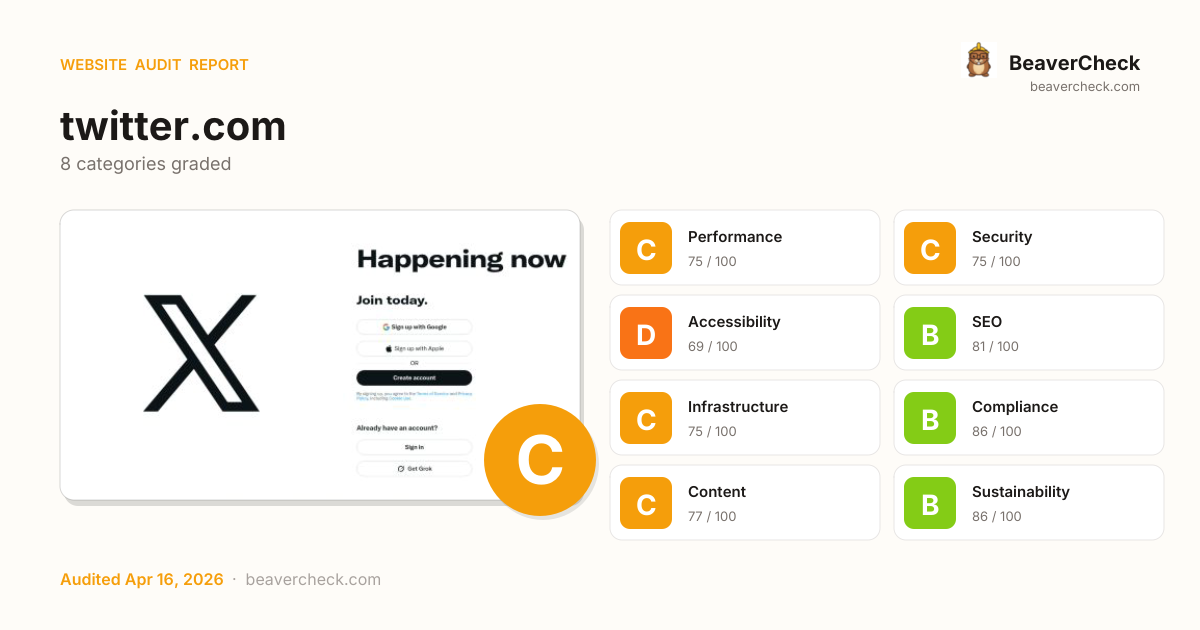
Skip to content
Audit Complete

Results for https://twitter.com

Visit site
Spain Spain · Madrid Completed: Apr 16, 2026 16:55 UTC
Download JSON Download Markdown Report

Mobile 375 × 812

Screenshot of the audited page (Mobile 375×812)

Desktop 1440 × 900

Screenshot of the audited page (Desktop 1440×900)
C76

Site Health

Score: 76 / 100

Based on 8 categories, 0 sections

Decent speed, but optimizing further could improve engagement.

Good foundation, but a few gaps could be exploited.

Several issues make your site difficult for assistive technology users.

Solid SEO basics — a few optimizations could boost rankings.

Good server performance with room for optimization.

Strong compliance posture across regulations.

Good content signals with minor gaps.

Lean and efficient — low environmental impact per visit.

How is this calculated?

The overall score is a weighted average of individual category scores. Categories with more impact on user experience and security carry more weight.

Performance 25%Security 25%Accessibility 15%SEO 10%Infrastructure 10%Compliance 8%Content 5%Sustainability 2%

Weights reflect general web best practices. Individual needs may differ.

How the composite score is calculated

How you compare

Apple sites average 73
At average
Better than 75% of Apple sites See full Apple benchmark →
Arkose Labs sites average 75
At average
Better than 50% of Arkose Labs sites See full Arkose Labs benchmark →

Top Priorities (5)

1

'unsafe-inline' found in script source

Security gaps expose your site and users to attacks, eroding trust.

Security › Content Security Policy
2

Soft 404: server returns HTTP 200 for non-existent pages

Accessibility issues exclude users with disabilities — up to 15% of your potential audience.

Accessibility › 404 Error Page
3

69 third-party resources (100% of weight)

Performance issues directly impact user engagement and conversion rates.

Performance › Page Weight Inventory
4

Cookie '__cf_bm' has no SameSite attribute

Security gaps expose your site and users to attacks, eroding trust.

Security › Cookie Security
5

Cookie 'ct0' is missing the HttpOnly flag

Security gaps expose your site and users to attacks, eroding trust.

Security › Cookie Security
View fix priority matrix

Fix Priority Matrix

5 findings

Quick Wins

3

High impact, low effort — start here.

Strategic

2

High impact, requires investment.

Easy Improvements

0

Small gains, minimal effort.

Nothing in this quadrant — good news.

Deprioritize

0

Low impact, high effort — do last.

Nothing in this quadrant — good news.

← Low effort High effort →
BeaverCheck badge
Embed this badge
[![BeaverCheck](https://beavercheck.com/badge?url=https%3A%2F%2Ftwitter.com)](https://beavercheck.com/results/18c3e462-2a2b-4482-ac8a-b18244aaaaad)
<a href="https://beavercheck.com/results/18c3e462-2a2b-4482-ac8a-b18244aaaaad"><img src="https://beavercheck.com/badge?url=https%3A%2F%2Ftwitter.com" alt="BeaverCheck Score"></a>
https://beavercheck.com/badge?url=https%3A%2F%2Ftwitter.com

This badge auto-updates with your latest scan result.

What fixing these means

Your site performs reasonably well, but a few targeted fixes could meaningfully improve results. Your LCP of 13.3s exceeds Google's 2.5s 'Good' threshold and the 1 performance issue below directly contributes to it. Addressing the critical issues below would have the most immediate impact on your user trust.

3 security gaps detected — browsers may warn visitors about your site.
1 accessibility issue excludes users who rely on assistive technology.
Your LCP is 13.3s — fixing the 1 performance critical could bring it under Google's 2.5s 'Good' threshold.

Conversion Barriers

2 critical 6 warning

8 barrier(s) likely increasing bounce by ~30%.

Speed (2)

Page takes 13.3s to load

+12% bounce

Users abandon at ~3s — you're 10.8s over the 2.5s threshold

Fix: Optimize render-blocking resources, preload the hero image, and compress images

High main-thread blocking time

+2% bounce

Page is non-interactive for 238ms after first paint

Fix: Defer third-party scripts and split large bundles

Trust (1)

No Content-Security-Policy header

+1% bounce

Higher XSS blast radius — one compromised script can exfiltrate the checkout form

Fix: Ship a reporting-only CSP first, then enforce once violations are clean

Usability (1)

Viewport disables user zoom

+2% bounce

Visitors with low vision can't read the page — and some jurisdictions treat this as a legal risk

Fix: Remove user-scalable=no; drop maximum-scale if it's below 2

Content (2)

No structured data

+2% bounce

No rich-result eligibility in Google — lower SERP CTR vs competitors with stars and prices

Fix: Add JSON-LD for your page type (Product, Article, FAQPage, LocalBusiness, …)

Thin content

+3% bounce

Under 300 words — visitors bounce looking for substance, search engines rank competitors first

Fix: Add a substantive FAQ, product detail, or case-study section

Navigation (2)

No skip-to-content link

+1% bounce

Keyboard and screen-reader users must tab through the entire header on every page

Fix: Add a visible-on-focus <a href="#main">Skip to content</a> as the first focusable element

5 broken link(s) on the page

+5% bounce

Clicks land on 404s — trust drops and the session often ends

Fix: Fix or remove the broken destinations surfaced on the Content tab

Preliminary CRO audit — each barrier links to the tab with detailed analysis.

Return on Investment

€425 investment → €0.39/month returns + EUR 120,500,000 risk avoided

Payback period: > 2 years First-year ROI: -99%

Investment

€425

5h · 5 findings

Monthly returns

€0.39 /mo

~€4.69 / year

  • Bandwidth savings €0.39

Regulatory risk avoided

EUR 120,500,000

if kept compliant

  • ePrivacy Directive EUR 100,000,000
  • GDPR EUR 20,000,000
  • EAA EUR 500,000

€128 — in quick wins — start here for the fastest payback

Figures combine localized regulatory fine ceilings, search/conversion value priced against local CPC, and bandwidth waste estimates. Results depend on implementation quality and audience composition. Not legal or financial advice.

Full methodology & sources

Estimated Remediation Cost

€425

5.0 developer hours at €85/hr

Based on European Union rates (€85/hr)

Quick wins
€128 3 fixes in ~90 minutes

Start here for the best return on investment

Cost by category

Cost by effort level

Adjust assumptions
/hr

Rates reflect fully-loaded developer cost including overhead

How developer rates are sourced

What Inaction Is Costing You

€10,041,667 / month at risk

~€120,500,005 / year if left unfixed

Compliance Risk

€120,500,000

ePrivacy DirectiveGDPREAA
  • 2 tracking cookie(s) set before consent interaction
    GDPR: EUR 5,000 – EUR 10,000,000
  • 2 tracking cookie(s) set before consent interaction
    GDPR: EUR 10,000 – EUR 20,000,000
  • 2 tracking cookie(s) set before consent interaction
    ePrivacy Directive: EUR 5,000 – EUR 100,000,000

+2 more

Bandwidth Waste

€0.39 /mo

5281.0 MB/mo × 0.074 EUR/GB

  • Optimize transfer: save ~528 KB per page load
    Saves €0.39/mo

Compliance figures represent the statutory maximum fine for the most severe triggered category, capped per regulation — not the sum of per-finding penalties. Based on published regulatory fine ranges. This is not legal advice.

Compliance methodology · SEO assumptions · Bandwidth model

Your performance is already good — improvements may show diminishing returns

Unique monthly visitors from your analytics

Purchases, signups, or key actions

Optional — for revenue estimation

additional conversions/month

more engaged visitors from reduced bounce

potential monthly revenue
Current bounce (est.)
After fixes (est.)
Estimated bounce reduction

Fix 2 critical issues to capture this value

How this is calculated

Based on Google/Deloitte research ("Milliseconds Make Millions") showing a ~7% bounce rate increase per additional second of LCP above the 2.5s "Good" threshold.

Your site's LCP: → estimated after fixes.

These are estimates based on industry research — actual results vary

Bounce-rate model & assumptions

Your data stays in your browser — nothing is sent to our servers

Was this report useful?

Thanks for your feedback!

We'll use a cached audit if available, or offer to scan.

Checking for existing audit...

Lighthouse Scores

Industry-standard audits powered by Google Lighthouse.

52
Performance Overall performance score (0–100) based on Core Web Vitals and other metrics. 90+ is good.
89
Accessibility Measures how accessible the page is for users with disabilities. Checks color contrast, ARIA labels, and semantic HTML.
96
Best Practices Checks for modern web development best practices including HTTPS, no console errors, and secure JavaScript.
100
SEO Measures basic SEO optimizations: meta tags, crawlability, link text, and mobile friendliness.

Core Web Vitals

Key metrics that affect user experience.

First Contentful Paint First Contentful Paint — how long until the browser renders the first piece of content. Under 1.8s is good.

9.51 s

Largest Contentful Paint Largest Contentful Paint — how long until the largest visible element loads. Under 2.5s is good.

13.31 s

Total Blocking Time Total Blocking Time — total time the main thread was blocked, preventing user input. Under 200ms is good.

238 ms

Cumulative Layout Shift Cumulative Layout Shift — measures visual stability. How much the page layout shifts during loading. Under 0.1 is good.

0.000

Speed Index Speed Index — how quickly content is visually displayed during load. Under 3.4s is good.

9.51 s

Time to Interactive Time to Interactive — how long until the page is fully interactive and responds to user input. Under 3.8s is good.

13.34 s

Detailed Report

Audit breakdown by category with detailed findings.

52

Performance

Insights

Remove large, duplicate JavaScript modules from bundles to reduce unnecessary bytes consumed by network activity.

Why this matters

Performance issues directly impact user engagement and conversion rates.

Polyfills and transforms enable older browsers to use new JavaScript features. However, many aren't necessary for modern browsers. Consider modifying your JavaScript build process to not transpile Baseline features, unless you know you must support older browsers. Learn why most sites can deploy ES6+ code without transpiling

Why this matters

Shipping ES5 transpiled code to modern browsers wastes bytes — every user with an evergreen browser pays for compatibility you don't need.

Learn more

Most users today run browsers that natively support ES6+, async/await, optional chaining, and the rest of modern JavaScript. Transpiling to ES5 'just in case' adds 20-40% to your bundle for no benefit. Configure your build to target a modern browserslist, or ship a differential bundle pair (modern + legacy) with the module/nomodule pattern.

Source: Google web.dev / Lighthouse

3rd party code can significantly impact load performance. Reduce and defer loading of 3rd party code to prioritize your page's content.

Why this matters

Performance issues directly impact user engagement and conversion rates.

Your first network request is the most important. Reduce its latency by avoiding redirects, ensuring a fast server response, and enabling text compression.

Why this matters

Performance issues directly impact user engagement and conversion rates.

Consider setting font-display to swap or optional to ensure text is consistently visible. swap can be further optimized to mitigate layout shifts with font metric overrides.

Why this matters

Performance issues directly impact user engagement and conversion rates.

Each subpart has specific improvement strategies. Ideally, most of the LCP time should be spent on loading the resources, not within delays.

Why this matters

Performance issues directly impact user engagement and conversion rates.

headings: [map[key:label label:Subpart valueType:text] map[key:duration label:Duration valueType:ms]]
items: [map[duration:365.05 label:Time to first byte subpart:timeToFirstByte] map[duration:2204.741 label:Element render delay subpart:elementRenderDelay]]
lhId: page-0-DIV
nodeLabel: X and its partners use cookies to provide you with a better, safer and faster s…
path: 1,HTML,1,BODY,1,DIV,0,DIV,0,DIV,0,DIV,0,DIV,0,DIV,0,DIV,0,DIV,0,DIV,0,DIV,0,DIV,1,DIV
selector: div.css-175oi2r > div.css-175oi2r > div.css-175oi2r > div.css-146c3p1
snippet: <div dir="ltr" class="css-146c3p1 r-bcqeeo r-1ttztb7 r-qvutc0 r-37j5jr r-n6v787 r-1cwl3u0 r-16db…" style="color: rgb(255, 255, 255);">

Avoid chaining critical requests by reducing the length of chains, reducing the download size of resources, or deferring the download of unnecessary resources to improve page load.

Why this matters

Performance issues directly impact user engagement and conversion rates.

More than 4 preconnect connections were found. These should be used sparingly and only to the most important origins.
description: [preconnect](https://developer.chrome.com/docs/lighthouse/performance/uses-rel-preconnect/) hints help the browser establish a connection earlier in the page load, saving time when the first request for that origin is made. The following are the origins that the page preconnected to.
title: Preconnected origins
description: Add [preconnect](https://developer.chrome.com/docs/lighthouse/performance/uses-rel-preconnect/) hints to your most important origins, but try to use no more than 4.
title: Preconnect candidates

A long cache lifetime can speed up repeat visits to your page. Learn more about caching.

Why this matters

Performance issues directly impact user engagement and conversion rates.

These insights are also available in the Chrome DevTools Performance Panel - record a trace to view more detailed information.

Redirects introduce additional delays before the page can be loaded. Learn how to avoid page redirects.

Why this matters

Performance issues directly impact user engagement and conversion rates.

Estimated savings: 920 ms
URLTime Spent
twitter.com/920 ms
x.com/0.0 ms

The maximum potential First Input Delay that your users could experience is the duration of the longest task. Learn more about the Maximum Potential First Input Delay metric.

Why this matters

Performance issues directly impact user engagement and conversion rates.

Time to Interactive is the amount of time it takes for the page to become fully interactive. Learn more about the Time to Interactive metric.

Why this matters

Performance issues directly impact user engagement and conversion rates.

TTI

Diagnostics

Reduce unused JavaScript and defer loading scripts until they are required to decrease bytes consumed by network activity. Learn how to reduce unused JavaScript.

Why this matters

Multi-megabyte JavaScript bundles delay every interactive feature on the page.

Learn more

This is the Lighthouse audit fired when too much JS is shipped relative to what executes. The fix isn't a config flag — it requires bundle analysis (webpack-bundle-analyzer, rollup-plugin-visualizer), splitting routes into chunks, lazy-loading off-screen components, and removing unused dependencies. Fundamentally different from minification: minifying reduces byte count, this reduces what's downloaded at all.

Source: Google web.dev / Lighthouse

Consider reducing the time spent parsing, compiling, and executing JS. You may find delivering smaller JS payloads helps with this. Learn how to reduce Javascript execution time.

Why this matters

Performance issues directly impact user engagement and conversion rates.

Consider reducing the time spent parsing, compiling and executing JS. You may find delivering smaller JS payloads helps with this. Learn how to minimize main-thread work

Why this matters

Performance issues directly impact user engagement and conversion rates.

CategoryTime Spent
Script Evaluation4.6 s
Other698 ms
Script Parsing & Compilation560 ms
Garbage Collection145 ms
Style & Layout114 ms
Parse HTML & CSS56 ms
Rendering19 ms

Many navigations are performed by going back to a previous page, or forwards again. The back/forward cache (bfcache) can speed up these return navigations. Learn more about the bfcache

Why this matters

Performance issues directly impact user engagement and conversion rates.

Failure reasonFailure type
Pages with cache-control:no-store header cannot enter back/forward cache.Actionable
Pages whose main resource has cache-control:no-store cannot enter back/forward cache.Not actionable
Back/forward cache is disabled because some JavaScript network request received resource with Cache-Control: no-store header.Not actionable
SharedWorkerWithNoActiveClientNot actionable

More information about the performance of your application. These numbers don't directly affect the Performance score.

Layout shift culprits
Optimize DOM size
Forced reflow
Improve image delivery
Modern HTTP
Render blocking requests
Optimize viewport for mobile
Minify CSS
Minify JavaScript
Reduce unused CSS
Avoids enormous network payloads Total size was 1,719 KiB
User Timing marks and measures 2 user timings
Avoid long main-thread tasks 12 long tasks found
Avoid non-composited animations 1 animated element found
Image elements have explicit `width` and `height`
Network Requests
Network Round Trip Times 30 ms
Server Backend Latencies 130 ms
Tasks
Diagnostics
Metrics
Screenshot Thumbnails
Final Screenshot
Script Treemap Data
Resources Summary
Initial server response time was short Root document took 140 ms
INP breakdown
LCP request discovery
Avoid large layout shifts
89

Accessibility

These checks highlight opportunities to improve the accessibility of your web app. Automatic detection can only detect a subset of issues and does not guarantee the accessibility of your web app, so manual testing is also encouraged.

Contrast

Low-contrast text is difficult or impossible for many users to read. Learn how to provide sufficient color contrast.

Why this matters

Performance issues directly impact user engagement and conversion rates.

Failing Elements
Terms of Service div.css-175oi2r > div.css-146c3p1 > a.css-1jxf684 > span.css-1jxf684
Cookie Use. div.css-175oi2r > div.css-146c3p1 > a.css-1jxf684 > span.css-1jxf684

These are opportunities to improve the legibility of your content.

Best practices

Disabling zooming is problematic for users with low vision who rely on screen magnification to properly see the contents of a web page. Learn more about the viewport meta tag.

Why this matters

Performance issues directly impact user engagement and conversion rates.

Failing Elements
head > meta head > meta

These items highlight common accessibility best practices.

Interactive controls are keyboard focusable
Interactive elements indicate their purpose and state
The page has a logical tab order
Visual order on the page follows DOM order
User focus is not accidentally trapped in a region
The user's focus is directed to new content added to the page
HTML5 landmark elements are used to improve navigation
Offscreen content is hidden from assistive technology
Custom controls have associated labels
Custom controls have ARIA roles
`[aria-*]` attributes match their roles
`[aria-hidden="true"]` is not present on the document `<body>`
`[role]`s have all required `[aria-*]` attributes
`[role]` values are valid
`[aria-*]` attributes have valid values
`[aria-*]` attributes are valid and not misspelled
Buttons have an accessible name
ARIA attributes are used as specified for the element's role
`[aria-hidden="true"]` elements do not contain focusable descendents
Elements use only permitted ARIA attributes
Document has a `<title>` element
`<html>` element has a `[lang]` attribute
`<html>` element has a valid value for its `[lang]` attribute
Links are distinguishable without relying on color.
Links have a discernible name
Touch targets have sufficient size and spacing.
Document has a main landmark.
Deprecated ARIA roles were not used
`[accesskey]` values are unique
`button`, `link`, and `menuitem` elements have accessible names
Elements with `role="dialog"` or `role="alertdialog"` have accessible names.
ARIA input fields have accessible names
ARIA `meter` elements have accessible names
ARIA `progressbar` elements have accessible names
Elements with an ARIA `[role]` that require children to contain a specific `[role]` have all required children.
`[role]`s are contained by their required parent element
Elements with the `role=text` attribute do not have focusable descendents.
ARIA toggle fields have accessible names
ARIA `tooltip` elements have accessible names
ARIA `treeitem` elements have accessible names
The page contains a heading, skip link, or landmark region
`<dl>`'s contain only properly-ordered `<dt>` and `<dd>` groups, `<script>`, `<template>` or `<div>` elements.
Definition list items are wrapped in `<dl>` elements
ARIA IDs are unique
No form fields have multiple labels
`<frame>` or `<iframe>` elements have a title
Heading elements appear in a sequentially-descending order
`<html>` element has an `[xml:lang]` attribute with the same base language as the `[lang]` attribute.
Image elements have `[alt]` attributes
Input buttons have discernible text.
`<input type="image">` elements have `[alt]` text
Form elements have associated labels
Lists contain only `<li>` elements and script supporting elements (`<script>` and `<template>`).
List items (`<li>`) are contained within `<ul>`, `<ol>` or `<menu>` parent elements
The document does not use `<meta http-equiv="refresh">`
`<object>` elements have alternate text
Select elements have associated label elements.
Skip links are focusable.
No element has a `[tabindex]` value greater than 0
Cells in a `<table>` element that use the `[headers]` attribute refer to table cells within the same table.
`<th>` elements and elements with `[role="columnheader"/"rowheader"]` have data cells they describe.
`[lang]` attributes have a valid value
`<video>` elements contain a `<track>` element with `[kind="captions"]`
Tables have different content in the summary attribute and `<caption>`.
All heading elements contain content.
Uses ARIA roles only on compatible elements
Image elements do not have `[alt]` attributes that are redundant text.
Identical links have the same purpose.
Elements with visible text labels have matching accessible names.
Tables use `<caption>` instead of cells with the `[colspan]` attribute to indicate a caption.
`<td>` elements in a large `<table>` have one or more table headers.
96

Best Practices

General

Errors logged to the console indicate unresolved problems. They can come from network request failures and other browser concerns. Learn more about this errors in console diagnostic audit

Why this matters

Performance issues directly impact user engagement and conversion rates.

SourceDescription
Not signed in with the identity provider.
Uses HTTPS
Avoids deprecated APIs
Avoids third-party cookies
Allows users to paste into input fields
Avoids requesting the geolocation permission on page load
Avoids requesting the notification permission on page load
Displays images with correct aspect ratio
Serves images with appropriate resolution
Page has the HTML doctype
Properly defines charset
No issues in the `Issues` panel in Chrome Devtools
Ensure CSP is effective against XSS attacks
Use a strong HSTS policy
Mitigate DOM-based XSS with Trusted Types
Detected JavaScript libraries
Page has valid source maps
Redirects HTTP traffic to HTTPS
Ensure proper origin isolation with COOP
Mitigate clickjacking with XFO or CSP
100

SEO

These checks ensure that your page is following basic search engine optimization advice. There are many additional factors Lighthouse does not score here that may affect your search ranking, including performance on Core Web Vitals. Learn more about Google Search Essentials.

Structured data is valid
Page isn’t blocked from indexing
Document has a `<title>` element
Document has a meta description
Page has successful HTTP status code
Links have descriptive text
Links are crawlable
robots.txt is valid
Document has a valid `hreflang`
Image elements have `[alt]` attributes
Document has a valid `rel=canonical`

Lighthouse Scores

Industry-standard audits powered by Google Lighthouse. — Desktop

47
Performance Overall performance score (0–100) based on Core Web Vitals and other metrics. 90+ is good.
89
Accessibility Measures how accessible the page is for users with disabilities. Checks color contrast, ARIA labels, and semantic HTML.
96
Best Practices Checks for modern web development best practices including HTTPS, no console errors, and secure JavaScript.
100
SEO Measures basic SEO optimizations: meta tags, crawlability, link text, and mobile friendliness.

Core Web Vitals

Key metrics that affect user experience. — Desktop

First Contentful Paint First Contentful Paint — how long until the browser renders the first piece of content. Under 1.8s is good.

1.19 s

Largest Contentful Paint Largest Contentful Paint — how long until the largest visible element loads. Under 2.5s is good.

2.86 s

Total Blocking Time Total Blocking Time — total time the main thread was blocked, preventing user input. Under 200ms is good.

353 ms

Cumulative Layout Shift Cumulative Layout Shift — measures visual stability. How much the page layout shifts during loading. Under 0.1 is good.

0.299

Speed Index Speed Index — how quickly content is visually displayed during load. Under 3.4s is good.

2.27 s

Time to Interactive Time to Interactive — how long until the page is fully interactive and responds to user input. Under 3.8s is good.

2.86 s

Detailed Report

Audit breakdown by category with detailed findings.

47

Performance

Insights

Remove large, duplicate JavaScript modules from bundles to reduce unnecessary bytes consumed by network activity.

Why this matters

Performance issues directly impact user engagement and conversion rates.

Polyfills and transforms enable older browsers to use new JavaScript features. However, many aren't necessary for modern browsers. Consider modifying your JavaScript build process to not transpile Baseline features, unless you know you must support older browsers. Learn why most sites can deploy ES6+ code without transpiling

Why this matters

Shipping ES5 transpiled code to modern browsers wastes bytes — every user with an evergreen browser pays for compatibility you don't need.

Learn more

Most users today run browsers that natively support ES6+, async/await, optional chaining, and the rest of modern JavaScript. Transpiling to ES5 'just in case' adds 20-40% to your bundle for no benefit. Configure your build to target a modern browserslist, or ship a differential bundle pair (modern + legacy) with the module/nomodule pattern.

Source: Google web.dev / Lighthouse

3rd party code can significantly impact load performance. Reduce and defer loading of 3rd party code to prioritize your page's content.

Why this matters

Performance issues directly impact user engagement and conversion rates.

Layout shifts occur when elements move absent any user interaction. Investigate the causes of layout shifts, such as elements being added, removed, or their fonts changing as the page loads.

Why this matters

Performance issues directly impact user engagement and conversion rates.

headings: [map[key:node label:Element subItemsHeading:map[key:extra] valueType:node] map[granularity:0.001 key:score label:Layout shift score subItemsHeading:map[key:cause valueType:text] valueType:numeric]]
items: [map[node:map[type:text value:Total] score:0.298788] map[node:map[boundingRect:map[bottom:976 height:976 left:0 right:1350 top:0 width:1350] lhId:page-1-MAIN nodeLabel:Happening now Join today. Sign up with Google Sign up with Apple OR Create acco… path:1,HTML,1,BODY,1,DIV,0,DIV,0,DIV,0,DIV,1,MAIN selector:div.css-175oi2r > div.css-175oi2r > div.css-175oi2r > main.css-175oi2r snippet:<main role="main" class="css-175oi2r r-16y2uox r-1wbh5a2"> type:node] score:0.235185] map[node:map[boundingRect:map[bottom:590 height:436 left:0 right:734 top:154 width:734] lhId:page-3-svg nodeLabel:div.css-175oi2r > div.css-175oi2r > div.css-175oi2r > svg.r-4qtqp9 path:1,HTML,1,BODY,1,DIV,0,DIV,0,DIV,0,DIV,1,MAIN,0,DIV,0,DIV,0,DIV,1,DIV,0,DIV,0,svg selector:div.css-175oi2r > div.css-175oi2r > div.css-175oi2r > svg.r-4qtqp9 snippet:<svg viewBox="0 0 24 24" aria-hidden="true" class="r-4qtqp9 r-yyyyoo r-dnmrzs r-bnwqim r-lrvibr r-m6rgpd r-18jsvk2 r-rxcuwo r…"> type:node] score:0.030032] map[node:map[boundingRect:map[bottom:590 height:436 left:0 right:734 top:154 width:734] lhId:page-3-svg nodeLabel:div.css-175oi2r > div.css-175oi2r > div.css-175oi2r > svg.r-4qtqp9 path:1,HTML,1,BODY,1,DIV,0,DIV,0,DIV,0,DIV,1,MAIN,0,DIV,0,DIV,0,DIV,1,DIV,0,DIV,0,svg selector:div.css-175oi2r > div.css-175oi2r > div.css-175oi2r > svg.r-4qtqp9 snippet:<svg viewBox="0 0 24 24" aria-hidden="true" class="r-4qtqp9 r-yyyyoo r-dnmrzs r-bnwqim r-lrvibr r-m6rgpd r-18jsvk2 r-rxcuwo r…"> type:node] score:0.017921] map[node:map[boundingRect:map[bottom:590 height:436 left:0 right:734 top:154 width:734] lhId:page-3-svg nodeLabel:div.css-175oi2r > div.css-175oi2r > div.css-175oi2r > svg.r-4qtqp9 path:1,HTML,1,BODY,1,DIV,0,DIV,0,DIV,0,DIV,1,MAIN,0,DIV,0,DIV,0,DIV,1,DIV,0,DIV,0,svg selector:div.css-175oi2r > div.css-175oi2r > div.css-175oi2r > svg.r-4qtqp9 snippet:<svg viewBox="0 0 24 24" aria-hidden="true" class="r-4qtqp9 r-yyyyoo r-dnmrzs r-bnwqim r-lrvibr r-m6rgpd r-18jsvk2 r-rxcuwo r…"> type:node] score:0.01565]]

Your first network request is the most important. Reduce its latency by avoiding redirects, ensuring a fast server response, and enabling text compression.

Why this matters

Performance issues directly impact user engagement and conversion rates.

Consider setting font-display to swap or optional to ensure text is consistently visible. swap can be further optimized to mitigate layout shifts with font metric overrides.

Why this matters

Performance issues directly impact user engagement and conversion rates.

Avoid chaining critical requests by reducing the length of chains, reducing the download size of resources, or deferring the download of unnecessary resources to improve page load.

Why this matters

Performance issues directly impact user engagement and conversion rates.

More than 4 preconnect connections were found. These should be used sparingly and only to the most important origins.
description: [preconnect](https://developer.chrome.com/docs/lighthouse/performance/uses-rel-preconnect/) hints help the browser establish a connection earlier in the page load, saving time when the first request for that origin is made. The following are the origins that the page preconnected to.
title: Preconnected origins
description: Add [preconnect](https://developer.chrome.com/docs/lighthouse/performance/uses-rel-preconnect/) hints to your most important origins, but try to use no more than 4.
title: Preconnect candidates
value: No additional origins are good candidates for preconnecting

A long cache lifetime can speed up repeat visits to your page. Learn more about caching.

Why this matters

Performance issues directly impact user engagement and conversion rates.

These insights are also available in the Chrome DevTools Performance Panel - record a trace to view more detailed information.

Redirects introduce additional delays before the page can be loaded. Learn how to avoid page redirects.

Why this matters

Performance issues directly impact user engagement and conversion rates.

Estimated savings: 368 ms
URLTime Spent
twitter.com/368 ms
x.com/0.0 ms

These are the largest layout shifts observed on the page. Each table item represents a single layout shift, and shows the element that shifted the most. Below each item are possible root causes that led to the layout shift. Some of these layout shifts may not be included in the CLS metric value due to windowing. Learn how to improve CLS

Why this matters

Performance issues directly impact user engagement and conversion rates.

ElementLayout shift score
Happening now Join today. Sign up with Google Sign up with Apple OR Create acco… div.css-175oi2r > div.css-175oi2r > div.css-175oi2r > main.css-175oi2r
0.235
div.css-175oi2r > div.css-175oi2r > div.css-175oi2r > svg.r-4qtqp9 div.css-175oi2r > div.css-175oi2r > div.css-175oi2r > svg.r-4qtqp9
0.030
div.css-175oi2r > div.css-175oi2r > div.css-175oi2r > svg.r-4qtqp9 div.css-175oi2r > div.css-175oi2r > div.css-175oi2r > svg.r-4qtqp9
0.018
div.css-175oi2r > div.css-175oi2r > div.css-175oi2r > svg.r-4qtqp9 div.css-175oi2r > div.css-175oi2r > div.css-175oi2r > svg.r-4qtqp9
0.016

The maximum potential First Input Delay that your users could experience is the duration of the longest task. Learn more about the Maximum Potential First Input Delay metric.

Why this matters

Performance issues directly impact user engagement and conversion rates.

Time to Interactive is the amount of time it takes for the page to become fully interactive. Learn more about the Time to Interactive metric.

Why this matters

Performance issues directly impact user engagement and conversion rates.

TTI

Diagnostics

Reduce unused JavaScript and defer loading scripts until they are required to decrease bytes consumed by network activity. Learn how to reduce unused JavaScript.

Why this matters

Multi-megabyte JavaScript bundles delay every interactive feature on the page.

Learn more

This is the Lighthouse audit fired when too much JS is shipped relative to what executes. The fix isn't a config flag — it requires bundle analysis (webpack-bundle-analyzer, rollup-plugin-visualizer), splitting routes into chunks, lazy-loading off-screen components, and removing unused dependencies. Fundamentally different from minification: minifying reduces byte count, this reduces what's downloaded at all.

Source: Google web.dev / Lighthouse

Many navigations are performed by going back to a previous page, or forwards again. The back/forward cache (bfcache) can speed up these return navigations. Learn more about the bfcache

Why this matters

Performance issues directly impact user engagement and conversion rates.

Failure reasonFailure type
Pages with cache-control:no-store header cannot enter back/forward cache.Actionable
Pages whose main resource has cache-control:no-store cannot enter back/forward cache.Not actionable
Back/forward cache is disabled because some JavaScript network request received resource with Cache-Control: no-store header.Not actionable
SharedWorkerWithNoActiveClientNot actionable

More information about the performance of your application. These numbers don't directly affect the Performance score.

Optimize DOM size
Forced reflow
Improve image delivery
LCP breakdown
Modern HTTP
Render blocking requests
Optimize viewport for mobile
Minify CSS
Minify JavaScript
Reduce unused CSS
Avoids enormous network payloads Total size was 1,770 KiB
User Timing marks and measures 2 user timings
JavaScript execution time 1.2 s
Minimizes main-thread work 1.7 s
Avoid long main-thread tasks 4 long tasks found
Avoid non-composited animations 1 animated element found
Image elements have explicit `width` and `height`
Network Requests
Network Round Trip Times 30 ms
Server Backend Latencies 130 ms
Tasks
Diagnostics
Metrics
Screenshot Thumbnails
Final Screenshot
Script Treemap Data
Resources Summary
Initial server response time was short Root document took 140 ms
INP breakdown
LCP request discovery
89

Accessibility

These checks highlight opportunities to improve the accessibility of your web app. Automatic detection can only detect a subset of issues and does not guarantee the accessibility of your web app, so manual testing is also encouraged.

Contrast

Low-contrast text is difficult or impossible for many users to read. Learn how to provide sufficient color contrast.

Why this matters

Performance issues directly impact user engagement and conversion rates.

Failing Elements
Terms of Service div.css-175oi2r > div.css-146c3p1 > a.css-1jxf684 > span.css-1jxf684
Cookie Use. div.css-175oi2r > div.css-146c3p1 > a.css-1jxf684 > span.css-1jxf684

These are opportunities to improve the legibility of your content.

Best practices

Disabling zooming is problematic for users with low vision who rely on screen magnification to properly see the contents of a web page. Learn more about the viewport meta tag.

Why this matters

Performance issues directly impact user engagement and conversion rates.

Failing Elements
head > meta head > meta

These items highlight common accessibility best practices.

Interactive controls are keyboard focusable
Interactive elements indicate their purpose and state
The page has a logical tab order
Visual order on the page follows DOM order
User focus is not accidentally trapped in a region
The user's focus is directed to new content added to the page
HTML5 landmark elements are used to improve navigation
Offscreen content is hidden from assistive technology
Custom controls have associated labels
Custom controls have ARIA roles
`[aria-*]` attributes match their roles
`[aria-hidden="true"]` is not present on the document `<body>`
`[role]`s have all required `[aria-*]` attributes
`[role]` values are valid
`[aria-*]` attributes have valid values
`[aria-*]` attributes are valid and not misspelled
Buttons have an accessible name
ARIA attributes are used as specified for the element's role
`[aria-hidden="true"]` elements do not contain focusable descendents
Elements use only permitted ARIA attributes
Document has a `<title>` element
`<html>` element has a `[lang]` attribute
`<html>` element has a valid value for its `[lang]` attribute
Links are distinguishable without relying on color.
Links have a discernible name
Touch targets have sufficient size and spacing.
Document has a main landmark.
Deprecated ARIA roles were not used
`[accesskey]` values are unique
`button`, `link`, and `menuitem` elements have accessible names
Elements with `role="dialog"` or `role="alertdialog"` have accessible names.
ARIA input fields have accessible names
ARIA `meter` elements have accessible names
ARIA `progressbar` elements have accessible names
Elements with an ARIA `[role]` that require children to contain a specific `[role]` have all required children.
`[role]`s are contained by their required parent element
Elements with the `role=text` attribute do not have focusable descendents.
ARIA toggle fields have accessible names
ARIA `tooltip` elements have accessible names
ARIA `treeitem` elements have accessible names
The page contains a heading, skip link, or landmark region
`<dl>`'s contain only properly-ordered `<dt>` and `<dd>` groups, `<script>`, `<template>` or `<div>` elements.
Definition list items are wrapped in `<dl>` elements
ARIA IDs are unique
No form fields have multiple labels
`<frame>` or `<iframe>` elements have a title
Heading elements appear in a sequentially-descending order
`<html>` element has an `[xml:lang]` attribute with the same base language as the `[lang]` attribute.
Image elements have `[alt]` attributes
Input buttons have discernible text.
`<input type="image">` elements have `[alt]` text
Form elements have associated labels
Lists contain only `<li>` elements and script supporting elements (`<script>` and `<template>`).
List items (`<li>`) are contained within `<ul>`, `<ol>` or `<menu>` parent elements
The document does not use `<meta http-equiv="refresh">`
`<object>` elements have alternate text
Select elements have associated label elements.
Skip links are focusable.
No element has a `[tabindex]` value greater than 0
Cells in a `<table>` element that use the `[headers]` attribute refer to table cells within the same table.
`<th>` elements and elements with `[role="columnheader"/"rowheader"]` have data cells they describe.
`[lang]` attributes have a valid value
`<video>` elements contain a `<track>` element with `[kind="captions"]`
Tables have different content in the summary attribute and `<caption>`.
All heading elements contain content.
Uses ARIA roles only on compatible elements
Image elements do not have `[alt]` attributes that are redundant text.
Identical links have the same purpose.
Elements with visible text labels have matching accessible names.
Tables use `<caption>` instead of cells with the `[colspan]` attribute to indicate a caption.
`<td>` elements in a large `<table>` have one or more table headers.
96

Best Practices

General

Errors logged to the console indicate unresolved problems. They can come from network request failures and other browser concerns. Learn more about this errors in console diagnostic audit

Why this matters

Performance issues directly impact user engagement and conversion rates.

SourceDescription
Not signed in with the identity provider.
Uses HTTPS
Avoids deprecated APIs
Avoids third-party cookies
Allows users to paste into input fields
Avoids requesting the geolocation permission on page load
Avoids requesting the notification permission on page load
Displays images with correct aspect ratio
Serves images with appropriate resolution
Page has the HTML doctype
Properly defines charset
No issues in the `Issues` panel in Chrome Devtools
Ensure CSP is effective against XSS attacks
Use a strong HSTS policy
Mitigate DOM-based XSS with Trusted Types
Detected JavaScript libraries
Page has valid source maps
Redirects HTTP traffic to HTTPS
Ensure proper origin isolation with COOP
Mitigate clickjacking with XFO or CSP
100

SEO

These checks ensure that your page is following basic search engine optimization advice. There are many additional factors Lighthouse does not score here that may affect your search ranking, including performance on Core Web Vitals. Learn more about Google Search Essentials.

Structured data is valid
Page isn’t blocked from indexing
Document has a `<title>` element
Document has a meta description
Page has successful HTTP status code
Links have descriptive text
Links are crawlable
robots.txt is valid
Document has a valid `hreflang`
Image elements have `[alt]` attributes
Document has a valid `rel=canonical`

Send Feedback