United Stated · New York Completed: Apr 4, 2026 17:25 UTC
Mobile 375 × 812

Desktop 1440 × 900

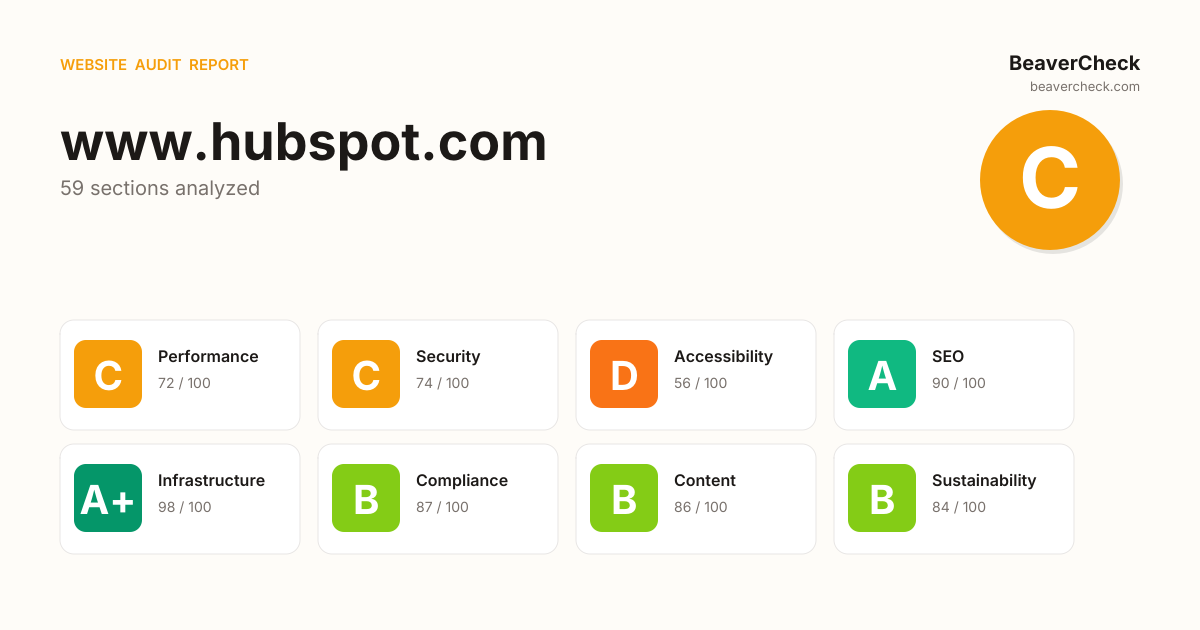
Score: 77 / 100
Based on 8 categories, 0 sections
The overall score is a weighted average of individual category scores. Categories with more impact on user experience and security carry more weight.
Weights reflect general web best practices. Individual needs may differ.
'unsafe-eval' found in script source
'unsafe-inline' found in script source
3 button(s) with no accessible text
5 image(s) missing alt attribute
229 HTTP requests — consider bundling or reducing
[](https://beavercheck.com/results/1918c58a-8bcc-40bb-afdd-d5754ed6c664)<a href="https://beavercheck.com/results/1918c58a-8bcc-40bb-afdd-d5754ed6c664"><img src="https://beavercheck.com/badge?url=https%3A%2F%2Fwww.hubspot.com" alt="BeaverCheck Score"></a>https://beavercheck.com/badge?url=https%3A%2F%2Fwww.hubspot.comThis badge auto-updates with your latest scan result.
Thanks for your feedback!
Industry-standard audits powered by Google Lighthouse.
Key metrics that affect user experience.
First Contentful Paint First Contentful Paint — how long until the browser renders the first piece of content. Under 1.8s is good.
3.33 s
Largest Contentful Paint Largest Contentful Paint — how long until the largest visible element loads. Under 2.5s is good.
8.17 s
Total Blocking Time Total Blocking Time — total time the main thread was blocked, preventing user input. Under 200ms is good.
2.84 s
Cumulative Layout Shift Cumulative Layout Shift — measures visual stability. How much the page layout shifts during loading. Under 0.1 is good.
0.000
Speed Index Speed Index — how quickly content is visually displayed during load. Under 3.4s is good.
6.61 s
Time to Interactive Time to Interactive — how long until the page is fully interactive and responds to user input. Under 3.8s is good.
22.11 s
Audit breakdown by category with detailed findings.
Remove large, duplicate JavaScript modules from bundles to reduce unnecessary bytes consumed by network activity.
Polyfills and transforms enable older browsers to use new JavaScript features. However, many aren't necessary for modern browsers. Consider modifying your JavaScript build process to not transpile Baseline features, unless you know you must support older browsers. Learn why most sites can deploy ES6+ code without transpiling
3rd party code can significantly impact load performance. Reduce and defer loading of 3rd party code to prioritize your page's content.
A long cache lifetime can speed up repeat visits to your page. Learn more about caching.
A forced reflow occurs when JavaScript queries geometric properties (such as offsetWidth) after styles have been invalidated by a change to the DOM state. This can result in poor performance. Learn more about forced reflows and possible mitigations.
Avoid chaining critical requests by reducing the length of chains, reducing the download size of resources, or deferring the download of unnecessary resources to improve page load.
Requests are blocking the page's initial render, which may delay LCP. Deferring or inlining can move these network requests out of the critical path.
Reducing the download time of images can improve the perceived load time of the page and LCP. Learn more about optimizing image size
| URL | Resource Size | Est Savings | |
|---|---|---|---|
Shows the products that make up the HubSpot customer platform, starting with Sm… li.cl-carousel-slide > div.wf-customer-platform__content-header-item > div.wf-customer-platform__carousel-image > img.csol-image | /hs-fs/hubfs/Customer Platform Graphic - Smart CRM1.5x (1... | 68.7 KiB | 31.8 KiB |
These insights are also available in the Chrome DevTools Performance Panel - record a trace to view more detailed information.
Time to Interactive is the amount of time it takes for the page to become fully interactive. Learn more about the Time to Interactive metric.
The maximum potential First Input Delay that your users could experience is the duration of the longest task. Learn more about the Maximum Potential First Input Delay metric.
Consider reducing the time spent parsing, compiling, and executing JS. You may find delivering smaller JS payloads helps with this. Learn how to reduce Javascript execution time.
Consider reducing the time spent parsing, compiling and executing JS. You may find delivering smaller JS payloads helps with this. Learn how to minimize main-thread work
| Category | Time Spent |
|---|---|
| Script Evaluation | 5.6 s |
| Other | 1.6 s |
| Style & Layout | 1.5 s |
| Script Parsing & Compilation | 883 ms |
| Parse HTML & CSS | 219 ms |
| Rendering | 161 ms |
| Garbage Collection | 109 ms |
Reduce unused rules from stylesheets and defer CSS not used for above-the-fold content to decrease bytes consumed by network activity. Learn how to reduce unused CSS.
| URL | Transfer Size | Est Savings |
|---|---|---|
| .a11y-contrast-toggle:focus-visible{outline-offset:2px;outline:2px solid var(--cl-color-focus-01)} … | 30.1 KiB | 20.4 KiB |
| /foundations-theming-base/static-1.3243/stylesheets/hubsp... | 14.4 KiB | 14.4 KiB |
Reduce unused JavaScript and defer loading scripts until they are required to decrease bytes consumed by network activity. Learn how to reduce unused JavaScript.
| URL | Transfer Size | Est Savings |
|---|---|---|
| /conversations-visitor-ui/static-1.28445/bundles/visitor.js | 340.5 KiB | 159.2 KiB |
| www.googletagmanager.com/gtag/js?id=G-LXTM6CQ0XK&cx=c>m=4e6411 | 172.4 KiB | 68.5 KiB |
| www.googletagmanager.com/gtag/js?id=G-X&cx=c>m=4e6411 | 135.1 KiB | 60.0 KiB |
| www.googletagmanager.com/gtag/destination?id=DC-11620487&cx=c>m=4e6411 | 129.9 KiB | 57.8 KiB |
| www.googletagmanager.com/gtm.js?id=GTM-N5LT88 | 208.9 KiB | 54.2 KiB |
| cdn.intellimize.co/snippet/117964275.js | 116.6 KiB | 39.9 KiB |
| tags.pw.adn.cloud/V9WA75/activation.js | 42.4 KiB | 26.9 KiB |
| static.hsappstatic.net/whisper-core/static-1.8755/whisper-core-entry.js | 35.6 KiB | 26.3 KiB |
More information about the performance of your application. These numbers don't directly affect the Performance score.
These checks highlight opportunities to improve the accessibility of your web app. Automatic detection can only detect a subset of issues and does not guarantee the accessibility of your web app, so manual testing is also encouraged.
Low-contrast text is difficult or impossible for many users to read. Learn how to provide sufficient color contrast.
| Failing Elements |
|---|
Get a demo
of HubSpot's premium software div.csol-section-wrapper > div.wf-page-header_content > div.wf-page-header_content-ctas > a.cl-button |
Get started free
with HubSpot's free tools div.csol-section-wrapper > div.wf-page-header_content > div.wf-page-header_content-ctas > a.cl-button |
Get a demo
of HubSpot's software div.wf-flexible-section-header > div.wf-flexible-section-header-bottom > div.cl-cta-group > a.cl-button |
Get started free
with HubSpot's free tools div.wf-flexible-section-header > div.wf-flexible-section-header-bottom > div.cl-cta-group > a.cl-button |
Get a demo
of HubSpot's premium software div.csol-section-wrapper > div.wf-elevated-cta__container > div.wf-elevated-cta__ctas > a.cl-button |
These are opportunities to improve the legibility of your content.
Deprecated APIs will eventually be removed from the browser. Learn more about deprecated APIs.
| Deprecation / Warning | Source |
|---|---|
| AttributionReporting | |
| SharedStorage | c.amazon-adsystem.com/aat/amzn.js line 1, col 7935 |
Errors logged to the console indicate unresolved problems. They can come from network request failures and other browser concerns. Learn more about this errors in console diagnostic audit
| Source | Description |
|---|---|
Attestation check for Shared Storage on https://ara.paa-reporting-advertising.amazon failed. | |
www.hubspot.com/ line 251, col 20 | TypeError: intellimize.getUserId is not a function
at appendWebflowOfflineEventParam (https://www.hubspot.com/:248:40)
at HTMLDocument.handleWebflowOfflineEventParam (https://www.hubspot.com/:266:15)
at Q.dispatch (https://www.hubspot.com/wt-assets/static-files/compliance/index.js:16:10344)
at https://www.hubspot.com/wt-assets/static-files/compliance/index.js:16:28692
at https://www.hubspot.com/wt-assets/static-files/compliance/index.js:16:8412
at Set.forEach (<anonymous>)
at nt.notify (https://www.hubspot.com/wt-assets/static-files/compliance/index.js:16:8396)
at https://www.hubspot.com/wt-assets/static-files/compliance/index.js:16:13604
at An.safeCallListener (https://js.hs-banner.com/v2/53/banner.js:76:58573)
at https://js.hs-banner.com/v2/53/banner.js:76:57844 |
Source maps translate minified code to the original source code. This helps developers debug in production. In addition, Lighthouse is able to provide further insights. Consider deploying source maps to take advantage of these benefits. Learn more about source maps.
These checks ensure that your page is following basic search engine optimization advice. There are many additional factors Lighthouse does not score here that may affect your search ranking, including performance on Core Web Vitals. Learn more about Google Search Essentials.
Descriptive link text helps search engines understand your content. Learn how to make links more accessible.
Format your HTML in a way that enables crawlers to better understand your app’s content.
Industry-standard audits powered by Google Lighthouse. — Desktop
Key metrics that affect user experience. — Desktop
First Contentful Paint First Contentful Paint — how long until the browser renders the first piece of content. Under 1.8s is good.
1.49 s
Largest Contentful Paint Largest Contentful Paint — how long until the largest visible element loads. Under 2.5s is good.
3.40 s
Total Blocking Time Total Blocking Time — total time the main thread was blocked, preventing user input. Under 200ms is good.
435 ms
Cumulative Layout Shift Cumulative Layout Shift — measures visual stability. How much the page layout shifts during loading. Under 0.1 is good.
0.048
Speed Index Speed Index — how quickly content is visually displayed during load. Under 3.4s is good.
2.68 s
Time to Interactive Time to Interactive — how long until the page is fully interactive and responds to user input. Under 3.8s is good.
5.64 s
Audit breakdown by category with detailed findings.
Remove large, duplicate JavaScript modules from bundles to reduce unnecessary bytes consumed by network activity.
Polyfills and transforms enable older browsers to use new JavaScript features. However, many aren't necessary for modern browsers. Consider modifying your JavaScript build process to not transpile Baseline features, unless you know you must support older browsers. Learn why most sites can deploy ES6+ code without transpiling
3rd party code can significantly impact load performance. Reduce and defer loading of 3rd party code to prioritize your page's content.
A long cache lifetime can speed up repeat visits to your page. Learn more about caching.
A forced reflow occurs when JavaScript queries geometric properties (such as offsetWidth) after styles have been invalidated by a change to the DOM state. This can result in poor performance. Learn more about forced reflows and possible mitigations.
Reducing the download time of images can improve the perceived load time of the page and LCP. Learn more about optimizing image size
| URL | Resource Size | Est Savings | |
|---|---|---|---|
section#homepage_page_header > div.csol-section-wrapper > picture.wf-page-header_background-image > img section#homepage_page_header > div.csol-section-wrapper > picture.wf-page-header_background-image > img | 53.fs1.hubspotusercontent-na1.net/hubfs/53/HS_Full_Bleed_1_optmised.webp | 95.3 KiB | 54.0 KiB |
Shows HubSpot's customer agent asking a HubSpot user how it can help today. ul.cl-carousel-train > li.cl-carousel-slide > div.cl-card > img.csol-image | /hs-fs/hubfs/customer-agent-en@2x.png?width=640&height=64... | 50.3 KiB | 41.2 KiB |
Shows HubSpot's prospecting agent introducing itself to a HubSpot user, letting… ul.cl-carousel-train > li.cl-carousel-slide > div.cl-card > img.csol-image | /hs-fs/hubfs/prospecting-agent-en@2x.png?width=640&height... | 36.1 KiB | 29.6 KiB |
Shows a HubSpot user requesting Data Agent to generate a smart property. ul.cl-carousel-train > li.cl-carousel-slide > div.cl-card > img.csol-image | /hs-fs/hubfs/data-hub-en@2x.png?width=640&height=640&name... | 28.0 KiB | 23.0 KiB |
Avoid chaining critical requests by reducing the length of chains, reducing the download size of resources, or deferring the download of unnecessary resources to improve page load.
Requests are blocking the page's initial render, which may delay LCP. Deferring or inlining can move these network requests out of the critical path.
These insights are also available in the Chrome DevTools Performance Panel - record a trace to view more detailed information.
Time to Interactive is the amount of time it takes for the page to become fully interactive. Learn more about the Time to Interactive metric.
The maximum potential First Input Delay that your users could experience is the duration of the longest task. Learn more about the Maximum Potential First Input Delay metric.
Reduce unused JavaScript and defer loading scripts until they are required to decrease bytes consumed by network activity. Learn how to reduce unused JavaScript.
| URL | Transfer Size | Est Savings |
|---|---|---|
| /conversations-visitor-ui/static-1.28445/bundles/visitor.js | 340.5 KiB | 149.0 KiB |
| www.googletagmanager.com/gtag/js?id=G-LXTM6CQ0XK&cx=c>m=4e6411 | 172.4 KiB | 68.8 KiB |
| www.googletagmanager.com/gtag/js?id=G-X&cx=c>m=4e6411 | 135.1 KiB | 58.8 KiB |
| www.googletagmanager.com/gtag/destination?id=DC-11620487&cx=c>m=4e6411 | 129.9 KiB | 57.8 KiB |
| www.googletagmanager.com/gtm.js?id=GTM-N5LT88 | 208.9 KiB | 54.2 KiB |
| cdn.intellimize.co/snippet/117964275.js | 116.6 KiB | 39.9 KiB |
| tags.pw.adn.cloud/V9WA75/activation.js | 42.4 KiB | 26.9 KiB |
| static.hsappstatic.net/whisper-core/static-1.8755/whisper-core-entry.js | 35.6 KiB | 26.3 KiB |
| script.hotjar.com/modules.6a0f3932cb1341a35c18.js | 56.1 KiB | 24.9 KiB |
Consider reducing the time spent parsing, compiling, and executing JS. You may find delivering smaller JS payloads helps with this. Learn how to reduce Javascript execution time.
Consider reducing the time spent parsing, compiling and executing JS. You may find delivering smaller JS payloads helps with this. Learn how to minimize main-thread work
| Category | Time Spent |
|---|---|
| Script Evaluation | 1.8 s |
| Other | 598 ms |
| Style & Layout | 546 ms |
| Script Parsing & Compilation | 239 ms |
| Rendering | 65 ms |
| Parse HTML & CSS | 55 ms |
| Garbage Collection | 45 ms |
Many navigations are performed by going back to a previous page, or forwards again. The back/forward cache (bfcache) can speed up these return navigations. Learn more about the bfcache
| Failure reason | Failure type |
|---|---|
| Pages with WebSocket cannot enter back/forward cache. | Pending browser support |
Reduce unused rules from stylesheets and defer CSS not used for above-the-fold content to decrease bytes consumed by network activity. Learn how to reduce unused CSS.
| URL | Transfer Size | Est Savings |
|---|---|---|
| /foundations-theming-base/static-1.3243/stylesheets/hubsp... | 14.4 KiB | 14.4 KiB |
| .a11y-contrast-toggle:focus-visible{outline-offset:2px;outline:2px solid var(--cl-color-focus-01)} … | 30.1 KiB | 12.1 KiB |
Large network payloads cost users real money and are highly correlated with long load times. Learn how to reduce payload sizes.
More information about the performance of your application. These numbers don't directly affect the Performance score.
These checks highlight opportunities to improve the accessibility of your web app. Automatic detection can only detect a subset of issues and does not guarantee the accessibility of your web app, so manual testing is also encouraged.
Low-contrast text is difficult or impossible for many users to read. Learn how to provide sufficient color contrast.
| Failing Elements |
|---|
Get a demo
of HubSpot's premium software div.global-nav-main-group > div.global-nav-main-group-cta > div.header-nav__ctas > a.cl-button |
Get started free
with HubSpot's free tools div.global-nav-main-group > div.global-nav-main-group-cta > div.header-nav__ctas > a.cl-button |
Get a demo
of HubSpot's premium software div.csol-section-wrapper > div.wf-page-header_content > div.wf-page-header_content-ctas > a.cl-button |
Get started free
with HubSpot's free tools div.csol-section-wrapper > div.wf-page-header_content > div.wf-page-header_content-ctas > a.cl-button |
Get a demo
of HubSpot's software div.wf-flexible-section-header > div.wf-flexible-section-header-bottom > div.cl-cta-group > a.cl-button |
Get started free
with HubSpot's free tools div.wf-flexible-section-header > div.wf-flexible-section-header-bottom > div.cl-cta-group > a.cl-button |
Get instant answers to custom questions about your customers. ul.cl-carousel-train > li.cl-carousel-slide > div.cl-card > p.wf-animated-carousel-slide-description |
Research, personalize, and execute sales outreach at scale — instantly. ul.cl-carousel-train > li.cl-carousel-slide > div.cl-card > p.wf-animated-carousel-slide-description |
Get a demo
of HubSpot's premium software div.csol-section-wrapper > div.wf-elevated-cta__container > div.wf-elevated-cta__ctas > a.cl-button |
These are opportunities to improve the legibility of your content.
Deprecated APIs will eventually be removed from the browser. Learn more about deprecated APIs.
| Deprecation / Warning | Source |
|---|---|
| AttributionReporting | |
| SharedStorage | c.amazon-adsystem.com/aat/amzn.js line 1, col 7935 |
Errors logged to the console indicate unresolved problems. They can come from network request failures and other browser concerns. Learn more about this errors in console diagnostic audit
| Source | Description |
|---|---|
Attestation check for Shared Storage on https://ara.paa-reporting-advertising.amazon failed. | |
www.hubspot.com/ line 251, col 20 | TypeError: intellimize.getUserId is not a function
at appendWebflowOfflineEventParam (https://www.hubspot.com/:248:40)
at HTMLDocument.handleWebflowOfflineEventParam (https://www.hubspot.com/:266:15)
at Q.dispatch (https://www.hubspot.com/wt-assets/static-files/compliance/index.js:16:10344)
at https://www.hubspot.com/wt-assets/static-files/compliance/index.js:16:28692
at https://www.hubspot.com/wt-assets/static-files/compliance/index.js:16:8412
at Set.forEach (<anonymous>)
at nt.notify (https://www.hubspot.com/wt-assets/static-files/compliance/index.js:16:8396)
at https://www.hubspot.com/wt-assets/static-files/compliance/index.js:16:13604
at An.safeCallListener (https://js.hs-banner.com/v2/53/banner.js:76:58573)
at https://js.hs-banner.com/v2/53/banner.js:76:57844 |
Source maps translate minified code to the original source code. This helps developers debug in production. In addition, Lighthouse is able to provide further insights. Consider deploying source maps to take advantage of these benefits. Learn more about source maps.
These checks ensure that your page is following basic search engine optimization advice. There are many additional factors Lighthouse does not score here that may affect your search ranking, including performance on Core Web Vitals. Learn more about Google Search Essentials.
Descriptive link text helps search engines understand your content. Learn how to make links more accessible.
Format your HTML in a way that enables crawlers to better understand your app’s content.
Send Feedback