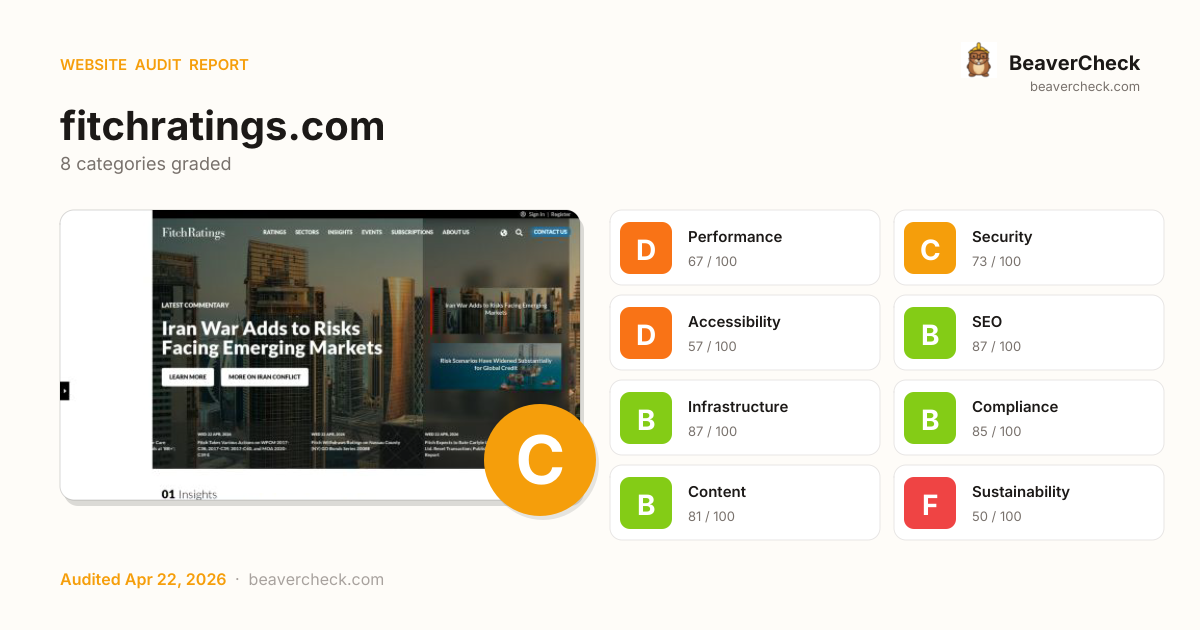
Mobile 375 × 812

Desktop 1440 × 900

Score: 73 / 100
Based on 8 categories, 0 sections
Room to improve — your 44.8s load time is above Google's 2.5s 'Good' threshold.
Good foundation, but a few gaps could be exploited.
Several issues make your site difficult for assistive technology users.
Well-optimized for search — your content is discoverable.
Solid infrastructure — fast server responses across the board.
Strong compliance posture across regulations.
Good content signals with minor gaps.
Heavier than average — reducing page weight saves energy and bandwidth.
The overall score is a weighted average of individual category scores. Categories with more impact on user experience and security carry more weight.
Weights reflect general web best practices. Individual needs may differ.
'unsafe-eval' found in script source
Security gaps expose your site and users to attacks, eroding trust.
'unsafe-inline' found in script source
Security gaps expose your site and users to attacks, eroding trust.
Page weighs 18.5 MB (14.3 MB transferred)
Performance issues directly impact user engagement and conversion rates.
No H1 heading found
Accessibility issues exclude users with disabilities — up to 15% of your potential audience.
Soft 404: server returns HTTP 200 for non-existent pages
Accessibility issues exclude users with disabilities — up to 15% of your potential audience.
High impact, low effort — start here.
High impact, requires investment.
Small gains, minimal effort.
Nothing in this quadrant — good news.
Low impact, high effort — do last.
Nothing in this quadrant — good news.
[](https://beavercheck.com/results/1bf08f8c-e4a6-4576-8119-1d358b928aae)<a href="https://beavercheck.com/results/1bf08f8c-e4a6-4576-8119-1d358b928aae"><img src="https://beavercheck.com/badge?url=https%3A%2F%2Ffitchratings.com" alt="BeaverCheck Score"></a>https://beavercheck.com/badge?url=https%3A%2F%2Ffitchratings.comThis badge auto-updates with your latest scan result.
Your site performs reasonably well, but a few targeted fixes could meaningfully improve results. Your LCP of 44.8s exceeds Google's 2.5s 'Good' threshold and the 1 performance issue below directly contributes to it. Accessibility issues exclude users who rely on assistive technology — an estimated 15% of your potential audience. Addressing the critical issues below would have the most immediate impact on your user trust.
7 barrier(s) likely increasing bounce by ~33%.
Page takes 44.8s to load
+12% bounceUsers abandon at ~3s — you're 42.3s over the 2.5s threshold
Fix: Optimize render-blocking resources, preload the hero image, and compress images
Page feels frozen for 2.2s
+5% bounceClicks on the primary CTA are ignored while JavaScript runs
Fix: Break up long tasks; defer non-critical JavaScript to post-hydration
No Content-Security-Policy header
+1% bounceHigher XSS blast radius — one compromised script can exfiltrate the checkout form
Fix: Ship a reporting-only CSP first, then enforce once violations are clean
Severe layout shift during page load
+6% bounceUsers mis-click when content jumps — converting intent into frustration
Fix: Reserve space for images, ads, and embeds with explicit width/height
No structured data
+2% bounceNo rich-result eligibility in Google — lower SERP CTR vs competitors with stars and prices
Fix: Add JSON-LD for your page type (Product, Article, FAQPage, LocalBusiness, …)
Content is hard to read
+2% bounceGraduate-level reading difficulty — limits the addressable audience for product or blog pages
Fix: Shorten sentences; replace jargon with plain language; target Flesch ease ≥60
6 broken link(s) on the page
+5% bounceClicks land on 404s — trust drops and the session often ends
Fix: Fix or remove the broken destinations surfaced on the Content tab
Preliminary CRO audit — each barrier links to the tab with detailed analysis.
€510 investment → €3.34/month returns + EUR 20,500,000 risk avoided
€510
6h · 5 findings
€3.34 /mo
~€40 / year
EUR 20,500,000
if kept compliant
€85 — in quick wins — start here for the fastest payback
Figures combine localized regulatory fine ceilings, search/conversion value priced against local CPC, and bandwidth waste estimates. Results depend on implementation quality and audience composition. Not legal or financial advice.
6.0 developer hours at €85/hr
Based on European Union rates (€85/hr)
Start here for the best return on investment
€1,708,337 / month at risk
~€20,500,040 / year if left unfixed
€20,500,000
+2 more
€3.34 /mo
45104.7 MB/mo × 0.074 EUR/GB
Compliance figures represent the statutory maximum fine for the most severe triggered category, capped per regulation — not the sum of per-finding penalties. Based on published regulatory fine ranges. This is not legal advice.
Unique monthly visitors from your analytics
Purchases, signups, or key actions
Optional — for revenue estimation
more engaged visitors from reduced bounce
Fix 5 critical issues to capture this value
Based on Google/Deloitte research ("Milliseconds Make Millions") showing a ~7% bounce rate increase per additional second of LCP above the 2.5s "Good" threshold.
Your site's LCP: → estimated after fixes.
These are estimates based on industry research — actual results vary
Your data stays in your browser — nothing is sent to our servers
Thanks for your feedback!
We'll use a cached audit if available, or offer to scan.
Industry-standard audits powered by Google Lighthouse.
Key metrics that affect user experience.
First Contentful Paint First Contentful Paint — how long until the browser renders the first piece of content. Under 1.8s is good.
9.45 s
Largest Contentful Paint Largest Contentful Paint — how long until the largest visible element loads. Under 2.5s is good.
44.80 s
Total Blocking Time Total Blocking Time — total time the main thread was blocked, preventing user input. Under 200ms is good.
2.23 s
Cumulative Layout Shift Cumulative Layout Shift — measures visual stability. How much the page layout shifts during loading. Under 0.1 is good.
0.529
Speed Index Speed Index — how quickly content is visually displayed during load. Under 3.4s is good.
25.83 s
Time to Interactive Time to Interactive — how long until the page is fully interactive and responds to user input. Under 3.8s is good.
52.65 s
Audit breakdown by category with detailed findings.
Remove large, duplicate JavaScript modules from bundles to reduce unnecessary bytes consumed by network activity.
Performance issues directly impact user engagement and conversion rates.
Polyfills and transforms enable older browsers to use new JavaScript features. However, many aren't necessary for modern browsers. Consider modifying your JavaScript build process to not transpile Baseline features, unless you know you must support older browsers. Learn why most sites can deploy ES6+ code without transpiling
Shipping ES5 transpiled code to modern browsers wastes bytes — every user with an evergreen browser pays for compatibility you don't need.
Most users today run browsers that natively support ES6+, async/await, optional chaining, and the rest of modern JavaScript. Transpiling to ES5 'just in case' adds 20-40% to your bundle for no benefit. Configure your build to target a modern browserslist, or ship a differential bundle pair (modern + legacy) with the module/nomodule pattern.
Source: Google web.dev / Lighthouse
3rd party code can significantly impact load performance. Reduce and defer loading of 3rd party code to prioritize your page's content.
Performance issues directly impact user engagement and conversion rates.
A long cache lifetime can speed up repeat visits to your page. Learn more about caching.
Performance issues directly impact user engagement and conversion rates.
| Request | Cache TTL | Transfer Size |
|---|---|---|
| cdn.ketchjs.com/ketchtag/stable/v2.12/ketch-sdk.js | 1200.0 s | 259.2 KiB |
| players.brightcove.net/1301119679001/ryVPzahIb_default/index.min.js | 300.0 s | 226.5 KiB |
| assets.adobedtm.com/7582667546ef/8a359a5930a6/launch-37a059c71c4d.min.js | 3600.0 s | 69.1 KiB |
| assets.map.brightcove.com/plugin/dist/videojs-bc-map-core.min.js?c=1776894596648 | 0.0 ms | 23.6 KiB |
| global.ketchcdn.com/web/v3/config/thefitchgroup/fitch_ratings/boot.js | 1200.0 s | 4.8 KiB |
| munchkin.marketo.net/munchkin.js | 0.0 ms | 1.2 KiB |
Layout shifts occur when elements move absent any user interaction. Investigate the causes of layout shifts, such as elements being added, removed, or their fonts changing as the page loads.
Performance issues directly impact user engagement and conversion rates.
Your first network request is the most important. Reduce its latency by avoiding redirects, ensuring a fast server response, and enabling text compression.
Performance issues directly impact user engagement and conversion rates.
Consider setting font-display to swap or optional to ensure text is consistently visible. swap can be further optimized to mitigate layout shifts with font metric overrides.
Performance issues directly impact user engagement and conversion rates.
Each subpart has specific improvement strategies. Ideally, most of the LCP time should be spent on loading the resources, not within delays.
Performance issues directly impact user engagement and conversion rates.
Optimize LCP by making the LCP image discoverable from the HTML immediately, and avoiding lazy-loading
Performance issues directly impact user engagement and conversion rates.
Avoid chaining critical requests by reducing the length of chains, reducing the download size of resources, or deferring the download of unnecessary resources to improve page load.
Performance issues directly impact user engagement and conversion rates.
Requests are blocking the page's initial render, which may delay LCP. Deferring or inlining can move these network requests out of the critical path.
Performance issues directly impact user engagement and conversion rates.
| URL | Transfer Size | Duration |
|---|---|---|
| global-assets.fitch.group/npm/react-dom@18.3.1/umd/react-dom.production.min.js | 42.9 KiB | 453 ms |
| global-assets.fitch.group/npm/react@18.3.1/umd/react.production.min.js | 4.7 KiB | 151 ms |
| players.brightcove.net/1301119679001/ryVPzahIb_default/index.min.js | 226.5 KiB | 2.5 s |
| global-assets.fitch.group/npm/systemjs@6.8.3/dist/system.min.js | 4.8 KiB | 1.0 s |
Reducing the download time of images can improve the perceived load time of the page and LCP. Learn more about optimizing image size
Performance issues directly impact user engagement and conversion rates.
| URL | Resource Size | Est Savings | |
|---|---|---|---|
FITCH RATINGS - EMPOWERING CAPITAL MARKETS IN LATIN AMERICA div.frw-wrapper--2 > div.frw-video > div > div.frw-bg--img | /v1/static/1301119679001/3454392a-340f-42a8-91d2-783301b1... | 651.7 KiB | 501.7 KiB |
section#events > div#main-content > section.frw-section__events > div.frw-event__background section#events > div#main-content > section.frw-section__events > div.frw-event__background | /03fbs7oah13w/1duv1G8KG9R9YS70znGcwt/d7f31c88d7e9c46e5034... | 597.0 KiB | 308.0 KiB |
div > div > video-js#vjs_video_3 > video#vjs_video_3_html5_api div > div > video-js#vjs_video_3 > video#vjs_video_3_html5_api | /v1/static/1301119679001/95874482-560a-47b1-a44d-c812cf35... | 272.5 KiB | 258.7 KiB |
HIGHLIGHT
U.S. Leveraged Finance Default Risk Rising Amid Geopolitical Tensions div > div#research-highlight > div.frw-column > article.frw-key-highlight | /03fbs7oah13w/7be0jkkE95kF0GwJ732Wql/740e58058a30c92ebfbc... | 371.4 KiB | 127.6 KiB |
These insights are also available in the Chrome DevTools Performance Panel - record a trace to view more detailed information.
Time to Interactive is the amount of time it takes for the page to become fully interactive. Learn more about the Time to Interactive metric.
Performance issues directly impact user engagement and conversion rates.
The maximum potential First Input Delay that your users could experience is the duration of the longest task. Learn more about the Maximum Potential First Input Delay metric.
Performance issues directly impact user engagement and conversion rates.
Redirects introduce additional delays before the page can be loaded. Learn how to avoid page redirects.
Performance issues directly impact user engagement and conversion rates.
| URL | Time Spent |
|---|---|
| fitchratings.com/ | 909 ms |
| www.fitchratings.com/ | 0.0 ms |
These are the largest layout shifts observed on the page. Each table item represents a single layout shift, and shows the element that shifted the most. Below each item are possible root causes that led to the layout shift. Some of these layout shifts may not be included in the CLS metric value due to windowing. Learn how to improve CLS
Performance issues directly impact user engagement and conversion rates.
| Element | Layout shift score |
|---|---|
LATEST COMMENTARY
Iran War Adds to Risks Facing Emerging Markets
LEARN MOREMORE… div.fr-carousel > div.slick-slider > div.slick-list > div.slick-track | 0.501 |
LATEST COMMENTARY
Iran War Adds to Risks Facing Emerging Markets
LEARN MOREMORE… div.hero-carousel > div.fr-carousel-wrapper > div.fr-carousel > div.slick-slider | 0.027 |
01Insights
HIGHLIGHT
U.S. Leveraged Finance Default Risk Rising Amid Geopolitic… article > div#main-content > section#insights > div.frw-wrapper--1 | 0.002 |
Sign In|Register div.frw-top-bar > div.frw-wrapper--1 > div.frw-top-bar__right > div.frw-account | 0.000 |
toggle language dropdown div.frw-wrapper--1 > div.frw-region > div.frw-region--language > div.frw-overlay__language | 0.000 |
Reduce unused JavaScript and defer loading scripts until they are required to decrease bytes consumed by network activity. Learn how to reduce unused JavaScript.
Multi-megabyte JavaScript bundles delay every interactive feature on the page.
This is the Lighthouse audit fired when too much JS is shipped relative to what executes. The fix isn't a config flag — it requires bundle analysis (webpack-bundle-analyzer, rollup-plugin-visualizer), splitting routes into chunks, lazy-loading off-screen components, and removing unused dependencies. Fundamentally different from minification: minifying reduces byte count, this reduces what's downloaded at all.
Source: Google web.dev / Lighthouse
| URL | Transfer Size | Est Savings |
|---|---|---|
| www.fitchratings.com/app-de4e49dd484fc7958c01.js | 3.6 MiB | 2.6 MiB |
| players.brightcove.net/1301119679001/ryVPzahIb_default/index.min.js | 226.0 KiB | 152.8 KiB |
| www.fitchratings.com/forms2.min.js | 204.7 KiB | 152.3 KiB |
| players.brightcove.net/1301119679001/ryVPzahIb_default/index.min.js | 226.0 KiB | 132.0 KiB |
| global-assets.fitch.group/apps/fr-events/0.0.6/fr-events.js | 224.0 KiB | 128.7 KiB |
| cdn.ketchjs.com/ketchtag/stable/v2.12/ketch-sdk.js | 258.7 KiB | 117.2 KiB |
| /gtm.js?id=GTM-545N25M>m_auth=OwLA0DghFB1uj-tl4E1L4A>... | 185.1 KiB | 62.9 KiB |
| www.fitchratings.com/framework-e0b863bc3bc82cb7571f.js | 69.1 KiB | 54.1 KiB |
| /1b409dbe99e9ac4b5d462541a62b36e508b1eaa4-5772129a165d703... | 73.2 KiB | 35.9 KiB |
| assets.adobedtm.com/7582667546ef/8a359a5930a6/launch-37a059c71c4d.min.js | 68.8 KiB | 31.1 KiB |
| /1b8ec99c36edcd20ddd2ce945e0ac58b5f6effb6-cd287d2f5012878... | 56.9 KiB | 28.4 KiB |
Consider reducing the time spent parsing, compiling, and executing JS. You may find delivering smaller JS payloads helps with this. Learn how to reduce Javascript execution time.
Performance issues directly impact user engagement and conversion rates.
Consider reducing the time spent parsing, compiling and executing JS. You may find delivering smaller JS payloads helps with this. Learn how to minimize main-thread work
Performance issues directly impact user engagement and conversion rates.
| Category | Time Spent |
|---|---|
| Script Evaluation | 5.4 s |
| Other | 1.6 s |
| Script Parsing & Compilation | 960 ms |
| Style & Layout | 737 ms |
| Parse HTML & CSS | 290 ms |
| Rendering | 272 ms |
| Garbage Collection | 117 ms |
Minifying CSS files can reduce network payload sizes. Learn how to minify CSS.
Performance issues directly impact user engagement and conversion rates.
| URL | Transfer Size | Est Savings |
|---|---|---|
| .vjs-svg-icon { display: inline-block; background-repeat: no-repeat; … } … | 28.7 KiB | 19.5 KiB |
Reduce unused rules from stylesheets and defer CSS not used for above-the-fold content to decrease bytes consumed by network activity. Learn how to reduce unused CSS.
Performance issues directly impact user engagement and conversion rates.
| URL | Transfer Size | Est Savings |
|---|---|---|
| @charset "UTF-8";.frw-error{text-align:center} … | 862.2 KiB | 771.1 KiB |
| .vjs-svg-icon { display: inline-block; background-repeat: no-repeat; … } … | 28.7 KiB | 28.0 KiB |
| 22.1 KiB | 19.0 KiB |
Large network payloads cost users real money and are highly correlated with long load times. Learn how to reduce payload sizes.
Performance issues directly impact user engagement and conversion rates.
More information about the performance of your application. These numbers don't directly affect the Performance score.
These checks highlight opportunities to improve the accessibility of your web app. Automatic detection can only detect a subset of issues and does not guarantee the accessibility of your web app, so manual testing is also encouraged.
When an element doesn't have an accessible name, screen readers announce it with a generic name, making it unusable for users who rely on screen readers. Learn how to make command elements more accessible.
Performance issues directly impact user engagement and conversion rates.
| Failing Elements |
|---|
nav#back-to-top > div.frw-wrapper--1 > div.frw-region > div.frw-js-nav-toggle nav#back-to-top > div.frw-wrapper--1 > div.frw-region > div.frw-js-nav-toggle |
These are opportunities to improve the usage of ARIA in your application which may enhance the experience for users of assistive technology, like a screen reader.
Properly ordered headings that do not skip levels convey the semantic structure of the page, making it easier to navigate and understand when using assistive technologies. Learn more about heading order.
Performance issues directly impact user engagement and conversion rates.
| Failing Elements |
|---|
FITCH RATINGS - EMPOWERING CAPITAL MARKETS IN LATIN AMERICA div.frw-video > div > div.frw-bg--img > h4.frw-heading--6 |
Fitch on Indonesia 2026 div.frw-event__row--group > div.frw-event__row > div.frw-column > h3.frw-event__title |
These are opportunities to improve keyboard navigation in your application.
Deprecated APIs will eventually be removed from the browser. Learn more about deprecated APIs.
Performance issues directly impact user engagement and conversion rates.
| Deprecation / Warning | Source |
|---|---|
| Synchronous XMLHttpRequest on the main thread is deprecated because of its detrimental effects to the end user's experience. For more help, check https://xhr.spec.whatwg.org/. |
Errors logged to the console indicate unresolved problems. They can come from network request failures and other browser concerns. Learn more about this errors in console diagnostic audit
Performance issues directly impact user engagement and conversion rates.
| Source | Description |
|---|---|
Failed to load resource: net::ERR_NAME_NOT_RESOLVED | |
/gtm.js?id=GTM-545N25M>m_auth=OwLA0DghFB1uj-tl4E1L4A>... line 310, col 391 | Loading the script 'https://j.6sc.co/j/379c5f9c-6138-4f09-b203-a6967bc31818.js' violates the following Content Security Policy directive: "script-src 'self' 'unsafe-inline' 'unsafe-eval' assets.adobedtm.com *.demdex.net edge.adobedc.net cdn.jsdelivr.net *.google.com *.google.co.uk *.google.com.hk *.twitter.com *.googletagmanager.com *.google-analytics.com fitchconnect.piwikpro.com fitchconnect.piwik.pro *.brightcove.net *.brightcove.com munchkin.marketo.net your.fitchratings.com *.evidon.com cdn2.funnelenvy.com script.crazyegg.com *.licdn.com *.clearbitscripts.com *.clearbit.com *.idio.co chart-studio.plotly.com public.flourish.studio app.fitchconnect-stg.com app.fitchconnect.com *.fitch.group *.hotjar.com vjs.zencdn.net *.mktorest.com *.clearbitjs.com *.ads-twitter.com *.googleadservices.com *.linkedin.com *.googlesyndication.com *.doubleclick.net *.bizographics.com *.adsymptotic.com *.linkedin.oribi.io onemark.grazitti.com frontend.cdn.splashthat.com d3m889aznlr23d.cloudfront.net cdn.ketchjs.com global.ketchcdn.com secure.intuitionoperation.com e.infogram.com cdnjs.cloudflare.com". Note that 'script-src-elem' was not explicitly set, so 'script-src' is used as a fallback. The action has been blocked. |
TypeError: Cannot read properties of null (reading 'split')
at <anonymous>:1:263
at https://www.googletagmanager.com/gtm.js?id=GTM-545N25M>m_auth=OwLA0DghFB1uj-tl4E1L4A>m_preview=env-2>m_cookies_win=x:1021:429
at vR (https://www.googletagmanager.com/gtm.js?id=GTM-545N25M>m_auth=OwLA0DghFB1uj-tl4E1L4A>m_preview=env-2>m_cookies_win=x:1023:31)
at https://www.googletagmanager.com/gtm.js?id=GTM-545N25M>m_auth=OwLA0DghFB1uj-tl4E1L4A>m_preview=env-2>m_cookies_win=x:1023:63 |
Issues logged to the `Issues` panel in Chrome Devtools indicate unresolved problems. They can come from network request failures, insufficient security controls, and other browser concerns. Open up the Issues panel in Chrome DevTools for more details on each issue.
Performance issues directly impact user engagement and conversion rates.
| Issue type |
|---|
| Content security policy |
Source maps translate minified code to the original source code. This helps developers debug in production. In addition, Lighthouse is able to provide further insights. Consider deploying source maps to take advantage of these benefits. Learn more about source maps.
Performance issues directly impact user engagement and conversion rates.
These checks ensure that your page is following basic search engine optimization advice. There are many additional factors Lighthouse does not score here that may affect your search ranking, including performance on Core Web Vitals. Learn more about Google Search Essentials.
Descriptive link text helps search engines understand your content. Learn how to make links more accessible.
Performance issues directly impact user engagement and conversion rates.
| Link destination | Link Text |
|---|---|
| /research/sovereigns/iran-war-adds-to-risks-facing-emergi... | LEARN MORE |
| www.fitchratings.com/criteria | LEARN MORE |
| www.fitchratings.com/products/ratings-process | LEARN MORE |
| www.fitchratings.com/global-economic-outlook-excerpt | LEARN MORE |
| /videos/japans-major-insurers-well-prepared-for-new-regul... | LEARN MORE |
Format your HTML in a way that enables crawlers to better understand your app’s content.
Search engines may use `href` attributes on links to crawl websites. Ensure that the `href` attribute of anchor elements links to an appropriate destination, so more pages of the site can be discovered. Learn how to make links crawlable
Performance issues directly impact user engagement and conversion rates.
| Uncrawlable Link |
|---|
section.frw-section > div.frw-wrapper--1 > div.frw-back-to-top > a section.frw-section > div.frw-wrapper--1 > div.frw-back-to-top > a |
To appear in search results, crawlers need access to your app.
Industry-standard audits powered by Google Lighthouse. — Desktop
Key metrics that affect user experience. — Desktop
First Contentful Paint First Contentful Paint — how long until the browser renders the first piece of content. Under 1.8s is good.
2.34 s
Largest Contentful Paint Largest Contentful Paint — how long until the largest visible element loads. Under 2.5s is good.
8.63 s
Total Blocking Time Total Blocking Time — total time the main thread was blocked, preventing user input. Under 200ms is good.
364 ms
Cumulative Layout Shift Cumulative Layout Shift — measures visual stability. How much the page layout shifts during loading. Under 0.1 is good.
1.233
Speed Index Speed Index — how quickly content is visually displayed during load. Under 3.4s is good.
6.96 s
Time to Interactive Time to Interactive — how long until the page is fully interactive and responds to user input. Under 3.8s is good.
9.36 s
Audit breakdown by category with detailed findings.
Remove large, duplicate JavaScript modules from bundles to reduce unnecessary bytes consumed by network activity.
Performance issues directly impact user engagement and conversion rates.
Polyfills and transforms enable older browsers to use new JavaScript features. However, many aren't necessary for modern browsers. Consider modifying your JavaScript build process to not transpile Baseline features, unless you know you must support older browsers. Learn why most sites can deploy ES6+ code without transpiling
Shipping ES5 transpiled code to modern browsers wastes bytes — every user with an evergreen browser pays for compatibility you don't need.
Most users today run browsers that natively support ES6+, async/await, optional chaining, and the rest of modern JavaScript. Transpiling to ES5 'just in case' adds 20-40% to your bundle for no benefit. Configure your build to target a modern browserslist, or ship a differential bundle pair (modern + legacy) with the module/nomodule pattern.
Source: Google web.dev / Lighthouse
3rd party code can significantly impact load performance. Reduce and defer loading of 3rd party code to prioritize your page's content.
Performance issues directly impact user engagement and conversion rates.
A long cache lifetime can speed up repeat visits to your page. Learn more about caching.
Performance issues directly impact user engagement and conversion rates.
| Request | Cache TTL | Transfer Size |
|---|---|---|
| cdn.ketchjs.com/ketchtag/stable/v2.12/ketch-sdk.js | 1200.0 s | 259.2 KiB |
| players.brightcove.net/1301119679001/ryVPzahIb_default/index.min.js | 300.0 s | 226.5 KiB |
| assets.adobedtm.com/7582667546ef/8a359a5930a6/launch-37a059c71c4d.min.js | 3600.0 s | 69.1 KiB |
| assets.map.brightcove.com/plugin/dist/videojs-bc-map-core.min.js?c=1776894622464 | 0.0 ms | 23.7 KiB |
| global.ketchcdn.com/web/v3/config/thefitchgroup/fitch_ratings/boot.js | 1200.0 s | 4.8 KiB |
| munchkin.marketo.net/munchkin.js | 0.0 ms | 1.2 KiB |
Layout shifts occur when elements move absent any user interaction. Investigate the causes of layout shifts, such as elements being added, removed, or their fonts changing as the page loads.
Performance issues directly impact user engagement and conversion rates.
Your first network request is the most important. Reduce its latency by avoiding redirects, ensuring a fast server response, and enabling text compression.
Performance issues directly impact user engagement and conversion rates.
Consider setting font-display to swap or optional to ensure text is consistently visible. swap can be further optimized to mitigate layout shifts with font metric overrides.
Performance issues directly impact user engagement and conversion rates.
Reducing the download time of images can improve the perceived load time of the page and LCP. Learn more about optimizing image size
Performance issues directly impact user engagement and conversion rates.
| URL | Resource Size | Est Savings | |
|---|---|---|---|
FITCH RATINGS - EMPOWERING CAPITAL MARKETS IN LATIN AMERICA div.frw-wrapper--2 > div.frw-video > div > div.frw-bg--img | /v1/static/1301119679001/3454392a-340f-42a8-91d2-783301b1... | 651.7 KiB | 501.7 KiB |
HIGHLIGHT
U.S. Leveraged Finance Default Risk Rising Amid Geopolitical Tensions div > div#research-highlight > div.frw-column > article.frw-key-highlight | /03fbs7oah13w/7be0jkkE95kF0GwJ732Wql/740e58058a30c92ebfbc... | 371.4 KiB | 127.6 KiB |
div > div > video-js#vjs_video_3 > div.vjs-poster div > div > video-js#vjs_video_3 > div.vjs-poster | /v1/static/1301119679001/95874482-560a-47b1-a44d-c812cf35... | 272.5 KiB | 122.5 KiB |
Each subpart has specific improvement strategies. Ideally, most of the LCP time should be spent on loading the resources, not within delays.
Performance issues directly impact user engagement and conversion rates.
Optimize LCP by making the LCP image discoverable from the HTML immediately, and avoiding lazy-loading
Performance issues directly impact user engagement and conversion rates.
Avoid chaining critical requests by reducing the length of chains, reducing the download size of resources, or deferring the download of unnecessary resources to improve page load.
Performance issues directly impact user engagement and conversion rates.
Requests are blocking the page's initial render, which may delay LCP. Deferring or inlining can move these network requests out of the critical path.
Performance issues directly impact user engagement and conversion rates.
| URL | Transfer Size | Duration |
|---|---|---|
| global-assets.fitch.group/npm/react-dom@18.3.1/umd/react-dom.production.min.js | 42.9 KiB | 82 ms |
| global-assets.fitch.group/npm/react@18.3.1/umd/react.production.min.js | 4.7 KiB | |
| players.brightcove.net/1301119679001/ryVPzahIb_default/index.min.js | 226.5 KiB | 573 ms |
| global-assets.fitch.group/npm/systemjs@6.8.3/dist/system.min.js | 4.8 KiB | 504 ms |
These insights are also available in the Chrome DevTools Performance Panel - record a trace to view more detailed information.
Redirects introduce additional delays before the page can be loaded. Learn how to avoid page redirects.
Performance issues directly impact user engagement and conversion rates.
| URL | Time Spent |
|---|---|
| fitchratings.com/ | 522 ms |
| www.fitchratings.com/ | 0.0 ms |
These are the largest layout shifts observed on the page. Each table item represents a single layout shift, and shows the element that shifted the most. Below each item are possible root causes that led to the layout shift. Some of these layout shifts may not be included in the CLS metric value due to windowing. Learn how to improve CLS
Performance issues directly impact user engagement and conversion rates.
| Element | Layout shift score |
|---|---|
LATEST COMMENTARY
Iran War Adds to Risks Facing Emerging Markets
LEARN MOREMORE… div.fr-carousel > div.slick-slider > div.slick-list > div.slick-track | 1.000 |
CONTENTS
00
BACK TO TOP
01
INSIGHTS
02
VIDEOS
03
PODCASTS
04
EVENTS
RESOURCES
L… div#gatsby-focus-wrapper > div.frw-hasHeader > div > main.frw-main | 0.178 |
CONTENTS
00
BACK TO TOP
01
INSIGHTS
02
VIDEOS
03
PODCASTS
04
EVENTS
RESOURCES
L… div#___gatsby > div#gatsby-focus-wrapper > div.frw-hasHeader > div | 0.030 |
CONTENTS
00
BACK TO TOP
01
INSIGHTS
02
VIDEOS
03
PODCASTS
04
EVENTS
RESOURCES
L… div > main.frw-main > article > div.frw-action-bar | 0.009 |
CONTENTS
00
BACK TO TOP
01
INSIGHTS
02
VIDEOS
03
PODCASTS
04
EVENTS
RESOURCES
L… div > main.frw-main > article > div.frw-action-bar | 0.006 |
01Insights
HIGHLIGHT
U.S. Leveraged Finance Default Risk Rising Amid Geopolitic… main.frw-main > article > div#main-content > section#insights | 0.006 |
01 div.frw-wrapper--1 > div > h2.frw-heading--3 > span.frw-heading--no | 0.002 |
CONTENTS
00
BACK TO TOP
01
INSIGHTS
02
VIDEOS
03
PODCASTS
04
EVENTS
RESOURCES
L… div > main.frw-main > article > div.frw-action-bar | 0.001 |
CONTENTS
00
BACK TO TOP
01
INSIGHTS
02
VIDEOS
03
PODCASTS
04
EVENTS
RESOURCES
L… div > main.frw-main > article > div.frw-action-bar | 0.001 |
HIGHLIGHT
U.S. Leveraged Finance Default Risk Rising Amid Geopolitical Tensions… div.fr-carousel-wrapper > div.fr-carousel > div.slick-slider > div.slick-list | 0.001 |
CONTENTS
00
BACK TO TOP
01
INSIGHTS
02
VIDEOS
03
PODCASTS
04
EVENTS
RESOURCES
L… div > main.frw-main > article > div.frw-action-bar | 0.000 |
CONTENTS
00
BACK TO TOP
01
INSIGHTS
02
VIDEOS
03
PODCASTS
04
EVENTS
RESOURCES
L… div > main.frw-main > article > div.frw-action-bar | 0.000 |
CONTENTS
00
BACK TO TOP
01
INSIGHTS
02
VIDEOS
03
PODCASTS
04
EVENTS
RESOURCES
L… div > main.frw-main > article > div.frw-action-bar | 0.000 |
CONTENTS
00
BACK TO TOP
01
INSIGHTS
02
VIDEOS
03
PODCASTS
04
EVENTS
RESOURCES
L… div > main.frw-main > article > div.frw-action-bar | 0.000 |
toggle action bar main.frw-main > article > div.frw-action-bar > div.frw-js-action-bar__toggle-wrapper | 0.000 |
Time to Interactive is the amount of time it takes for the page to become fully interactive. Learn more about the Time to Interactive metric.
Performance issues directly impact user engagement and conversion rates.
The maximum potential First Input Delay that your users could experience is the duration of the longest task. Learn more about the Maximum Potential First Input Delay metric.
Performance issues directly impact user engagement and conversion rates.
Reduce unused JavaScript and defer loading scripts until they are required to decrease bytes consumed by network activity. Learn how to reduce unused JavaScript.
Multi-megabyte JavaScript bundles delay every interactive feature on the page.
This is the Lighthouse audit fired when too much JS is shipped relative to what executes. The fix isn't a config flag — it requires bundle analysis (webpack-bundle-analyzer, rollup-plugin-visualizer), splitting routes into chunks, lazy-loading off-screen components, and removing unused dependencies. Fundamentally different from minification: minifying reduces byte count, this reduces what's downloaded at all.
Source: Google web.dev / Lighthouse
| URL | Transfer Size | Est Savings |
|---|---|---|
| www.fitchratings.com/app-de4e49dd484fc7958c01.js | 3.6 MiB | 2.5 MiB |
| www.fitchratings.com/forms2.min.js | 204.7 KiB | 152.3 KiB |
| players.brightcove.net/1301119679001/ryVPzahIb_default/index.min.js | 226.0 KiB | 152.1 KiB |
| players.brightcove.net/1301119679001/ryVPzahIb_default/index.min.js | 226.0 KiB | 131.6 KiB |
| global-assets.fitch.group/apps/fr-events/0.0.6/fr-events.js | 224.0 KiB | 128.7 KiB |
| cdn.ketchjs.com/ketchtag/stable/v2.12/ketch-sdk.js | 258.7 KiB | 117.2 KiB |
| /gtm.js?id=GTM-545N25M>m_auth=OwLA0DghFB1uj-tl4E1L4A>... | 185.1 KiB | 62.9 KiB |
| www.fitchratings.com/framework-e0b863bc3bc82cb7571f.js | 69.1 KiB | 54.1 KiB |
| /1b409dbe99e9ac4b5d462541a62b36e508b1eaa4-5772129a165d703... | 73.2 KiB | 35.9 KiB |
| assets.adobedtm.com/7582667546ef/8a359a5930a6/launch-37a059c71c4d.min.js | 68.8 KiB | 31.1 KiB |
| /1b8ec99c36edcd20ddd2ce945e0ac58b5f6effb6-cd287d2f5012878... | 56.9 KiB | 28.4 KiB |
Consider reducing the time spent parsing, compiling, and executing JS. You may find delivering smaller JS payloads helps with this. Learn how to reduce Javascript execution time.
Performance issues directly impact user engagement and conversion rates.
| URL | Total CPU Time | Script Evaluation | Script Parse |
|---|---|---|---|
| www.fitchratings.com/app-de4e49dd484fc7958c01.js | 1.0 s | 838 ms | 118 ms |
| Unattributable | 348 ms | 38 ms | 0.0 ms |
| www.fitchratings.com/ | 326 ms | 3.8 ms | 1.4 ms |
| /658e2401aa4dd58eac134aa327abff419572f53a-bcb5b7d5bbd31b6... | 248 ms | 56 ms | 0.3 ms |
| players.brightcove.net/1301119679001/ryVPzahIb_default/index.min.js | 180 ms | 94 ms | 57 ms |
| global-assets.fitch.group/apps/fr-events/0.0.6/fr-events.js | 166 ms | 121 ms | 17 ms |
| cdn.ketchjs.com/ketchtag/stable/v2.12/ketch-sdk.js | 122 ms | 89 ms | 32 ms |
| /gtm.js?id=GTM-545N25M>m_auth=OwLA0DghFB1uj-tl4E1L4A>... | 105 ms | 77 ms | 23 ms |
| assets.adobedtm.com/7582667546ef/8a359a5930a6/launch-37a059c71c4d.min.js | 85 ms | 78 ms | 6.0 ms |
| /1b409dbe99e9ac4b5d462541a62b36e508b1eaa4-5772129a165d703... | 52 ms | 12 ms | 1.6 ms |
Consider reducing the time spent parsing, compiling and executing JS. You may find delivering smaller JS payloads helps with this. Learn how to minimize main-thread work
Performance issues directly impact user engagement and conversion rates.
| Category | Time Spent |
|---|---|
| Script Evaluation | 1.6 s |
| Other | 562 ms |
| Script Parsing & Compilation | 277 ms |
| Style & Layout | 277 ms |
| Rendering | 95 ms |
| Parse HTML & CSS | 68 ms |
| Garbage Collection | 35 ms |
Minifying CSS files can reduce network payload sizes. Learn how to minify CSS.
Performance issues directly impact user engagement and conversion rates.
| URL | Transfer Size | Est Savings |
|---|---|---|
| .vjs-svg-icon { display: inline-block; background-repeat: no-repeat; … } … | 28.7 KiB | 19.5 KiB |
Reduce unused rules from stylesheets and defer CSS not used for above-the-fold content to decrease bytes consumed by network activity. Learn how to reduce unused CSS.
Performance issues directly impact user engagement and conversion rates.
| URL | Transfer Size | Est Savings |
|---|---|---|
| @charset "UTF-8";.frw-error{text-align:center} … | 862.2 KiB | 778.0 KiB |
| .vjs-svg-icon { display: inline-block; background-repeat: no-repeat; … } … | 28.7 KiB | 28.0 KiB |
| 22.1 KiB | 18.9 KiB |
Large network payloads cost users real money and are highly correlated with long load times. Learn how to reduce payload sizes.
Performance issues directly impact user engagement and conversion rates.
More information about the performance of your application. These numbers don't directly affect the Performance score.
These checks highlight opportunities to improve the accessibility of your web app. Automatic detection can only detect a subset of issues and does not guarantee the accessibility of your web app, so manual testing is also encouraged.
Low-contrast text is difficult or impossible for many users to read. Learn how to provide sufficient color contrast.
Performance issues directly impact user engagement and conversion rates.
| Failing Elements |
|---|
ABOUT US nav.frw-navigation__main > ul.frw-menu > li.frw-navigation__group > span.frw-overlay |
WED 22 APR, 2026 div.ticker > div.ticker__element > article.frw-rating-teaser > div.frw-heading--sub |
Fitch Takes Various Actions on WFCM 2017-C38, 2017-C39, 2017-C40, and MOA 2020-… div.ticker__element > article.frw-rating-teaser > h3.frw-heading > a |
WED 22 APR, 2026 div.ticker > div.ticker__element > article.frw-rating-teaser > div.frw-heading--sub |
Fitch Withdraws Ratings on Nassau County (NY) GO Bonds Series 2008E div.ticker__element > article.frw-rating-teaser > h3.frw-heading > a |
WED 22 APR, 2026 div.ticker > div.ticker__element > article.frw-rating-teaser > div.frw-heading--sub |
These are opportunities to improve the legibility of your content.
Properly ordered headings that do not skip levels convey the semantic structure of the page, making it easier to navigate and understand when using assistive technologies. Learn more about heading order.
Performance issues directly impact user engagement and conversion rates.
| Failing Elements |
|---|
Fitch Affirms Eliza Jennings Senior Care Network, OH's Series 2022A Bonds at 'B… div.ticker > div.ticker__element > article.frw-rating-teaser > h3.frw-heading |
FITCH RATINGS - EMPOWERING CAPITAL MARKETS IN LATIN AMERICA div.frw-video > div > div.frw-bg--img > h4.frw-heading--6 |
Fitch on Indonesia 2026 div.frw-event__row--group > div.frw-event__row > div.frw-column > h3.frw-event__title |
These are opportunities to improve keyboard navigation in your application.
Link text (and alternate text for images, when used as links) that is discernible, unique, and focusable improves the navigation experience for screen reader users. Learn how to make links accessible.
Performance issues directly impact user engagement and conversion rates.
| Failing Elements |
|---|
div.frw-event__row > div.frw-column > div.frw-image-wrapper > a div.frw-event__row > div.frw-column > div.frw-image-wrapper > a |
These are opportunities to improve the semantics of the controls in your application. This may enhance the experience for users of assistive technology, like a screen reader.
Screen readers have a specific way of announcing lists. Ensuring proper list structure aids screen reader output. Learn more about proper list structure.
Performance issues directly impact user engagement and conversion rates.
| Failing Elements |
|---|
Go to slides 1 to 2 div.frw-wrapper--1 > div.fr-carousel-wrapper > div.fr-carousel-pager-wrapper > ul.fr-slick-dots |
Go to slides 1 to 4 div.frw-wrapper--2 > div.fr-carousel-wrapper > div.fr-carousel-pager-wrapper > ul.fr-slick-dots |
Go to slides 1 to 4 div.frw-wrapper--1 > div.fr-carousel-wrapper > div.fr-carousel-pager-wrapper > ul.fr-slick-dots |
These are opportunities to improve the experience of reading tabular or list data using assistive technology, like a screen reader.
Deprecated APIs will eventually be removed from the browser. Learn more about deprecated APIs.
Performance issues directly impact user engagement and conversion rates.
| Deprecation / Warning | Source |
|---|---|
| Synchronous XMLHttpRequest on the main thread is deprecated because of its detrimental effects to the end user's experience. For more help, check https://xhr.spec.whatwg.org/. |
Errors logged to the console indicate unresolved problems. They can come from network request failures and other browser concerns. Learn more about this errors in console diagnostic audit
Performance issues directly impact user engagement and conversion rates.
| Source | Description |
|---|---|
Failed to load resource: net::ERR_NAME_NOT_RESOLVED | |
/gtm.js?id=GTM-545N25M>m_auth=OwLA0DghFB1uj-tl4E1L4A>... line 310, col 391 | Loading the script 'https://j.6sc.co/j/379c5f9c-6138-4f09-b203-a6967bc31818.js' violates the following Content Security Policy directive: "script-src 'self' 'unsafe-inline' 'unsafe-eval' assets.adobedtm.com *.demdex.net edge.adobedc.net cdn.jsdelivr.net *.google.com *.google.co.uk *.google.com.hk *.twitter.com *.googletagmanager.com *.google-analytics.com fitchconnect.piwikpro.com fitchconnect.piwik.pro *.brightcove.net *.brightcove.com munchkin.marketo.net your.fitchratings.com *.evidon.com cdn2.funnelenvy.com script.crazyegg.com *.licdn.com *.clearbitscripts.com *.clearbit.com *.idio.co chart-studio.plotly.com public.flourish.studio app.fitchconnect-stg.com app.fitchconnect.com *.fitch.group *.hotjar.com vjs.zencdn.net *.mktorest.com *.clearbitjs.com *.ads-twitter.com *.googleadservices.com *.linkedin.com *.googlesyndication.com *.doubleclick.net *.bizographics.com *.adsymptotic.com *.linkedin.oribi.io onemark.grazitti.com frontend.cdn.splashthat.com d3m889aznlr23d.cloudfront.net cdn.ketchjs.com global.ketchcdn.com secure.intuitionoperation.com e.infogram.com cdnjs.cloudflare.com". Note that 'script-src-elem' was not explicitly set, so 'script-src' is used as a fallback. The action has been blocked. |
TypeError: Cannot read properties of null (reading 'split')
at <anonymous>:1:263
at https://www.googletagmanager.com/gtm.js?id=GTM-545N25M>m_auth=OwLA0DghFB1uj-tl4E1L4A>m_preview=env-2>m_cookies_win=x:1021:429
at vR (https://www.googletagmanager.com/gtm.js?id=GTM-545N25M>m_auth=OwLA0DghFB1uj-tl4E1L4A>m_preview=env-2>m_cookies_win=x:1023:31)
at https://www.googletagmanager.com/gtm.js?id=GTM-545N25M>m_auth=OwLA0DghFB1uj-tl4E1L4A>m_preview=env-2>m_cookies_win=x:1023:63 |
Issues logged to the `Issues` panel in Chrome Devtools indicate unresolved problems. They can come from network request failures, insufficient security controls, and other browser concerns. Open up the Issues panel in Chrome DevTools for more details on each issue.
Performance issues directly impact user engagement and conversion rates.
| Issue type |
|---|
| Content security policy |
Source maps translate minified code to the original source code. This helps developers debug in production. In addition, Lighthouse is able to provide further insights. Consider deploying source maps to take advantage of these benefits. Learn more about source maps.
Performance issues directly impact user engagement and conversion rates.
These checks ensure that your page is following basic search engine optimization advice. There are many additional factors Lighthouse does not score here that may affect your search ranking, including performance on Core Web Vitals. Learn more about Google Search Essentials.
Descriptive link text helps search engines understand your content. Learn how to make links more accessible.
Performance issues directly impact user engagement and conversion rates.
| Link destination | Link Text |
|---|---|
| /research/sovereigns/iran-war-adds-to-risks-facing-emergi... | LEARN MORE |
| www.fitchratings.com/criteria | LEARN MORE |
| www.fitchratings.com/products/ratings-process | LEARN MORE |
| www.fitchratings.com/global-economic-outlook-excerpt | LEARN MORE |
| /videos/japans-major-insurers-well-prepared-for-new-regul... | LEARN MORE |
Format your HTML in a way that enables crawlers to better understand your app’s content.
Search engines may use `href` attributes on links to crawl websites. Ensure that the `href` attribute of anchor elements links to an appropriate destination, so more pages of the site can be discovered. Learn how to make links crawlable
Performance issues directly impact user engagement and conversion rates.
| Uncrawlable Link |
|---|
section.frw-section > div.frw-wrapper--1 > div.frw-back-to-top > a section.frw-section > div.frw-wrapper--1 > div.frw-back-to-top > a |
To appear in search results, crawlers need access to your app.
Send Feedback