Global Performance
6/6 locations ✓Acceptable global latency — average 430ms across 6 locations, fastest from Amsterdam (204ms), slowest from Sao Paulo (869ms). Cloudflare edge cache (DYNAMIC). 2 locations above the 500ms target.
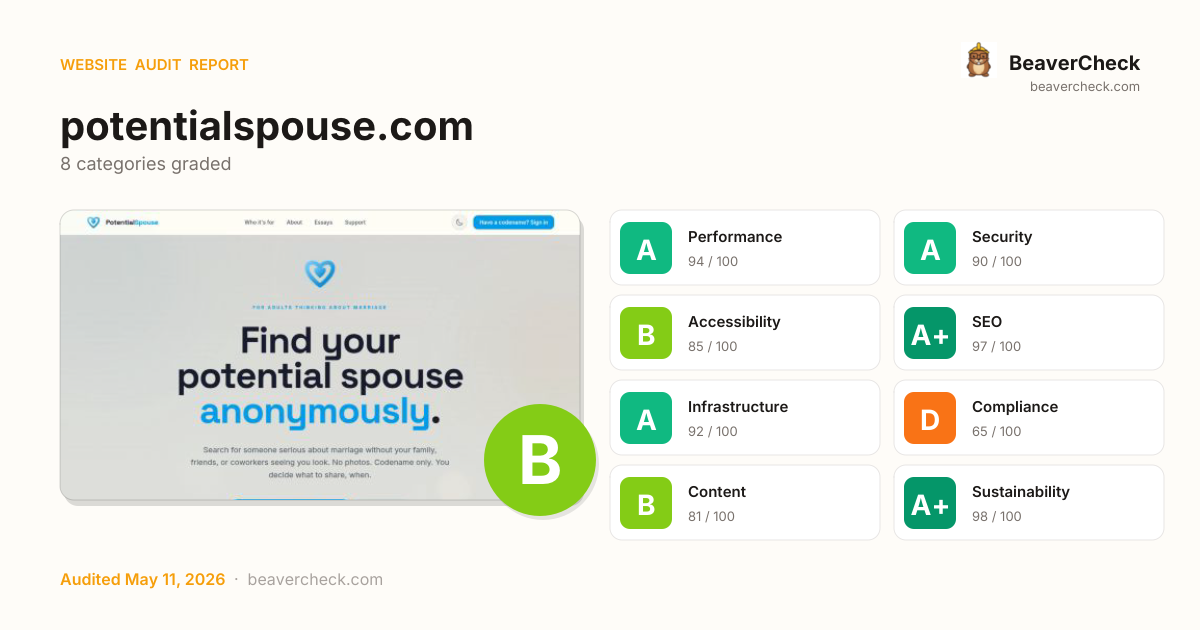
Audit overview
Compliance needs attention; the rest of the categories are in good shape.
Fix Priority Matrix
5 findingsQuick Wins
5High impact, low effort — start here.
Strategic
0High impact, requires investment.
Nothing in this quadrant — good news.
Easy Improvements
0Small gains, minimal effort.
Nothing in this quadrant — good news.
Deprioritize
0Low impact, high effort — do last.
Nothing in this quadrant — good news.
Screenshots


Top Priorities (5)
3 button(s) with no accessible text
Buttons with no accessible text (icon-only, no aria-label) can't be activated by voice control or understood by screen readers.
Cookie 'visitor_token' has no SameSite attribute
Without SameSite, cookies ride along on cross-site requests — enabling CSRF attacks that SameSite=Lax blocks for free.
DMARC policy is none — monitoring only
DMARC p=none collects reports but doesn't actually block spoofed mail — phishing emails still reach inboxes.
No Permissions-Policy header
Permissions-Policy locks down browser APIs you don't use, shrinking the attack surface.
Permissions-Policy header is missing
Permissions-Policy locks down browser APIs you don't use — without it, every page can request camera/mic/geolocation if XSS lands.
Business case
What fixing the audit's findings is worth -- and what ignoring them keeps costing.
Return on investment
€149 investment → €7,349/month returns + EUR 120,500,000 risk avoided
Figures combine localized regulatory fine ceilings, search/conversion value priced against local CPC, and bandwidth waste estimates. Results depend on implementation quality and audience composition. Not legal or financial advice.
Conversion barriers
4 barrier(s) likely increasing bounce by ~21%.
- Page takes 7.0s to loadUsers abandon at ~3s — you're 4.5s over the 2.5s threshold→ Optimize render-blocking resources, preload the hero image, and compress images
- No Content-Security-Policy headerHigher XSS blast radius — one compromised script can exfiltrate the checkout form→ Ship a reporting-only CSP first, then enforce once violations are clean
- No structured dataNo rich-result eligibility in Google — lower SERP CTR vs competitors with stars and prices→ Add JSON-LD for your page type (Product, Article, FAQPage, LocalBusiness, …)
- No skip-to-content linkKeyboard and screen-reader users must tab through the entire header on every page→ Add a visible-on-focus <a href="#main">Skip to content</a> as the first focusable element
Preliminary CRO audit — each barrier links to the tab with detailed analysis.
Remediation cost
Start here for the best return on investment
Cost by category
Cost by effort level
Adjust assumptions
Team composition
Multiplier applied to dev hours to reflect QA, design, and PM overhead. Use Dev only for solo work; Full team for projects with formal review processes.
Rates reflect fully-loaded developer cost including overhead
Cost of inaction
Compliance Risk
€120,500,000
- 2 non-essential cookie(s) set without consent bannerGDPR: EUR 5,000 – EUR 10,000,000
- 2 non-essential cookie(s) set without consent bannerGDPR: EUR 10,000 – EUR 20,000,000
- 2 non-essential cookie(s) set without consent bannerePrivacy Directive: EUR 5,000 – EUR 100,000,000
- 1 of 2 <nav> elements are unlabeledEAA: EUR 1,000 – EUR 500,000
- Skip navigation link is missing (WCAG 2.4.1)EAA: EUR 1,000 – EUR 500,000
Bounce-Rate Cost
€4,547 /mo
+20.7pp bounce · ~2,067 lost visitors/mo
CPC: EUR 2.20
Bandwidth Waste
€0.19 /mo
2566.4 MB/mo × 0.074 EUR/GB
- Optimize transfer: save ~257 KB per page loadSaves €0.19/mo
Compliance figures represent the statutory maximum fine for the most severe triggered category, capped per regulation — not the sum of per-finding penalties. Based on published regulatory fine ranges. This is not legal advice.
Unique monthly visitors from your analytics
Purchases, signups, or key actions
Optional — for revenue estimation
more engaged visitors from reduced bounce
Fix 1 critical issues to capture this value
How this is calculated
Based on Google/Deloitte research ("Milliseconds Make Millions") showing a ~7% bounce rate increase per additional second of LCP above the 2.5s "Good" threshold.
Your site's LCP: → estimated after fixes.
These are estimates based on industry research — actual results vary
Your data stays in your browser — nothing is sent to our servers
Lighthouse
Mobile
First Contentful Paint First Contentful Paint — how long until the browser renders the first piece of content. Under 1.8s is good.
1.99 s
Largest Contentful Paint Largest Contentful Paint — how long until the largest visible element loads. Under 2.5s is good.
7.00 s
Total Blocking Time Total Blocking Time — total time the main thread was blocked, preventing user input. Under 200ms is good.
200 ms
Cumulative Layout Shift Cumulative Layout Shift — measures visual stability. How much the page layout shifts during loading. Under 0.1 is good.
0.001
Speed Index Speed Index — how quickly content is visually displayed during load. Under 3.4s is good.
5.04 s
Time to Interactive Time to Interactive — how long until the page is fully interactive and responds to user input. Under 3.8s is good.
7.00 s
Desktop
First Contentful Paint First Contentful Paint — how long until the browser renders the first piece of content. Under 1.8s is good.
543 ms
Largest Contentful Paint Largest Contentful Paint — how long until the largest visible element loads. Under 2.5s is good.
1.21 s
Total Blocking Time Total Blocking Time — total time the main thread was blocked, preventing user input. Under 200ms is good.
0 ms
Cumulative Layout Shift Cumulative Layout Shift — measures visual stability. How much the page layout shifts during loading. Under 0.1 is good.
0.012
Speed Index Speed Index — how quickly content is visually displayed during load. Under 3.4s is good.
792 ms
Time to Interactive Time to Interactive — how long until the page is fully interactive and responds to user input. Under 3.8s is good.
1.21 s
Categories
8Performance
All checks pass
Security
Cookie 'visitor_token' has no SameSite attribute
Accessibility
3 button(s) with no accessible text
SEO
All checks pass
Infrastructure
All checks pass
Compliance
All checks pass
Content
All checks pass
Sustainability
All checks pass
How you compare
Where this site stands against peers running the same stack.
Top 10% of HSTS sites score 86+ on Compliance; you're at 65 — closing this gap is the highest-leverage improvement.
Top 10% of HTTP/3 sites score 85+ on Compliance; you're at 65 — closing this gap is the highest-leverage improvement.
Technology stack
HSTS, on Elixir, hosted on Fly.io, with Cloudflare CDN
Stack Architecture
 HTTP/3
  Open Graph
  Phoenix Framework Phoenix LiveView
  Priority Hints
  Tailwind CSS
  Elixir
  Erlang
  Cloudflare
  Fly.io
 All Detected Technologies (11)
Cloudflare is a web-infrastructure and website-security company, providing content-delivery-network services, DDoS mitigation, Internet security, and distributed domain-name-server services.
Fly is a platform for running full stack apps and databases.
Elixir is a dynamic, functional language designed for building scalable and maintainable applications.
Erlang is a general-purpose, concurrent, functional programming language, and a garbage-collected runtime system.
HTTP Strict Transport Security (HSTS) informs browsers that the site should only be accessed using HTTPS.
HTTP/3 is the third major version of the Hypertext Transfer Protocol used to exchange information on the World Wide Web.
Open Graph is a protocol that is used to integrate any web page into the social graph.
Phoenix Framework is an open-source web application framework built using the Elixir programming language.
Phoenix LiveView is a library that brings live, interactive, real-time user experiences to your Phoenix applications.
Priority Hints exposes a mechanism for developers to signal a relative priority for browsers to consider when fetching resources.
Observations (2)
No build tool detected
A framework (HSTS) was detected but no bundler was identified. The build tool may not be detectable from output patterns, or the site may use the framework's built-in bundler.
Complex technology stack detected
11 technologies identified. A complex stack increases maintenance burden and attack surface. Consider whether all components are actively needed.
Show your score
Drop this badge on your README, marketing site, or status page. It auto-updates every time the audit re-runs and links back to this report.
This badge auto-updates with your latest scan result.
[](https://beavercheck.com/results/1cd7e46e-db09-46c6-bbaf-55e711b85785)<a href="https://beavercheck.com/results/1cd7e46e-db09-46c6-bbaf-55e711b85785"><img src="https://beavercheck.com/badge?url=https%3A%2F%2Fpotentialspouse.com" alt="BeaverCheck Score"></a>https://beavercheck.com/badge?url=https%3A%2F%2Fpotentialspouse.comExport & share
Download the audit, share with your team, or grab a fix plan ready to copy into your tracker.
Copies markdown to clipboard
Fix Plan
Three-week roadmap to ship the audit's findings, with one-click copy targets for your tracker.
Three-week fix plan
1 sprints · 2h total → projected A (93)
Sprint 1: Quick Wins
+4Highest ROI — low effort, high impact
- · 3 button(s) with no accessible text
- · Cookie 'visitor_token' has no SameSite attribute
- · No Permissions-Policy header
- · Permissions-Policy header is missing
- · DMARC policy is none — monitoring only