Brazil · Sao Paulo Completed: Apr 21, 2026 22:12 UTC
Mobile 375 × 812

Desktop 1440 × 900

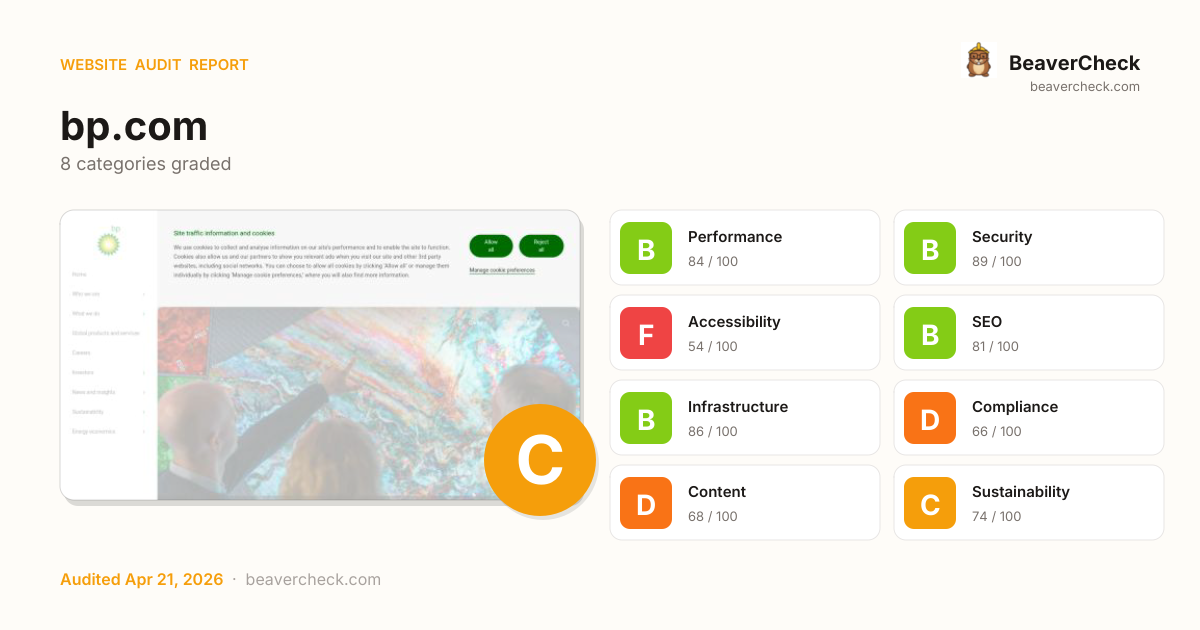
Score: 78 / 100
Based on 8 categories, 0 sections
Decent speed, but optimizing further could improve engagement.
Strong security — your users are well protected.
Several issues make your site difficult for assistive technology users.
Solid SEO basics — a few optimizations could boost rankings.
Solid infrastructure — fast server responses across the board.
Several regulatory requirements are not yet met.
Missing metadata means poor previews on social media and search.
Reasonable footprint with room for optimization.
The overall score is a weighted average of individual category scores. Categories with more impact on user experience and security carry more weight.
Weights reflect general web best practices. Individual needs may differ.
'unsafe-eval' found in script source
Security gaps expose your site and users to attacks, eroding trust.
No <main> landmark found
Accessibility issues exclude users with disabilities — up to 15% of your potential audience.
No favicon or icon links detected
Accessibility issues exclude users with disabilities — up to 15% of your potential audience.
30 third-party resources (100% of weight)
Performance issues directly impact user engagement and conversion rates.
Cross-Origin-Embedder-Policy header is missing
Security gaps expose your site and users to attacks, eroding trust.
High impact, low effort — start here.
High impact, requires investment.
Small gains, minimal effort.
Nothing in this quadrant — good news.
Low impact, high effort — do last.
Nothing in this quadrant — good news.
[](https://beavercheck.com/results/1ce5df89-84c6-4137-a281-b1e7c696da33)<a href="https://beavercheck.com/results/1ce5df89-84c6-4137-a281-b1e7c696da33"><img src="https://beavercheck.com/badge?url=https%3A%2F%2Fbp.com" alt="BeaverCheck Score"></a>https://beavercheck.com/badge?url=https%3A%2F%2Fbp.comThis badge auto-updates with your latest scan result.
Your site performs reasonably well, but a few targeted fixes could meaningfully improve results. Your LCP of 8.0s exceeds Google's 2.5s 'Good' threshold and the 1 performance issue below directly contributes to it. Accessibility issues exclude users who rely on assistive technology — an estimated 15% of your potential audience. Addressing the critical issues below would have the most immediate impact on your user trust.
9 barrier(s) likely increasing bounce by ~38%.
Page takes 8.0s to load
+12% bounceUsers abandon at ~3s — you're 5.5s over the 2.5s threshold
Fix: Optimize render-blocking resources, preload the hero image, and compress images
No HSTS header
+1% bounceReturning visitors are briefly exposed to downgrade attacks on first request
Fix: Set Strict-Transport-Security: max-age=31536000; includeSubDomains
No Content-Security-Policy header
+1% bounceHigher XSS blast radius — one compromised script can exfiltrate the checkout form
Fix: Ship a reporting-only CSP first, then enforce once violations are clean
Severe layout shift during page load
+6% bounceUsers mis-click when content jumps — converting intent into frustration
Fix: Reserve space for images, ads, and embeds with explicit width/height
No viewport meta tag
+15% bounceMobile browsers render at desktop width and shrink — text unreadable, tap targets miniature
Fix: Add <meta name="viewport" content="width=device-width, initial-scale=1">
No Open Graph tags
+2% bounceLinks shared on LinkedIn / Slack / Facebook show bare URLs — referral clicks drop
Fix: Add og:title, og:description, og:image, og:url to the page head
No structured data
+2% bounceNo rich-result eligibility in Google — lower SERP CTR vs competitors with stars and prices
Fix: Add JSON-LD for your page type (Product, Article, FAQPage, LocalBusiness, …)
Thin content
+3% bounceUnder 300 words — visitors bounce looking for substance, search engines rank competitors first
Fix: Add a substantive FAQ, product detail, or case-study section
No skip-to-content link
+1% bounceKeyboard and screen-reader users must tab through the entire header on every page
Fix: Add a visible-on-focus <a href="#main">Skip to content</a> as the first focusable element
Preliminary CRO audit — each barrier links to the tab with detailed analysis.
£450 investment → £4,488/month returns + GBP 18,050,000 risk avoided
£450
6h · 5 findings
£4,488 /mo
~£53,859 / year
GBP 18,050,000
if kept compliant
£75 — in quick wins — start here for the fastest payback
Figures combine localized regulatory fine ceilings, search/conversion value priced against local CPC, and bandwidth waste estimates. Results depend on implementation quality and audience composition. Not legal or financial advice.
6.0 developer hours at £75/hr
Based on United Kingdom rates (£75/hr)
Start here for the best return on investment
£1,504,167 / month at risk
~£18,050,002 / year if left unfixed
£18,050,000
+5 more
£0.18 /mo
2863.0 MB/mo × 0.063 GBP/GB
Compliance figures represent the statutory maximum fine for the most severe triggered category, capped per regulation — not the sum of per-finding penalties. Based on published regulatory fine ranges. This is not legal advice.
Unique monthly visitors from your analytics
Purchases, signups, or key actions
Optional — for revenue estimation
more engaged visitors from reduced bounce
Fix 3 critical issues to capture this value
Based on Google/Deloitte research ("Milliseconds Make Millions") showing a ~7% bounce rate increase per additional second of LCP above the 2.5s "Good" threshold.
Your site's LCP: → estimated after fixes.
These are estimates based on industry research — actual results vary
Your data stays in your browser — nothing is sent to our servers
Thanks for your feedback!
We'll use a cached audit if available, or offer to scan.
Industry-standard audits powered by Google Lighthouse.
Key metrics that affect user experience.
First Contentful Paint First Contentful Paint — how long until the browser renders the first piece of content. Under 1.8s is good.
5.09 s
Largest Contentful Paint Largest Contentful Paint — how long until the largest visible element loads. Under 2.5s is good.
8.03 s
Total Blocking Time Total Blocking Time — total time the main thread was blocked, preventing user input. Under 200ms is good.
167 ms
Cumulative Layout Shift Cumulative Layout Shift — measures visual stability. How much the page layout shifts during loading. Under 0.1 is good.
0.674
Speed Index Speed Index — how quickly content is visually displayed during load. Under 3.4s is good.
5.28 s
Time to Interactive Time to Interactive — how long until the page is fully interactive and responds to user input. Under 3.8s is good.
8.13 s
Audit breakdown by category with detailed findings.
Remove large, duplicate JavaScript modules from bundles to reduce unnecessary bytes consumed by network activity.
Performance issues directly impact user engagement and conversion rates.
Polyfills and transforms enable older browsers to use new JavaScript features. However, many aren't necessary for modern browsers. Consider modifying your JavaScript build process to not transpile Baseline features, unless you know you must support older browsers. Learn why most sites can deploy ES6+ code without transpiling
Shipping ES5 transpiled code to modern browsers wastes bytes — every user with an evergreen browser pays for compatibility you don't need.
Most users today run browsers that natively support ES6+, async/await, optional chaining, and the rest of modern JavaScript. Transpiling to ES5 'just in case' adds 20-40% to your bundle for no benefit. Configure your build to target a modern browserslist, or ship a differential bundle pair (modern + legacy) with the module/nomodule pattern.
Source: Google web.dev / Lighthouse
3rd party code can significantly impact load performance. Reduce and defer loading of 3rd party code to prioritize your page's content.
Performance issues directly impact user engagement and conversion rates.
Layout shifts occur when elements move absent any user interaction. Investigate the causes of layout shifts, such as elements being added, removed, or their fonts changing as the page loads.
Performance issues directly impact user engagement and conversion rates.
Your first network request is the most important. Reduce its latency by avoiding redirects, ensuring a fast server response, and enabling text compression.
Performance issues directly impact user engagement and conversion rates.
A forced reflow occurs when JavaScript queries geometric properties (such as offsetWidth) after styles have been invalidated by a change to the DOM state. This can result in poor performance. Learn more about forced reflows and possible mitigations.
Performance issues directly impact user engagement and conversion rates.
Optimize LCP by making the LCP image discoverable from the HTML immediately, and avoiding lazy-loading
Performance issues directly impact user engagement and conversion rates.
Avoid chaining critical requests by reducing the length of chains, reducing the download size of resources, or deferring the download of unnecessary resources to improve page load.
Performance issues directly impact user engagement and conversion rates.
A long cache lifetime can speed up repeat visits to your page. Learn more about caching.
Performance issues directly impact user engagement and conversion rates.
| Request | Cache TTL | Transfer Size |
|---|---|---|
| /content/dam/bp/business-sites/en/global/corporate/images... | 0.0 ms | 65.2 KiB |
| /content/dam/bp/country-sites/en_nz/new-zealand/home/imag... | 0.0 ms | 12.2 KiB |
| /content/dam/bp/business-sites/en/global/corporate/images... | 0.0 ms | 1.3 KiB |
| /content/dam/bp/business-sites/en/global/corporate/images... | 0.0 ms | 1023 B |
| /content/dam/bp/business-sites/en/global/corporate/images... | 0.0 ms | 888 B |
| /content/dam/bp/business-sites/en/global/corporate/images... | 0.0 ms | 776 B |
| /content/dam/bp/country-sites/en_nz/new-zealand/home/imag... | 0.0 ms | 630 B |
Reducing the download time of images can improve the perceived load time of the page and LCP. Learn more about optimizing image size
Performance issues directly impact user engagement and conversion rates.
| URL | Resource Size | Est Savings | |
|---|---|---|---|
Inspection of seismic imagery div.slick-slide > div > div.nr-feature-carousel__item > img.nr-feature-carousel__media | /content/dam/bp/business-sites/en/global/corporate/images... | 64.8 KiB | 17.3 KiB |
These insights are also available in the Chrome DevTools Performance Panel - record a trace to view more detailed information.
Redirects introduce additional delays before the page can be loaded. Learn how to avoid page redirects.
Performance issues directly impact user engagement and conversion rates.
| URL | Time Spent |
|---|---|
| bp.com/ | 1.3 s |
| www.bp.com/ | 0.0 ms |
These are the largest layout shifts observed on the page. Each table item represents a single layout shift, and shows the element that shifted the most. Below each item are possible root causes that led to the layout shift. Some of these layout shifts may not be included in the CLS metric value due to windowing. Learn how to improve CLS
Performance issues directly impact user engagement and conversion rates.
| Element | Layout shift score |
|---|---|
Site traffic information and cookies
We use cookies to collect and analyse inf… body.nr-navigation--presence > div.aem-Grid | 0.390 |
Key documents
Country websites
Frequent searches body.nr-navigation--presence > div.aem-Grid > div.nr-layout-component | 0.146 |
Key documents
Country websites
Frequent searches body.nr-navigation--presence > div.aem-Grid > div.nr-layout-component | 0.073 |
Key documents
Country websites
Frequent searches body.nr-navigation--presence > div.aem-Grid > div.nr-layout-component | 0.061 |
GBp 563.6 (+6.7)
USD 45.91 (+0.79)* div.nr-navigation-component > aside.nr-navigation > div.nr-navigation__inner > div.nr-navigation__shareprice | 0.003 |
The maximum potential First Input Delay that your users could experience is the duration of the longest task. Learn more about the Maximum Potential First Input Delay metric.
Performance issues directly impact user engagement and conversion rates.
Time to Interactive is the amount of time it takes for the page to become fully interactive. Learn more about the Time to Interactive metric.
Performance issues directly impact user engagement and conversion rates.
Reduce unused rules from stylesheets and defer CSS not used for above-the-fold content to decrease bytes consumed by network activity. Learn how to reduce unused CSS.
Performance issues directly impact user engagement and conversion rates.
| URL | Transfer Size | Est Savings |
|---|---|---|
| www.bp.com/apps/settings/wcm/designs/refresh/bp/assets.css | 48.6 KiB | 43.4 KiB |
Reduce unused JavaScript and defer loading scripts until they are required to decrease bytes consumed by network activity. Learn how to reduce unused JavaScript.
Multi-megabyte JavaScript bundles delay every interactive feature on the page.
This is the Lighthouse audit fired when too much JS is shipped relative to what executes. The fix isn't a config flag — it requires bundle analysis (webpack-bundle-analyzer, rollup-plugin-visualizer), splitting routes into chunks, lazy-loading off-screen components, and removing unused dependencies. Fundamentally different from minification: minifying reduces byte count, this reduces what's downloaded at all.
Source: Google web.dev / Lighthouse
| URL | Transfer Size | Est Savings |
|---|---|---|
| www.bp.com/apps/settings/wcm/designs/refresh/bp/assets.js | 327.9 KiB | 250.8 KiB |
Minifying JavaScript files can reduce payload sizes and script parse time. Learn how to minify JavaScript.
Performance issues directly impact user engagement and conversion rates.
| URL | Transfer Size | Est Savings |
|---|---|---|
| inline: var navDataArr = [ { … | 59.8 KiB | 22.3 KiB |
Set an explicit width and height on image elements to reduce layout shifts and improve CLS. Learn how to set image dimensions
Performance issues directly impact user engagement and conversion rates.
| URL | |
|---|---|
icon ul.nr-navigation__list > li.nr-navigation__list-item > a.nr-navigation__quick-link > img.nr-navigation__icon | /content/dam/bp/business-sites/en/global/corporate/images... |
icon ul.nr-navigation__list > li.nr-navigation__list-item > a.nr-navigation__quick-link > img.nr-navigation__icon | /content/dam/bp/business-sites/en/global/corporate/images... |
More information about the performance of your application. These numbers don't directly affect the Performance score.
These checks highlight opportunities to improve the accessibility of your web app. Automatic detection can only detect a subset of issues and does not guarantee the accessibility of your web app, so manual testing is also encouraged.
Low-contrast text is difficult or impossible for many users to read. Link text that is discernible improves the experience for users with low vision. Learn how to make links distinguishable.
Performance issues directly impact user engagement and conversion rates.
| Failing Elements |
|---|
Disclaimer div.nr-footer__content > div.nr-row > div.nr-footer__disclaimer > a.nr-footer__disclaimer-title |
These are opportunities to improve the legibility of your content.
Source maps translate minified code to the original source code. This helps developers debug in production. In addition, Lighthouse is able to provide further insights. Consider deploying source maps to take advantage of these benefits. Learn more about source maps.
Performance issues directly impact user engagement and conversion rates.
These checks ensure that your page is following basic search engine optimization advice. There are many additional factors Lighthouse does not score here that may affect your search ranking, including performance on Core Web Vitals. Learn more about Google Search Essentials.
Descriptive link text helps search engines understand your content. Learn how to make links more accessible.
Performance issues directly impact user engagement and conversion rates.
| Link destination | Link Text |
|---|---|
| /en/global/corporate/news-and-insights/energy-in-focus/hi... | Read more |
Format your HTML in a way that enables crawlers to better understand your app’s content.
Industry-standard audits powered by Google Lighthouse. — Desktop
Key metrics that affect user experience. — Desktop
First Contentful Paint First Contentful Paint — how long until the browser renders the first piece of content. Under 1.8s is good.
1.22 s
Largest Contentful Paint Largest Contentful Paint — how long until the largest visible element loads. Under 2.5s is good.
2.06 s
Total Blocking Time Total Blocking Time — total time the main thread was blocked, preventing user input. Under 200ms is good.
23 ms
Cumulative Layout Shift Cumulative Layout Shift — measures visual stability. How much the page layout shifts during loading. Under 0.1 is good.
0.276
Speed Index Speed Index — how quickly content is visually displayed during load. Under 3.4s is good.
1.68 s
Time to Interactive Time to Interactive — how long until the page is fully interactive and responds to user input. Under 3.8s is good.
2.06 s
Audit breakdown by category with detailed findings.
Remove large, duplicate JavaScript modules from bundles to reduce unnecessary bytes consumed by network activity.
Performance issues directly impact user engagement and conversion rates.
Polyfills and transforms enable older browsers to use new JavaScript features. However, many aren't necessary for modern browsers. Consider modifying your JavaScript build process to not transpile Baseline features, unless you know you must support older browsers. Learn why most sites can deploy ES6+ code without transpiling
Shipping ES5 transpiled code to modern browsers wastes bytes — every user with an evergreen browser pays for compatibility you don't need.
Most users today run browsers that natively support ES6+, async/await, optional chaining, and the rest of modern JavaScript. Transpiling to ES5 'just in case' adds 20-40% to your bundle for no benefit. Configure your build to target a modern browserslist, or ship a differential bundle pair (modern + legacy) with the module/nomodule pattern.
Source: Google web.dev / Lighthouse
3rd party code can significantly impact load performance. Reduce and defer loading of 3rd party code to prioritize your page's content.
Performance issues directly impact user engagement and conversion rates.
A long cache lifetime can speed up repeat visits to your page. Learn more about caching.
Performance issues directly impact user engagement and conversion rates.
| Request | Cache TTL | Transfer Size |
|---|---|---|
| /content/dam/bp/business-sites/en/global/corporate/images... | 0.0 ms | 110.8 KiB |
| /content/dam/bp/business-sites/en/global/corporate/images... | 0.0 ms | 67.1 KiB |
| /content/dam/bp/business-sites/en/global/corporate/images... | 0.0 ms | 13.8 KiB |
| /content/dam/bp/business-sites/en/global/corporate/images... | 0.0 ms | 8.6 KiB |
| /content/dam/bp/country-sites/en_nz/new-zealand/home/imag... | 0.0 ms | 3.8 KiB |
| /content/dam/bp/business-sites/en/global/corporate/images... | 0.0 ms | 1.3 KiB |
| /content/dam/bp/business-sites/en/global/corporate/images... | 0.0 ms | 1.0 KiB |
| /content/dam/bp/business-sites/en/global/corporate/images... | 0.0 ms | 891 B |
| /content/dam/bp/business-sites/en/global/corporate/images... | 0.0 ms | 781 B |
| /content/dam/bp/country-sites/en_nz/new-zealand/home/imag... | 0.0 ms | 635 B |
Layout shifts occur when elements move absent any user interaction. Investigate the causes of layout shifts, such as elements being added, removed, or their fonts changing as the page loads.
Performance issues directly impact user engagement and conversion rates.
Your first network request is the most important. Reduce its latency by avoiding redirects, ensuring a fast server response, and enabling text compression.
Performance issues directly impact user engagement and conversion rates.
A forced reflow occurs when JavaScript queries geometric properties (such as offsetWidth) after styles have been invalidated by a change to the DOM state. This can result in poor performance. Learn more about forced reflows and possible mitigations.
Performance issues directly impact user engagement and conversion rates.
Optimize LCP by making the LCP image discoverable from the HTML immediately, and avoiding lazy-loading
Performance issues directly impact user engagement and conversion rates.
Avoid chaining critical requests by reducing the length of chains, reducing the download size of resources, or deferring the download of unnecessary resources to improve page load.
Performance issues directly impact user engagement and conversion rates.
Reducing the download time of images can improve the perceived load time of the page and LCP. Learn more about optimizing image size
Performance issues directly impact user engagement and conversion rates.
| URL | Resource Size | Est Savings | |
|---|---|---|---|
Inspection of seismic imagery div.slick-slide > div > div.nr-feature-carousel__item > img.nr-feature-carousel__media | /content/dam/bp/business-sites/en/global/corporate/images... | 110.4 KiB | 14.2 KiB |
These insights are also available in the Chrome DevTools Performance Panel - record a trace to view more detailed information.
Reduce unused rules from stylesheets and defer CSS not used for above-the-fold content to decrease bytes consumed by network activity. Learn how to reduce unused CSS.
Performance issues directly impact user engagement and conversion rates.
| URL | Transfer Size | Est Savings |
|---|---|---|
| www.bp.com/apps/settings/wcm/designs/refresh/bp/assets.css | 48.7 KiB | 43.1 KiB |
Reduce unused JavaScript and defer loading scripts until they are required to decrease bytes consumed by network activity. Learn how to reduce unused JavaScript.
Multi-megabyte JavaScript bundles delay every interactive feature on the page.
This is the Lighthouse audit fired when too much JS is shipped relative to what executes. The fix isn't a config flag — it requires bundle analysis (webpack-bundle-analyzer, rollup-plugin-visualizer), splitting routes into chunks, lazy-loading off-screen components, and removing unused dependencies. Fundamentally different from minification: minifying reduces byte count, this reduces what's downloaded at all.
Source: Google web.dev / Lighthouse
| URL | Transfer Size | Est Savings |
|---|---|---|
| www.bp.com/apps/settings/wcm/designs/refresh/bp/assets.js | 327.9 KiB | 250.8 KiB |
Minifying JavaScript files can reduce payload sizes and script parse time. Learn how to minify JavaScript.
Performance issues directly impact user engagement and conversion rates.
| URL | Transfer Size | Est Savings |
|---|---|---|
| inline: var navDataArr = [ { … | 59.8 KiB | 22.3 KiB |
More information about the performance of your application. These numbers don't directly affect the Performance score.
Redirects introduce additional delays before the page can be loaded. Learn how to avoid page redirects.
Performance issues directly impact user engagement and conversion rates.
| URL | Time Spent |
|---|---|
| bp.com/ | 795 ms |
| www.bp.com/ | 0.0 ms |
These are the largest layout shifts observed on the page. Each table item represents a single layout shift, and shows the element that shifted the most. Below each item are possible root causes that led to the layout shift. Some of these layout shifts may not be included in the CLS metric value due to windowing. Learn how to improve CLS
Performance issues directly impact user engagement and conversion rates.
| Element | Layout shift score |
|---|---|
body.nr-navigation--presence > ::after body.nr-navigation--presence > ::after | 0.113 |
Hidden depths: Finding energy for tomorrow, today
Helping to supply the world… body.nr-navigation--presence > div.aem-Grid > div#featureCarousel > section.nr-feature-carousel | 0.035 |
Hidden depths: Finding energy for tomorrow, today
Helping to supply the world… body.nr-navigation--presence > div.aem-Grid > div#featureCarousel > section.nr-feature-carousel | 0.021 |
Hidden depths: Finding energy for tomorrow, today
Helping to supply the world… body.nr-navigation--presence > div.aem-Grid > div#featureCarousel > section.nr-feature-carousel | 0.018 |
Hidden depths: Finding energy for tomorrow, today
Helping to supply the world… body.nr-navigation--presence > div.aem-Grid > div#featureCarousel > section.nr-feature-carousel | 0.017 |
Hidden depths: Finding energy for tomorrow, today
Helping to supply the world… body.nr-navigation--presence > div.aem-Grid > div#featureCarousel > section.nr-feature-carousel | 0.013 |
Key documents
Country websites
Frequent searches body.nr-navigation--presence > div.aem-Grid > div.nr-layout-component | 0.010 |
Hidden depths: Finding energy for tomorrow, today
Helping to supply the world… body.nr-navigation--presence > div.aem-Grid > div#featureCarousel > section.nr-feature-carousel | 0.010 |
Hidden depths: Finding energy for tomorrow, today
Helping to supply the world… body.nr-navigation--presence > div.aem-Grid > div#featureCarousel > section.nr-feature-carousel | 0.009 |
Hidden depths: Finding energy for tomorrow, today
Helping to supply the world… body.nr-navigation--presence > div.aem-Grid > div#featureCarousel > section.nr-feature-carousel | 0.007 |
Hidden depths: Finding energy for tomorrow, today
Helping to supply the world… body.nr-navigation--presence > div.aem-Grid > div#featureCarousel > section.nr-feature-carousel | 0.006 |
Hidden depths: Finding energy for tomorrow, today
Helping to supply the world… body.nr-navigation--presence > div.aem-Grid > div#featureCarousel > section.nr-feature-carousel | 0.005 |
Hidden depths: Finding energy for tomorrow, today
Helping to supply the world… body.nr-navigation--presence > div.aem-Grid > div#featureCarousel > section.nr-feature-carousel | 0.003 |
Hidden depths: Finding energy for tomorrow, today
Helping to supply the world… body.nr-navigation--presence > div.aem-Grid > div#featureCarousel > section.nr-feature-carousel | 0.002 |
Hidden depths: Finding energy for tomorrow, today
Helping to supply the world… body.nr-navigation--presence > div.aem-Grid > div#featureCarousel > section.nr-feature-carousel | 0.002 |
These checks highlight opportunities to improve the accessibility of your web app. Automatic detection can only detect a subset of issues and does not guarantee the accessibility of your web app, so manual testing is also encouraged.
Low-contrast text is difficult or impossible for many users to read. Link text that is discernible improves the experience for users with low vision. Learn how to make links distinguishable.
Performance issues directly impact user engagement and conversion rates.
| Failing Elements |
|---|
Disclaimer div.nr-footer__content > div.nr-row > div.nr-footer__disclaimer > a.nr-footer__disclaimer-title |
These are opportunities to improve the legibility of your content.
Source maps translate minified code to the original source code. This helps developers debug in production. In addition, Lighthouse is able to provide further insights. Consider deploying source maps to take advantage of these benefits. Learn more about source maps.
Performance issues directly impact user engagement and conversion rates.
These checks ensure that your page is following basic search engine optimization advice. There are many additional factors Lighthouse does not score here that may affect your search ranking, including performance on Core Web Vitals. Learn more about Google Search Essentials.
Descriptive link text helps search engines understand your content. Learn how to make links more accessible.
Performance issues directly impact user engagement and conversion rates.
| Link destination | Link Text |
|---|---|
| /en/global/corporate/news-and-insights/energy-in-focus/hi... | Read more |
Format your HTML in a way that enables crawlers to better understand your app’s content.
Send Feedback