Global Performance
6/6 locations ✓Acceptable global latency — average 333ms across 6 locations, fastest from Santa Clara (177ms), slowest from Madrid (425ms). Cloudflare edge cache (DYNAMIC). Cache-Control header is missing.
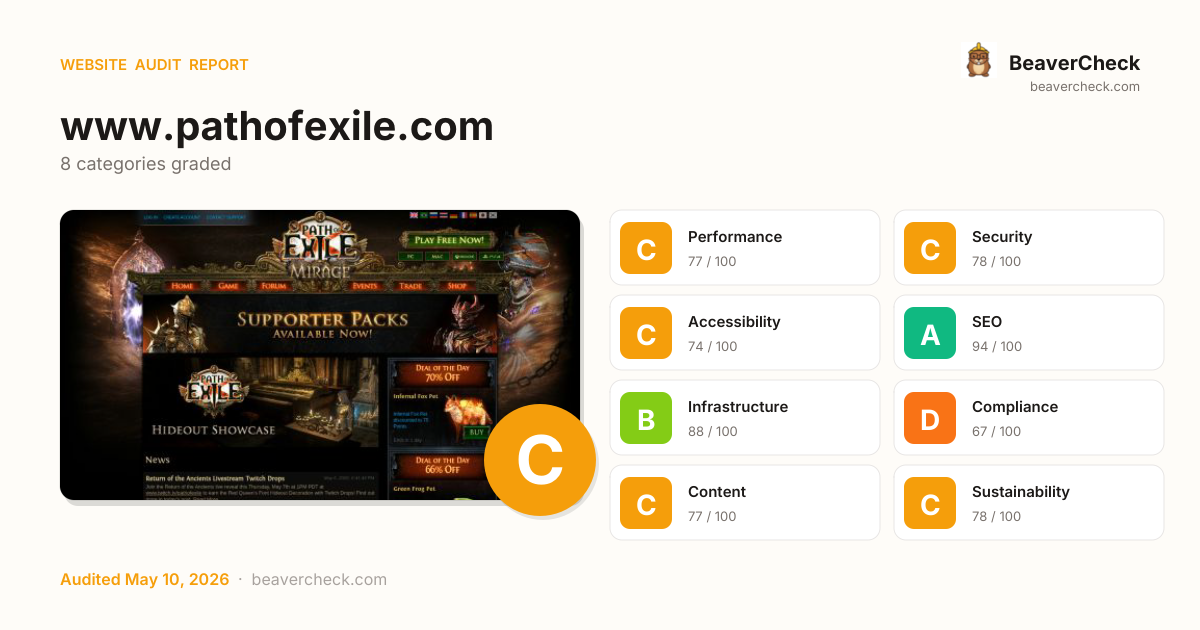
Audit overview
Compliance needs attention; the rest of the categories are in good shape.
Fix Priority Matrix
5 findingsQuick Wins
2High impact, low effort — start here.
Strategic
3High impact, requires investment.
Easy Improvements
0Small gains, minimal effort.
Nothing in this quadrant — good news.
Deprioritize
0Low impact, high effort — do last.
Nothing in this quadrant — good news.
Screenshots


Top Priorities (5)
Content-Security-Policy header is missing
Without a CSP, a single XSS bug can exfiltrate everything your users type — including credentials.
No Content-Security-Policy header found
Without a CSP, a single XSS bug can exfiltrate everything users type — credentials, payment data, session tokens.
2 image(s) missing alt attribute
Each image without alt text is a WCAG 1.1.1 failure — invisible to screen-reader users, lost from Google Image Search.
2 image-in-link without alt text
Image-only links with no alt create empty links — screen-reader users hear 'link' with no destination context.
3 button(s) with no accessible text
Buttons with no accessible text (icon-only, no aria-label) can't be activated by voice control or understood by screen readers.
Business case
What fixing the audit's findings is worth -- and what ignoring them keeps costing.
Return on investment
$850 investment → $10,134/month returns + USD 157,500 risk avoided
Figures combine localized regulatory fine ceilings, search/conversion value priced against local CPC, and bandwidth waste estimates. Results depend on implementation quality and audience composition. Not legal or financial advice.
Conversion barriers
9 barrier(s) likely increasing bounce by ~38%.
- Page takes 23.9s to loadUsers abandon at ~3s — you're 21.4s over the 2.5s threshold→ Optimize render-blocking resources, preload the hero image, and compress images
- No viewport meta tagMobile browsers render at desktop width and shrink — text unreadable, tap targets miniature→ Add <meta name="viewport" content="width=device-width, initial-scale=1">
- 4 broken link(s) on the pageClicks land on 404s — trust drops and the session often ends→ Fix or remove the broken destinations surfaced on the Content tab
- High main-thread blocking timePage is non-interactive for 449ms after first paint→ Defer third-party scripts and split large bundles
- No Content-Security-Policy headerHigher XSS blast radius — one compromised script can exfiltrate the checkout form→ Ship a reporting-only CSP first, then enforce once violations are clean
Preliminary CRO audit — each barrier links to the tab with detailed analysis.
Remediation cost
Start here for the best return on investment
Cost by category
Cost by effort level
Adjust assumptions
Team composition
Multiplier applied to dev hours to reflect QA, design, and PM overhead. Use Dev only for solo work; Full team for projects with formal review processes.
Rates reflect fully-loaded developer cost including overhead
Warning:Cost of inaction
Compliance Risk
$157,500
- 1 non-essential cookie(s) set without consent bannerCCPA/CPRA: USD 2,500 – USD 7,500
- Privacy Policy not detectedCCPA/CPRA: USD 2,500 – USD 7,500
- No <main> landmark foundADA Title III: USD 25,000 – USD 150,000
Bounce-Rate Cost
$10,133 /mo
+37.7pp bounce · ~3,767 lost visitors/mo
CPC: USD 2.69
Bandwidth Waste
$0.96 /mo
11948.3 MB/mo × 0.080 USD/GB
- Optimize transfer: save ~1.2 MB per page loadSaves $0.96/mo
Compliance figures represent the statutory maximum fine for the most severe triggered category, capped per regulation — not the sum of per-finding penalties. Based on published regulatory fine ranges. This is not legal advice.
Unique monthly visitors from your analytics
Purchases, signups, or key actions
Optional — for revenue estimation
more engaged visitors from reduced bounce
Fix 5 critical issues to capture this value
How this is calculated
Based on Google/Deloitte research ("Milliseconds Make Millions") showing a ~7% bounce rate increase per additional second of LCP above the 2.5s "Good" threshold.
Your site's LCP: → estimated after fixes.
These are estimates based on industry research — actual results vary
Your data stays in your browser — nothing is sent to our servers
Lighthouse
Mobile
First Contentful Paint First Contentful Paint — how long until the browser renders the first piece of content. Under 1.8s is good.
7.07 s
Largest Contentful Paint Largest Contentful Paint — how long until the largest visible element loads. Under 2.5s is good.
23.86 s
Total Blocking Time Total Blocking Time — total time the main thread was blocked, preventing user input. Under 200ms is good.
449 ms
Cumulative Layout Shift Cumulative Layout Shift — measures visual stability. How much the page layout shifts during loading. Under 0.1 is good.
0.144
Speed Index Speed Index — how quickly content is visually displayed during load. Under 3.4s is good.
7.34 s
Time to Interactive Time to Interactive — how long until the page is fully interactive and responds to user input. Under 3.8s is good.
23.88 s
Desktop
First Contentful Paint First Contentful Paint — how long until the browser renders the first piece of content. Under 1.8s is good.
1.38 s
Largest Contentful Paint Largest Contentful Paint — how long until the largest visible element loads. Under 2.5s is good.
2.58 s
Total Blocking Time Total Blocking Time — total time the main thread was blocked, preventing user input. Under 200ms is good.
11 ms
Cumulative Layout Shift Cumulative Layout Shift — measures visual stability. How much the page layout shifts during loading. Under 0.1 is good.
0.000
Speed Index Speed Index — how quickly content is visually displayed during load. Under 3.4s is good.
1.43 s
Time to Interactive Time to Interactive — how long until the page is fully interactive and responds to user input. Under 3.8s is good.
3.38 s
Categories
8Performance
All checks pass
Security
Content-Security-Policy header is missing
Accessibility
2 image(s) missing alt attribute
SEO
All checks pass
Infrastructure
All checks pass
Compliance
All checks pass
Content
All checks pass
Sustainability
All checks pass
How you compare
Where this site stands against peers running the same stack.
Technology stack
Backbone.js 0.9.2, with Cloudflare CDN
Stack Architecture
 Webpack
  Backbone.js 0.9.2
 Google Code Prettify HSTS
  NProgress 0.1.2
 Open Graph
  RequireJS 2.3.2
 Select2
  Underscore.js 1.8.3
 YouTube
  jQuery 1.11.3
 jQuery UI 1.11.4
 Cloudflare
 All Detected Technologies (13)
Cloudflare is a web-infrastructure and website-security company, providing content-delivery-network services, DDoS mitigation, Internet security, and distributed domain-name-server services.
BackboneJS is a JavaScript library that allows to develop and structure the client side applications that run in a web browser.
HTTP Strict Transport Security (HSTS) informs browsers that the site should only be accessed using HTTPS.
NProgress is a JavaScript library that displays a nanoscopic progress bar at the top of websites or web applications. It includes trickle animations to indicate loading activity, enhancing user experience by showing that content is being loaded.
Open Graph is a protocol that is used to integrate any web page into the social graph.
RequireJS is a JavaScript library and file loader which manages the dependencies between JavaScript files and in modular programming.
Select2 is a jQuery based replacement for select boxes. It supports searching, remote data sets, and infinite scrolling of results.
Underscore.js is a JavaScript library which provides utility functions for common programming tasks. It is comparable to features provided by Prototype.js and the Ruby language, but opts for a functional programming design instead of extending object prototypes.
YouTube is a video sharing service where users can create their own profile, upload videos, watch, like and comment on other videos.
jQuery is a JavaScript library which is a free, open-source software designed to simplify HTML DOM tree traversal and manipulation, as well as event handling, CSS animation, and Ajax.
jQuery UI is a collection of GUI widgets, animated visual effects, and themes implemented with jQuery, Cascading Style Sheets, and HTML.
Observations (2)
jQuery version may be outdated
Detected jQuery 1.11.3. The current major version is 3. Consider updating for security patches and new features.
Complex technology stack detected
13 technologies identified. A complex stack increases maintenance burden and attack surface. Consider whether all components are actively needed.
Show your score
Drop this badge on your README, marketing site, or status page. It auto-updates every time the audit re-runs and links back to this report.
This badge auto-updates with your latest scan result.
[](https://beavercheck.com/results/1f94291f-8efd-489d-a7d6-1bea89125597)<a href="https://beavercheck.com/results/1f94291f-8efd-489d-a7d6-1bea89125597"><img src="https://beavercheck.com/badge?url=https%3A%2F%2Fwww.pathofexile.com" alt="BeaverCheck Score"></a>https://beavercheck.com/badge?url=https%3A%2F%2Fwww.pathofexile.comExport & share
Download the audit, share with your team, or grab a fix plan ready to copy into your tracker.
Copies markdown to clipboard
Fix Plan
Three-week roadmap to ship the audit's findings, with one-click copy targets for your tracker.
Three-week fix plan
2 sprints · 8h total → projected B (87)
Sprint 1: Quick Wins
+3Highest ROI — low effort, high impact
- · 2 image-in-link without alt text
- · 3 button(s) with no accessible text
Sprint 2: Core Fixes
+5Medium effort, high structural impact
- · 2 image(s) missing alt attribute
- · Content-Security-Policy header is missing
- · No Content-Security-Policy header found