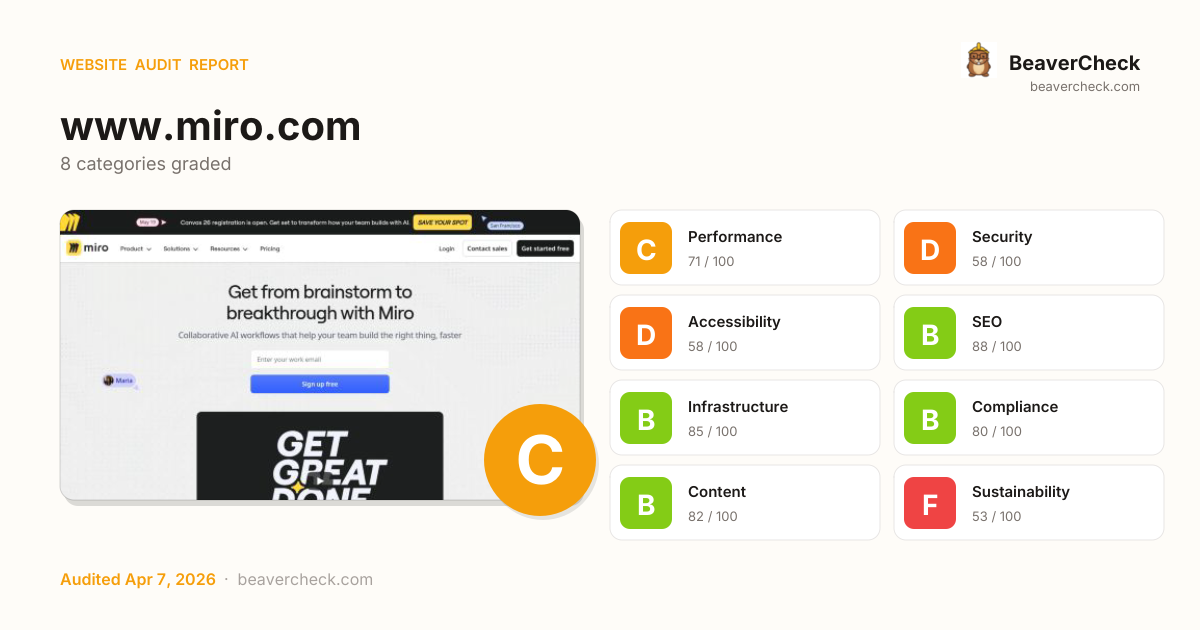
Audit overview
3 categories need attention: Security, and 2 others.
Fix Priority Matrix
5 findingsQuick Wins
2High impact, low effort — start here.
Strategic
3High impact, requires investment.
Easy Improvements
0Small gains, minimal effort.
Nothing in this quadrant — good news.
Deprioritize
0Low impact, high effort — do last.
Nothing in this quadrant — good news.
Screenshots


Top Priorities (5)
Content-Security-Policy header is missing
Without a CSP, a single XSS bug can exfiltrate everything your users type — including credentials.
HSTS header is missing
Without HSTS, a network attacker can downgrade the very first connection to HTTP and steal the user's session.
No Content-Security-Policy header found
Without a CSP, a single XSS bug can exfiltrate everything users type — credentials, payment data, session tokens.
Page weighs 29.4 MB (8.2 MB transferred)
Informational: total page weight (uncompressed) and bytes actually transferred over the wire.
2 image(s) missing alt attribute
Each image without alt text is a WCAG 1.1.1 failure — invisible to screen-reader users, lost from Google Image Search.
Business case
What fixing the audit's findings is worth -- and what ignoring them keeps costing.
Return on investment
€659 investment → €9,326/month returns + EUR 120,500,000 risk avoided
Figures combine localized regulatory fine ceilings, search/conversion value priced against local CPC, and bandwidth waste estimates. Results depend on implementation quality and audience composition. Not legal or financial advice.
Conversion barriers
8 barrier(s) likely increasing bounce by ~30%.
- Page takes 4.3s to loadUsers abandon at ~3s — you're 1.8s over the 2.5s threshold→ Optimize render-blocking resources, preload the hero image, and compress images
- Page feels frozen for 7.5sClicks on the primary CTA are ignored while JavaScript runs→ Break up long tasks; defer non-critical JavaScript to post-hydration
- 3 broken link(s) on the pageClicks land on 404s — trust drops and the session often ends→ Fix or remove the broken destinations surfaced on the Content tab
- No HSTS headerReturning visitors are briefly exposed to downgrade attacks on first request→ Set Strict-Transport-Security: max-age=31536000; includeSubDomains
- No Content-Security-Policy headerHigher XSS blast radius — one compromised script can exfiltrate the checkout form→ Ship a reporting-only CSP first, then enforce once violations are clean
Preliminary CRO audit — each barrier links to the tab with detailed analysis.
Remediation cost
Start here for the best return on investment
Cost by category
Cost by effort level
Adjust assumptions
Team composition
Multiplier applied to dev hours to reflect QA, design, and PM overhead. Use Dev only for solo work; Full team for projects with formal review processes.
Rates reflect fully-loaded developer cost including overhead
Warning:Cost of inaction
Compliance Risk
€120.500.000
- No privacy policy link detectedGDPR: EUR 10.000 – EUR 20.000.000
- 2 advertising/retargeting trackers detectedGDPR: EUR 10.000 – EUR 20.000.000
- Trackers detected but no cookie policy foundGDPR: EUR 5.000 – EUR 10.000.000
Bounce-Rate Cost
€6.674 /mo
+30.3pp bounce · ~3,034 lost visitors/mo
CPC: EUR 2.20
Bandwidth Waste
€1,92 /mo
25948.0 MB/mo × 0.074 EUR/GB
- Optimize transfer: save ~2.6 MB per page loadSaves €1,92/mo
Compliance figures represent the statutory maximum fine for the most severe triggered category, capped per regulation — not the sum of per-finding penalties. Based on published regulatory fine ranges. This is not legal advice.
Unique monthly visitors from your analytics
Purchases, signups, or key actions
Optional — for revenue estimation
more engaged visitors from reduced bounce
Fix 5 critical issues to capture this value
How this is calculated
Based on Google/Deloitte research ("Milliseconds Make Millions") showing a ~7% bounce rate increase per additional second of LCP above the 2.5s "Good" threshold.
Your site's LCP: → estimated after fixes.
These are estimates based on industry research — actual results vary
Your data stays in your browser — nothing is sent to our servers
Lighthouse
Mobile
First Contentful Paint First Contentful Paint — how long until the browser renders the first piece of content. Under 1.8s is good.
3.78 s
Largest Contentful Paint Largest Contentful Paint — how long until the largest visible element loads. Under 2.5s is good.
4.30 s
Total Blocking Time Total Blocking Time — total time the main thread was blocked, preventing user input. Under 200ms is good.
7.50 s
Cumulative Layout Shift Cumulative Layout Shift — measures visual stability. How much the page layout shifts during loading. Under 0.1 is good.
0.017
Speed Index Speed Index — how quickly content is visually displayed during load. Under 3.4s is good.
13.93 s
Time to Interactive Time to Interactive — how long until the page is fully interactive and responds to user input. Under 3.8s is good.
40.19 s
Desktop
First Contentful Paint First Contentful Paint — how long until the browser renders the first piece of content. Under 1.8s is good.
1.19 s
Largest Contentful Paint Largest Contentful Paint — how long until the largest visible element loads. Under 2.5s is good.
1.33 s
Total Blocking Time Total Blocking Time — total time the main thread was blocked, preventing user input. Under 200ms is good.
19.91 s
Cumulative Layout Shift Cumulative Layout Shift — measures visual stability. How much the page layout shifts during loading. Under 0.1 is good.
0.003
Speed Index Speed Index — how quickly content is visually displayed during load. Under 3.4s is good.
3.36 s
Time to Interactive Time to Interactive — how long until the page is fully interactive and responds to user input. Under 3.8s is good.
43.94 s
Categories
8Performance
Page weighs 29.4 MB (8.2 MB transferred)
Security
Content-Security-Policy header is missing
Accessibility
2 image(s) missing alt attribute
SEO
All checks pass
Infrastructure
All checks pass
Compliance
All checks pass
Content
All checks pass
Sustainability
All checks pass
How you compare
Where this site stands against peers running the same stack.
Top 10% of WordPress sites score 90+ on Sustainability; you're at 53 — closing this gap is the highest-leverage improvement.
Technology stack
Framer Sites, hosted on AWS, with AWS CloudFront CDN
Stack Architecture
 Audiohook
  Facebook Pixel
  Google Analytics
  Google Tag Manager
  Linkedin Insight Tag
  Microsoft Advertising
  Microsoft Clarity
  Quora Pixel
  Framer Sites
  WordPress
  Framer Motion
  Google Font API
  HTTP/3 Hotjar
  Lucide OneTrust
  Open Graph
  Priority Hints
  Radix UI
  React
React  Tailwind CSS
  TechTarget
  YouTube
  lit-element 3.3.3 lit-html 2.8.0
 shadcn/ui
  AWS CloudFront Amazon CloudFront
  Reditus
  AWS Amazon Web Services
 All Detected Technologies (32)
Amazon CloudFront is a fast content delivery network (CDN) service that securely delivers data, videos, applications, and APIs to customers globally with low latency, high transfer speeds.
Reditus is a partner management tool for B2B SaaS companies.
Amazon Web Services (AWS) is a comprehensive cloud services platform offering compute power, database storage, content delivery and other functionality.
Framer is primarily a design and prototyping tool. It allows you to design interactive prototypes of websites and applications using production components and real data.
Framer Motion is a modern animation library for JavaScript, React, and Vue.
Google Font API is a web service that supports open-source font files that can be used on your web designs.
HTTP/3 is the third major version of the Hypertext Transfer Protocol used to exchange information on the World Wide Web.
Lucide is an open-source icon library that provides 1000+ vector (svg) files for displaying icons and symbols in digital and non-digital projects.
Open Graph is a protocol that is used to integrate any web page into the social graph.
Priority Hints exposes a mechanism for developers to signal a relative priority for browsers to consider when fetching resources.
Radix UI is a React-based user interface component library that offers accessible, responsive, and customisable components for building web applications.
React is an open-source JavaScript library for building user interfaces or UI components.
Tailwind is a utility-first CSS framework for rapidly building custom user interfaces.
TechTarget is a resource providing technology professionals and buyers with the technical information required to perform in their roles.
YouTube is a video sharing service where users can create their own profile, upload videos, watch, like and comment on other videos.
lit-element is a simple base class for creating web components that work in any web page with any framework. lit-element uses lit-html to render into shadow DOM, and adds API to manage properties and attributes.
lit-html is a simple, modern, safe, small and fast HTML templating library for JavaScript.
shadcn/ui is a component system built with Radix UI and Tailwind CSS.
Audiohook specializes in programmatic audio advertising.
Facebook pixel is an analytics tool that allows you to measure the effectiveness of your advertising.
Google Analytics is a free web analytics service that tracks and reports website traffic.
Google Tag Manager is a tag management system (TMS) that allows you to quickly and easily update measurement codes and related code fragments collectively known as tags on your website or mobile app.
LinkedIn Insight Tag is a lightweight JavaScript tag that powers conversion tracking, website audiences, and website demographics.
Microsoft Advertising is an online advertising platform developed by Microsoft.
Microsoft's Clarity is a analytics tool which provides website usage statistics, session recording, and heatmaps.
Quora Pixel is a tool that is placed in your website code to track traffic and conversions.
Observations (3)
WordPress detected — review security configuration
WordPress sites benefit from: protecting wp-login.php, disabling XML-RPC if unused, restricting REST API access, and keeping all plugins and themes up to date. Check the Security tab for specific findings.
No build tool detected
A framework (Facebook SDK) was detected but no bundler was identified. The build tool may not be detectable from output patterns, or the site may use the framework's built-in bundler.
Complex technology stack detected
32 technologies identified. A complex stack increases maintenance burden and attack surface. Consider whether all components are actively needed.
Show your score
Drop this badge on your README, marketing site, or status page. It auto-updates every time the audit re-runs and links back to this report.
This badge auto-updates with your latest scan result.
[](https://beavercheck.com/results/20eecabf-0fd2-5aa8-b1e6-7a4c727c68b8)<a href="https://beavercheck.com/results/20eecabf-0fd2-5aa8-b1e6-7a4c727c68b8"><img src="https://beavercheck.com/badge?url=https%3A%2F%2Fwww.miro.com" alt="BeaverCheck Score"></a>https://beavercheck.com/badge?url=https%3A%2F%2Fwww.miro.comExport & share
Download the audit, share with your team, or grab a fix plan ready to copy into your tracker.
Copies markdown to clipboard
Fix Plan
Three-week roadmap to ship the audit's findings, with one-click copy targets for your tracker.
Three-week fix plan
2 sprints · 8h total → projected B (80)
Sprint 1: Quick Wins
+5Highest ROI — low effort, high impact
- · Page weighs 29.4 MB (8.2 MB transferred)
- · HSTS header is missing
Sprint 2: Core Fixes
+5Medium effort, high structural impact
- · 2 image(s) missing alt attribute
- · Content-Security-Policy header is missing
- · No Content-Security-Policy header found