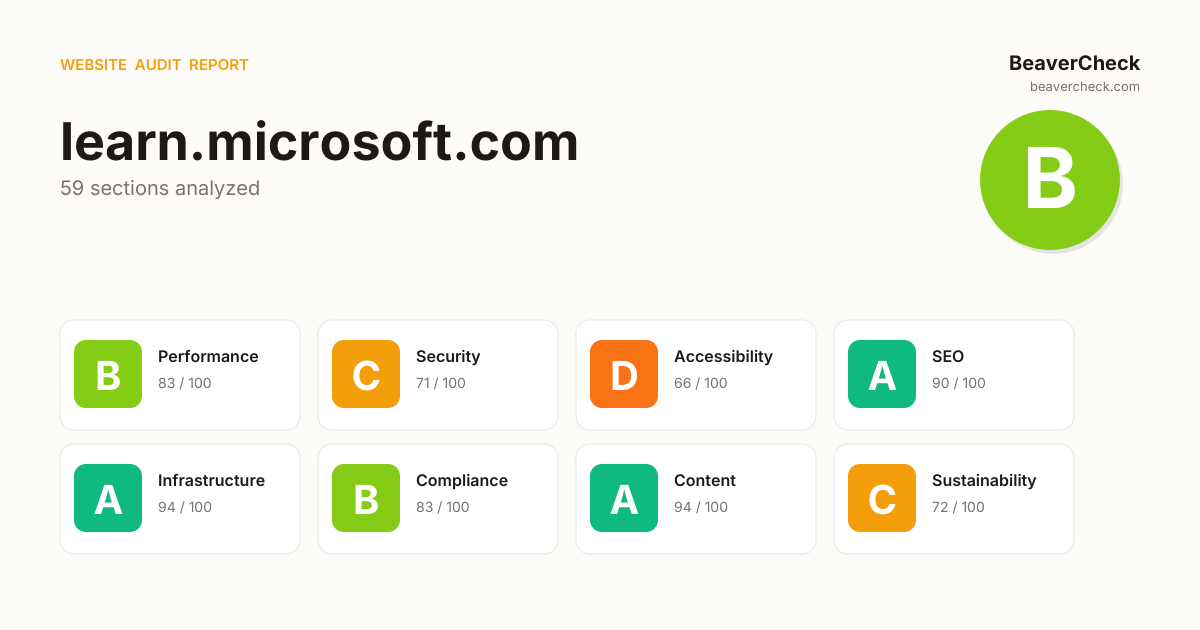
Audit overview
Accessibility needs attention; the rest of the categories are in good shape.
Fix Priority Matrix
5 findingsQuick Wins
1High impact, low effort — start here.
Strategic
4High impact, requires investment.
Easy Improvements
0Small gains, minimal effort.
Nothing in this quadrant — good news.
Deprioritize
0Low impact, high effort — do last.
Nothing in this quadrant — good news.
Screenshots


Top Priorities (5)
'unsafe-eval' found in script source
Unsafe value (unsafe-inline, unsafe-eval) in script-src defeats CSP's main protection — XSS injections can execute again.
'unsafe-inline' found in script source
Unsafe value (unsafe-inline, unsafe-eval) in script-src defeats CSP's main protection — XSS injections can execute again.
2 button(s) with no accessible text
Buttons with no accessible text (icon-only, no aria-label) can't be activated by voice control or understood by screen readers.
3 control(s) without accessible label
Form controls without labels — assistive tech announces 'edit text' with no context; users can't complete forms.
Cross-Origin-Embedder-Policy header is missing
COEP enforces that all embedded resources opt-in to cross-origin embedding — required for cross-origin isolation features.
Business case
What fixing the audit's findings is worth -- and what ignoring them keeps costing.
Return on investment
$1,450 investment → $9,709/month returns + USD 150,000 risk avoided
Figures combine localized regulatory fine ceilings, search/conversion value priced against local CPC, and bandwidth waste estimates. Results depend on implementation quality and audience composition. Not legal or financial advice.
Conversion barriers
4 barrier(s) likely increasing bounce by ~25%.
- Page takes 12.3s to loadUsers abandon at ~3s — you're 9.8s over the 2.5s threshold→ Optimize render-blocking resources, preload the hero image, and compress images
- 3 form field(s) without a labelScreen readers skip unlabeled fields; autofill can't identify them; checkout abandonment spikes→ Associate every input with a visible <label for="…">; add autocomplete attributes
- No Content-Security-Policy headerHigher XSS blast radius — one compromised script can exfiltrate the checkout form→ Ship a reporting-only CSP first, then enforce once violations are clean
- Content is hard to readGraduate-level reading difficulty — limits the addressable audience for product or blog pages→ Shorten sentences; replace jargon with plain language; target Flesch ease ≥60
Preliminary CRO audit — each barrier links to the tab with detailed analysis.
Remediation cost
Start here for the best return on investment
Cost by category
Cost by effort level
Adjust assumptions
Team composition
Multiplier applied to dev hours to reflect QA, design, and PM overhead. Use Dev only for solo work; Full team for projects with formal review processes.
Rates reflect fully-loaded developer cost including overhead
Warning:Cost of inaction
Compliance Risk
$150,000
- 3 control(s) without accessible labelADA Title III: USD 25,000 – USD 150,000
Bounce-Rate Cost
$6,771 /mo
+25.2pp bounce · ~2,517 lost visitors/mo
CPC: USD 2.69
Bandwidth Waste
$0.49 /mo
6135.6 MB/mo × 0.080 USD/GB
- Optimize transfer: save ~614 KB per page loadSaves $0.49/mo
Compliance figures represent the statutory maximum fine for the most severe triggered category, capped per regulation — not the sum of per-finding penalties. Based on published regulatory fine ranges. This is not legal advice.
Unique monthly visitors from your analytics
Purchases, signups, or key actions
Optional — for revenue estimation
more engaged visitors from reduced bounce
Fix 4 critical issues to capture this value
How this is calculated
Based on Google/Deloitte research ("Milliseconds Make Millions") showing a ~7% bounce rate increase per additional second of LCP above the 2.5s "Good" threshold.
Your site's LCP: → estimated after fixes.
These are estimates based on industry research — actual results vary
Your data stays in your browser — nothing is sent to our servers
Lighthouse
Mobile
First Contentful Paint First Contentful Paint — how long until the browser renders the first piece of content. Under 1.8s is good.
10.81 s
Largest Contentful Paint Largest Contentful Paint — how long until the largest visible element loads. Under 2.5s is good.
12.28 s
Total Blocking Time Total Blocking Time — total time the main thread was blocked, preventing user input. Under 200ms is good.
101 ms
Cumulative Layout Shift Cumulative Layout Shift — measures visual stability. How much the page layout shifts during loading. Under 0.1 is good.
0.004
Speed Index Speed Index — how quickly content is visually displayed during load. Under 3.4s is good.
10.81 s
Time to Interactive Time to Interactive — how long until the page is fully interactive and responds to user input. Under 3.8s is good.
12.34 s
Desktop
First Contentful Paint First Contentful Paint — how long until the browser renders the first piece of content. Under 1.8s is good.
1.30 s
Largest Contentful Paint Largest Contentful Paint — how long until the largest visible element loads. Under 2.5s is good.
2.45 s
Total Blocking Time Total Blocking Time — total time the main thread was blocked, preventing user input. Under 200ms is good.
42 ms
Cumulative Layout Shift Cumulative Layout Shift — measures visual stability. How much the page layout shifts during loading. Under 0.1 is good.
0.001
Speed Index Speed Index — how quickly content is visually displayed during load. Under 3.4s is good.
1.83 s
Time to Interactive Time to Interactive — how long until the page is fully interactive and responds to user input. Under 3.8s is good.
2.70 s
Categories
8Performance
All checks pass
Security
'unsafe-eval' found in script source
Accessibility
2 button(s) with no accessible text
SEO
All checks pass
Infrastructure
All checks pass
Compliance
All checks pass
Content
All checks pass
Sustainability
All checks pass
How you compare
Where this site stands against peers running the same stack.
Technology stack
Arkose Labs, hosted on Azure, with Azure CDN CDN
Stack Architecture
 Azure Monitor
  Arkose Labs Azure Edge Network Azure Front Door
  Bulma HSTS
  Open Graph
  Tailwind CSS
  lit-html 1.4.1 Azure CDN Azure
 All Detected Technologies (11)
Azure is a cloud computing service for building, testing, deploying, and managing applications and services through Microsoft-managed data centers.
Arkose Labs is a toolkit for fraud prevention that provides solutions to detect and mitigate malicious activity across digital platforms.
Azure Edge Network is a global network infrastructure provided by Microsoft Azure. It is designed to deliver content, applications, and services to end-users with low latency and high performance. The Azure Edge Network consists of a combination of Azure Content Delivery Network (CDN), Azure Front Door, and Azure Traffic Manager.
Azure Front Door is a scalable and secure entry point for fast delivery of your global web applications.
HTTP Strict Transport Security (HSTS) informs browsers that the site should only be accessed using HTTPS.
Open Graph is a protocol that is used to integrate any web page into the social graph.
lit-html is a simple, modern, safe, small and fast HTML templating library for JavaScript.
Azure Monitor collects monitoring telemetry from a variety of on-premises and Azure sources. Azure Monitor helps you maximise the availability and performance of your applications and services.
Observations (2)
No build tool detected
A framework (Arkose Labs) was detected but no bundler was identified. The build tool may not be detectable from output patterns, or the site may use the framework's built-in bundler.
Complex technology stack detected
11 technologies identified. A complex stack increases maintenance burden and attack surface. Consider whether all components are actively needed.
Show your score
Drop this badge on your README, marketing site, or status page. It auto-updates every time the audit re-runs and links back to this report.
This badge auto-updates with your latest scan result.
[](https://beavercheck.com/sites/microsoft.com)<a href="https://beavercheck.com/sites/microsoft.com"><img src="https://beavercheck.com/badge?url=https%3A%2F%2Flearn.microsoft.com" alt="BeaverCheck Score"></a>https://beavercheck.com/badge?url=https%3A%2F%2Flearn.microsoft.comExport & share
Download the audit, share with your team, or grab a fix plan ready to copy into your tracker.
Copies markdown to clipboard
Fix Plan
Three-week roadmap to ship the audit's findings, with one-click copy targets for your tracker.
Three-week fix plan
3 sprints · 14h total → projected B (87)
Sprint 1: Quick Wins
+1Highest ROI — low effort, high impact
- · 2 button(s) with no accessible text
Sprint 2: Core Fixes
+3Medium effort, high structural impact
- · 3 control(s) without accessible label
- · Cross-Origin-Embedder-Policy header is missing
Sprint 3: Strategic Improvements
+3Higher effort, long-term payoff
- · 'unsafe-eval' found in script source
- · 'unsafe-inline' found in script source