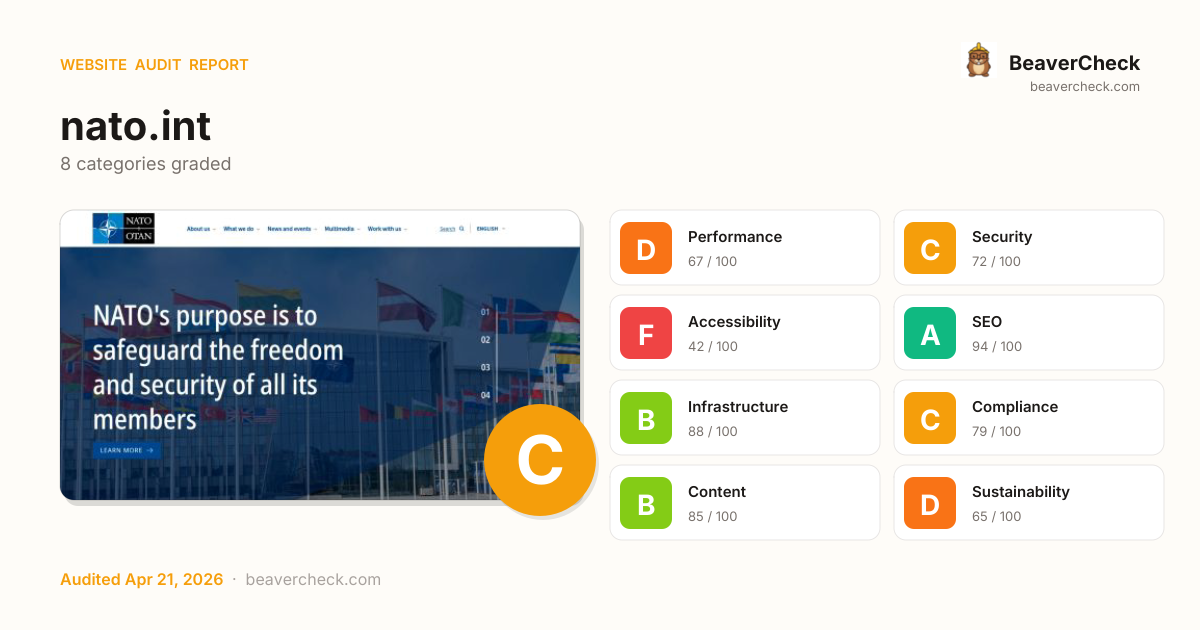
Audit overview
3 categories need attention: Performance, and 2 others.
Fix Priority Matrix
5 findingsQuick Wins
2High impact, low effort — start here.
Strategic
3High impact, requires investment.
Easy Improvements
0Small gains, minimal effort.
Nothing in this quadrant — good news.
Deprioritize
0Low impact, high effort — do last.
Nothing in this quadrant — good news.
Screenshots


Top Priorities (5)
'unsafe-inline' found in script source
Unsafe value (unsafe-inline, unsafe-eval) in script-src defeats CSP's main protection — XSS injections can execute again.
Page weighs 11.4 MB (6.8 MB transferred)
Informational: total page weight (uncompressed) and bytes actually transferred over the wire.
15 control(s) without accessible label
Form controls without labels — assistive tech announces 'edit text' with no context; users can't complete forms.
2 button(s) with no accessible text
Buttons with no accessible text (icon-only, no aria-label) can't be activated by voice control or understood by screen readers.
3 image(s) missing alt attribute
Each image without alt text is a WCAG 1.1.1 failure — invisible to screen-reader users, lost from Google Image Search.
Business case
What fixing the audit's findings is worth -- and what ignoring them keeps costing.
Return on investment
€720 investment → €7,576/month returns + EUR 120,500,000 risk avoided
Figures combine localized regulatory fine ceilings, search/conversion value priced against local CPC, and bandwidth waste estimates. Results depend on implementation quality and audience composition. Not legal or financial advice.
Conversion barriers
9 barrier(s) likely increasing bounce by ~34%.
- Page takes 17.0s to loadUsers abandon at ~3s — you're 14.5s over the 2.5s threshold→ Optimize render-blocking resources, preload the hero image, and compress images
- Page feels frozen for 1.7sClicks on the primary CTA are ignored while JavaScript runs→ Break up long tasks; defer non-critical JavaScript to post-hydration
- Severe layout shift during page loadUsers mis-click when content jumps — converting intent into frustration→ Reserve space for images, ads, and embeds with explicit width/height
- 15 form field(s) without a labelScreen readers skip unlabeled fields; autofill can't identify them; checkout abandonment spikes→ Associate every input with a visible <label for="…">; add autocomplete attributes
- No HSTS headerReturning visitors are briefly exposed to downgrade attacks on first request→ Set Strict-Transport-Security: max-age=31536000; includeSubDomains
Preliminary CRO audit — each barrier links to the tab with detailed analysis.
Remediation cost
Start here for the best return on investment
Cost by category
Cost by effort level
Adjust assumptions
Team composition
Multiplier applied to dev hours to reflect QA, design, and PM overhead. Use Dev only for solo work; Full team for projects with formal review processes.
Rates reflect fully-loaded developer cost including overhead
Warning:Cost of inaction
Compliance Risk
€120.500.000
- No privacy policy link detectedAVG: EUR 10.000 – EUR 20.000.000
- Trackers detected but no cookie policy foundAVG: EUR 5.000 – EUR 10.000.000
- Trackers detected but no cookie policy foundAVG: EUR 10.000 – EUR 20.000.000
Bounce-Rate Cost
€7.575 /mo
+34.4pp bounce · ~3,443 lost visitors/mo
CPC: EUR 2.20
Bandwidth Waste
€1,57 /mo
21234.3 MB/mo × 0.074 EUR/GB
- Optimize transfer: save ~2.1 MB per page loadSaves €1,57/mo
Compliance figures represent the statutory maximum fine for the most severe triggered category, capped per regulation — not the sum of per-finding penalties. Based on published regulatory fine ranges. This is not legal advice.
Unique monthly visitors from your analytics
Purchases, signups, or key actions
Optional — for revenue estimation
more engaged visitors from reduced bounce
Fix 5 critical issues to capture this value
How this is calculated
Based on Google/Deloitte research ("Milliseconds Make Millions") showing a ~7% bounce rate increase per additional second of LCP above the 2.5s "Good" threshold.
Your site's LCP: → estimated after fixes.
These are estimates based on industry research — actual results vary
Your data stays in your browser — nothing is sent to our servers
Lighthouse
Mobile
First Contentful Paint First Contentful Paint — how long until the browser renders the first piece of content. Under 1.8s is good.
3.67 s
Largest Contentful Paint Largest Contentful Paint — how long until the largest visible element loads. Under 2.5s is good.
17.00 s
Total Blocking Time Total Blocking Time — total time the main thread was blocked, preventing user input. Under 200ms is good.
1.74 s
Cumulative Layout Shift Cumulative Layout Shift — measures visual stability. How much the page layout shifts during loading. Under 0.1 is good.
1.319
Speed Index Speed Index — how quickly content is visually displayed during load. Under 3.4s is good.
5.13 s
Time to Interactive Time to Interactive — how long until the page is fully interactive and responds to user input. Under 3.8s is good.
22.13 s
Desktop
First Contentful Paint First Contentful Paint — how long until the browser renders the first piece of content. Under 1.8s is good.
973 ms
Largest Contentful Paint Largest Contentful Paint — how long until the largest visible element loads. Under 2.5s is good.
2.48 s
Total Blocking Time Total Blocking Time — total time the main thread was blocked, preventing user input. Under 200ms is good.
139 ms
Cumulative Layout Shift Cumulative Layout Shift — measures visual stability. How much the page layout shifts during loading. Under 0.1 is good.
0.934
Speed Index Speed Index — how quickly content is visually displayed during load. Under 3.4s is good.
1.61 s
Time to Interactive Time to Interactive — how long until the page is fully interactive and responds to user input. Under 3.8s is good.
4.25 s
Categories
8Performance
Page weighs 11.4 MB (6.8 MB transferred)
Security
'unsafe-inline' found in script source
Accessibility
15 control(s) without accessible label
SEO
All checks pass
Infrastructure
All checks pass
Compliance
All checks pass
Content
All checks pass
Sustainability
All checks pass
How you compare
Where this site stands against peers running the same stack.
Technology stack
Adobe Experience Manager, on Java, with Fastly CDN
Stack Architecture
 Facebook Pixel 2.9.303
 Google Analytics
  Google Tag Manager
  Adobe Experience Manager
  Adobe Client Data Layer 2.0.2 Adobe Dynamic Media Classic
  Adobe Fonts Facebook SDK Google Search Console HSTS
  Open Graph
  Swiper
  Tailwind CSS
  YouTube
  core-js 3.32.2
 jQuery 3.7.1
 reCAPTCHA
  Java
Java  Fastly
 All Detected Technologies (19)
Java is a class-based, object-oriented programming language that is designed to have as few implementation dependencies as possible.
Adobe Experience Manager (AEM) is a content management solution for building websites, mobile apps and forms.
Adobe Client Data Layer is a framework of JavaScript objects on your site that contains all variable values used in your implementation.
Adobe Dynamic Media Classic is a platform that enables customers to manage, enhance, publish, and deliver dynamic rich media content and personal experiences to consumers across all channels and devices, including web, print material, email campaigns, desktops, social, and mobile.
Adobe Fonts is a web-based service providing access to a vast library of high-quality fonts for web and print design.
HTTP Strict Transport Security (HSTS) informs browsers that the site should only be accessed using HTTPS.
Open Graph is a protocol that is used to integrate any web page into the social graph.
Swiper is a JavaScript library that creates modern touch sliders with hardware-accelerated transitions.
YouTube is a video sharing service where users can create their own profile, upload videos, watch, like and comment on other videos.
core-js is a modular standard library for JavaScript, with polyfills for cutting-edge ECMAScript features.
jQuery is a JavaScript library which is a free, open-source software designed to simplify HTML DOM tree traversal and manipulation, as well as event handling, CSS animation, and Ajax.
reCAPTCHA is a free service from Google that helps protect websites from spam and abuse.
Facebook pixel is an analytics tool that allows you to measure the effectiveness of your advertising.
Google Analytics is a free web analytics service that tracks and reports website traffic.
Google Tag Manager is a tag management system (TMS) that allows you to quickly and easily update measurement codes and related code fragments collectively known as tags on your website or mobile app.
Observations (2)
No build tool detected
A framework (Adobe Client Data Layer) was detected but no bundler was identified. The build tool may not be detectable from output patterns, or the site may use the framework's built-in bundler.
Complex technology stack detected
19 technologies identified. A complex stack increases maintenance burden and attack surface. Consider whether all components are actively needed.
Show your score
Drop this badge on your README, marketing site, or status page. It auto-updates every time the audit re-runs and links back to this report.
This badge auto-updates with your latest scan result.
[](https://beavercheck.com/results/23983c7c-e4dc-4b35-8f54-6b1b7ac357fa)<a href="https://beavercheck.com/results/23983c7c-e4dc-4b35-8f54-6b1b7ac357fa"><img src="https://beavercheck.com/badge?url=https%3A%2F%2Fnato.int" alt="BeaverCheck Score"></a>https://beavercheck.com/badge?url=https%3A%2F%2Fnato.intExport & share
Download the audit, share with your team, or grab a fix plan ready to copy into your tracker.
Copies markdown to clipboard
Fix Plan
Three-week roadmap to ship the audit's findings, with one-click copy targets for your tracker.
Three-week fix plan
3 sprints · 9h total → projected B (80)
Sprint 1: Quick Wins
+4Highest ROI — low effort, high impact
- · Page weighs 11.4 MB (6.8 MB transferred)
- · 2 button(s) with no accessible text
Sprint 2: Core Fixes
+2Medium effort, high structural impact
- · 15 control(s) without accessible label
- · 3 image(s) missing alt attribute
Sprint 3: Strategic Improvements
+3Higher effort, long-term payoff
- · 'unsafe-inline' found in script source