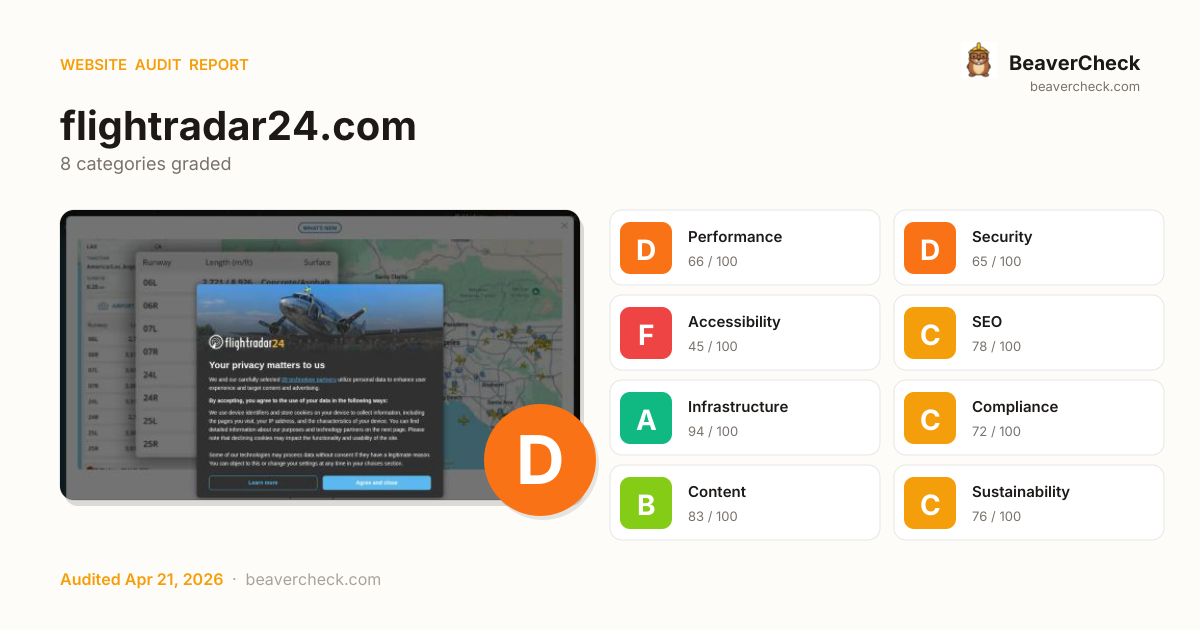
Mobile 375 × 812

Desktop 1440 × 900

Score: 68 / 100
Based on 8 categories, 0 sections
Room to improve — your 30.8s load time is above Google's 2.5s 'Good' threshold.
Several missing protections leave your users and data exposed.
Major barriers for users with disabilities — up to 15% of your audience.
Solid SEO basics — a few optimizations could boost rankings.
Solid infrastructure — fast server responses across the board.
Mostly compliant — a few items need attention.
Good content signals with minor gaps.
Reasonable footprint with room for optimization.
The overall score is a weighted average of individual category scores. Categories with more impact on user experience and security carry more weight.
Weights reflect general web best practices. Individual needs may differ.
Content-Security-Policy header is missing
Security gaps expose your site and users to attacks, eroding trust.
HSTS header is missing
Security gaps expose your site and users to attacks, eroding trust.
No Content-Security-Policy header found
Security gaps expose your site and users to attacks, eroding trust.
Page weighs 15.2 MB (5.2 MB transferred)
Performance issues directly impact user engagement and conversion rates.
4 button(s) with no accessible text
Accessibility issues exclude users with disabilities — up to 15% of your potential audience.
High impact, low effort — start here.
High impact, requires investment.
Small gains, minimal effort.
Nothing in this quadrant — good news.
Low impact, high effort — do last.
Nothing in this quadrant — good news.
[](https://beavercheck.com/results/2428819d-abf6-40b3-a8c8-968265a25865)<a href="https://beavercheck.com/results/2428819d-abf6-40b3-a8c8-968265a25865"><img src="https://beavercheck.com/badge?url=https%3A%2F%2Fflightradar24.com" alt="BeaverCheck Score"></a>https://beavercheck.com/badge?url=https%3A%2F%2Fflightradar24.comThis badge auto-updates with your latest scan result.
Your site has several issues that may be affecting user experience and business outcomes. Your LCP of 30.8s exceeds Google's 2.5s 'Good' threshold and the 1 performance issue below directly contributes to it. Accessibility issues exclude users who rely on assistive technology — an estimated 15% of your potential audience. Addressing the critical issues below would have the most immediate impact on your user trust.
10 barrier(s) likely increasing bounce by ~35%.
Page takes 30.8s to load
+12% bounceUsers abandon at ~3s — you're 28.3s over the 2.5s threshold
Fix: Optimize render-blocking resources, preload the hero image, and compress images
Page feels frozen for 69.1s
+5% bounceClicks on the primary CTA are ignored while JavaScript runs
Fix: Break up long tasks; defer non-critical JavaScript to post-hydration
No HSTS header
+1% bounceReturning visitors are briefly exposed to downgrade attacks on first request
Fix: Set Strict-Transport-Security: max-age=31536000; includeSubDomains
No Content-Security-Policy header
+1% bounceHigher XSS blast radius — one compromised script can exfiltrate the checkout form
Fix: Ship a reporting-only CSP first, then enforce once violations are clean
Severe layout shift during page load
+6% bounceUsers mis-click when content jumps — converting intent into frustration
Fix: Reserve space for images, ads, and embeds with explicit width/height
No structured data
+2% bounceNo rich-result eligibility in Google — lower SERP CTR vs competitors with stars and prices
Fix: Add JSON-LD for your page type (Product, Article, FAQPage, LocalBusiness, …)
Thin content
+3% bounceUnder 300 words — visitors bounce looking for substance, search engines rank competitors first
Fix: Add a substantive FAQ, product detail, or case-study section
7 link(s) with generic text ("click here", "read more")
+1% bounceScreen-reader users navigating by link list see no context — and search engines can't infer relevance
Fix: Rewrite with descriptive phrases that identify the destination
No skip-to-content link
+1% bounceKeyboard and screen-reader users must tab through the entire header on every page
Fix: Add a visible-on-focus <a href="#main">Skip to content</a> as the first focusable element
3 broken link(s) on the page
+5% bounceClicks land on 404s — trust drops and the session often ends
Fix: Fix or remove the broken destinations surfaced on the Content tab
Preliminary CRO audit — each barrier links to the tab with detailed analysis.
$500 investment → $1.32/month returns + USD 157,500 risk avoided
$500
5h · 5 findings
$1.32 /mo
~$16 / year
USD 157,500
if kept compliant
$150 — in quick wins — start here for the fastest payback
Figures combine localized regulatory fine ceilings, search/conversion value priced against local CPC, and bandwidth waste estimates. Results depend on implementation quality and audience composition. Not legal or financial advice.
5.0 developer hours at $100/hr
Based on United States rates ($100/hr)
Start here for the best return on investment
$13,126 / month at risk
~$157,516 / year if left unfixed
$157,500
+8 more
$1.32 /mo
16497.8 MB/mo × 0.080 USD/GB
Compliance figures represent the statutory maximum fine for the most severe triggered category, capped per regulation — not the sum of per-finding penalties. Based on published regulatory fine ranges. This is not legal advice.
Unique monthly visitors from your analytics
Purchases, signups, or key actions
Optional — for revenue estimation
more engaged visitors from reduced bounce
Fix 5 critical issues to capture this value
Based on Google/Deloitte research ("Milliseconds Make Millions") showing a ~7% bounce rate increase per additional second of LCP above the 2.5s "Good" threshold.
Your site's LCP: → estimated after fixes.
These are estimates based on industry research — actual results vary
Your data stays in your browser — nothing is sent to our servers
Thanks for your feedback!
We'll use a cached audit if available, or offer to scan.
Industry-standard audits powered by Google Lighthouse.
Key metrics that affect user experience.
First Contentful Paint First Contentful Paint — how long until the browser renders the first piece of content. Under 1.8s is good.
2.03 s
Largest Contentful Paint Largest Contentful Paint — how long until the largest visible element loads. Under 2.5s is good.
30.83 s
Total Blocking Time Total Blocking Time — total time the main thread was blocked, preventing user input. Under 200ms is good.
69.11 s
Cumulative Layout Shift Cumulative Layout Shift — measures visual stability. How much the page layout shifts during loading. Under 0.1 is good.
0.285
Speed Index Speed Index — how quickly content is visually displayed during load. Under 3.4s is good.
14.06 s
Time to Interactive Time to Interactive — how long until the page is fully interactive and responds to user input. Under 3.8s is good.
93.89 s
Audit breakdown by category with detailed findings.
Remove large, duplicate JavaScript modules from bundles to reduce unnecessary bytes consumed by network activity.
Performance issues directly impact user engagement and conversion rates.
Polyfills and transforms enable older browsers to use new JavaScript features. However, many aren't necessary for modern browsers. Consider modifying your JavaScript build process to not transpile Baseline features, unless you know you must support older browsers. Learn why most sites can deploy ES6+ code without transpiling
Shipping ES5 transpiled code to modern browsers wastes bytes — every user with an evergreen browser pays for compatibility you don't need.
Most users today run browsers that natively support ES6+, async/await, optional chaining, and the rest of modern JavaScript. Transpiling to ES5 'just in case' adds 20-40% to your bundle for no benefit. Configure your build to target a modern browserslist, or ship a differential bundle pair (modern + legacy) with the module/nomodule pattern.
Source: Google web.dev / Lighthouse
3rd party code can significantly impact load performance. Reduce and defer loading of 3rd party code to prioritize your page's content.
Performance issues directly impact user engagement and conversion rates.
A long cache lifetime can speed up repeat visits to your page. Learn more about caching.
Performance issues directly impact user engagement and conversion rates.
Layout shifts occur when elements move absent any user interaction. Investigate the causes of layout shifts, such as elements being added, removed, or their fonts changing as the page loads.
Performance issues directly impact user engagement and conversion rates.
Your first network request is the most important. Reduce its latency by avoiding redirects, ensuring a fast server response, and enabling text compression.
Performance issues directly impact user engagement and conversion rates.
Reducing the download time of images can improve the perceived load time of the page and LCP. Learn more about optimizing image size
Performance issues directly impact user engagement and conversion rates.
| URL | Resource Size | Est Savings | |
|---|---|---|---|
div > div > div > img div > div > div > img | /maps/vt?pb=!1m5!1m4!1i6!2i31!3i24!4i256!2m3!1e4!2st!3i77... | 163.7 KiB | 131.1 KiB |
div > div > div > img div > div > div > img | /maps/vt?pb=!1m5!1m4!1i6!2i32!3i22!4i256!2m3!1e4!2st!3i77... | 139.4 KiB | 106.7 KiB |
div > div > div > img div > div > div > img | /maps/vt?pb=!1m5!1m4!1i6!2i32!3i23!4i256!2m3!1e4!2st!3i77... | 136.8 KiB | 104.2 KiB |
div > div > div > img div > div > div > img | /maps/vt?pb=!1m5!1m4!1i6!2i31!3i25!4i256!2m3!1e4!2st!3i77... | 122.4 KiB | 89.8 KiB |
div > div > div > img div > div > div > img | /maps/vt?pb=!1m5!1m4!1i6!2i31!3i23!4i256!2m3!1e4!2st!3i77... | 118.9 KiB | 86.2 KiB |
div > div > div > img div > div > div > img | /maps/vt?pb=!1m5!1m4!1i6!2i32!3i25!4i256!2m3!1e4!2st!3i77... | 109.5 KiB | 76.9 KiB |
Discover the new airport panel li.grid > div.px-1.5 > div.w-full > img.mb-4 | www.flightradar24.com/assets/images/airport_panel/general@2x.webp | 84.1 KiB | 62.2 KiB |
Detailed airport disruption stats li.grid > div.px-1.5 > div.w-full > img.mb-4 | www.flightradar24.com/assets/images/airport_panel/airport-disruption@2x.webp | 76.0 KiB | 56.2 KiB |
Many ways to access airport information li.grid > div.px-1.5 > div.w-full > img.mb-4 | www.flightradar24.com/assets/images/airport_panel/airport-pins@2x.webp | 66.7 KiB | 49.3 KiB |
div > div > div > img div > div > div > img | /maps/vt?pb=!1m5!1m4!1i6!2i30!3i24!4i256!2m3!1e4!2st!3i77... | 82.0 KiB | 49.3 KiB |
Airport & runway details li.grid > div.px-1.5 > div.w-full > img.mb-4 | www.flightradar24.com/assets/images/airport_panel/airport-runway-details@2x.webp | 62.0 KiB | 45.9 KiB |
Airport Statistics: Runway usage li.grid > div.px-1.5 > div.w-full > img.mb-4 | www.flightradar24.com/assets/images/airport_panel/runway-usage@2x.webp | 52.0 KiB | 38.4 KiB |
div > div > div > img div > div > div > img | /maps/vt?pb=!1m5!1m4!1i6!2i30!3i23!4i256!2m3!1e4!2st!3i77... | 69.9 KiB | 37.3 KiB |
Airport Statistics: Movements per day li.grid > div.px-1.5 > div.w-full > img.mb-4 | www.flightradar24.com/assets/images/airport_panel/movements-per-day@2x.webp | 48.8 KiB | 36.1 KiB |
div > div > div > img div > div > div > img | /maps/vt?pb=!1m5!1m4!1i6!2i31!3i22!4i256!2m3!1e4!2st!3i77... | 57.8 KiB | 25.2 KiB |
div > div > div > img div > div > div > img | /maps/vt?pb=!1m5!1m4!1i6!2i30!3i25!4i256!2m3!1e4!2st!3i77... | 41.7 KiB | 9.8 KiB |
Each subpart has specific improvement strategies. Ideally, most of the LCP time should be spent on loading the resources, not within delays.
Performance issues directly impact user engagement and conversion rates.
Avoid chaining critical requests by reducing the length of chains, reducing the download size of resources, or deferring the download of unnecessary resources to improve page load.
Performance issues directly impact user engagement and conversion rates.
Requests are blocking the page's initial render, which may delay LCP. Deferring or inlining can move these network requests out of the critical path.
Performance issues directly impact user engagement and conversion rates.
| URL | Transfer Size |
|---|---|
| www.flightradar24.com/fonts/roboto-condensed.css | 946 B |
| www.flightradar24.com/fonts/roboto.css | 1.2 KiB |
| www.flightradar24.com/fonts/open-sans.css | 766 B |
These insights are also available in the Chrome DevTools Performance Panel - record a trace to view more detailed information.
Time to Interactive is the amount of time it takes for the page to become fully interactive. Learn more about the Time to Interactive metric.
Performance issues directly impact user engagement and conversion rates.
The maximum potential First Input Delay that your users could experience is the duration of the longest task. Learn more about the Maximum Potential First Input Delay metric.
Performance issues directly impact user engagement and conversion rates.
Redirects introduce additional delays before the page can be loaded. Learn how to avoid page redirects.
Performance issues directly impact user engagement and conversion rates.
| URL | Time Spent |
|---|---|
| flightradar24.com/ | 927 ms |
| www.flightradar24.com/ | 0.0 ms |
These are the largest layout shifts observed on the page. Each table item represents a single layout shift, and shows the element that shifted the most. Below each item are possible root causes that led to the layout shift. Some of these layout shifts may not be included in the CLS metric value due to windowing. Learn how to improve CLS
Performance issues directly impact user engagement and conversion rates.
| Element | Layout shift score |
|---|---|
PREMIUM FEATURE
Airport Statistics: Runway usage
See the last 7 days of total t… div#headlessui-dialog-v-24-1 > div.fixed > div.fixed > div#headlessui-dialog-panel-v-24-4 | 0.145 |
PREMIUM FEATURE
Airport Statistics: Runway usage
See the last 7 days of total t… div#headlessui-dialog-v-24-1 > div.fixed > div.fixed > div#headlessui-dialog-panel-v-24-4 | 0.141 |
Open in app div.pointer-events-none > div.flex > div.pointer-events-auto > button.whitespace-nowrap | 0.000 |
LOG IN div.relative > button#auth-button > div.flex > span.whitespace-nowrap | 0.000 |
Minifying JavaScript files can reduce payload sizes and script parse time. Learn how to minify JavaScript.
Performance issues directly impact user engagement and conversion rates.
| URL | Transfer Size | Est Savings |
|---|---|---|
| cdn.gravito.net/cmp/v6/gpp-test/index5.js | 41.7 KiB | 9.6 KiB |
| cdn.gravito.net/cmp/v6/gpp-test/index7.js | 22.9 KiB | 9.6 KiB |
| www.flightradar24.com/build/assets/init-CSCl8LBk.js | 15.5 KiB | 6.5 KiB |
| live.primis.tech/live/liveView.php?s=118969 | 36.1 KiB | 5.6 KiB |
| cdn.gravito.net/customhtmlscripts/fr24gppcmpwrapper.js | 9.5 KiB | 3.1 KiB |
| cdn.gravito.net/cmp/v6/gpp-test/consent2.js | 10.9 KiB | 2.4 KiB |
Reduce unused rules from stylesheets and defer CSS not used for above-the-fold content to decrease bytes consumed by network activity. Learn how to reduce unused CSS.
Performance issues directly impact user engagement and conversion rates.
| URL | Transfer Size | Est Savings |
|---|---|---|
| www.flightradar24.com/build/assets/app-DW2t_My-.css | 21.9 KiB | 19.6 KiB |
Reduce unused JavaScript and defer loading scripts until they are required to decrease bytes consumed by network activity. Learn how to reduce unused JavaScript.
Multi-megabyte JavaScript bundles delay every interactive feature on the page.
This is the Lighthouse audit fired when too much JS is shipped relative to what executes. The fix isn't a config flag — it requires bundle analysis (webpack-bundle-analyzer, rollup-plugin-visualizer), splitting routes into chunks, lazy-loading off-screen components, and removing unused dependencies. Fundamentally different from minification: minifying reduces byte count, this reduces what's downloaded at all.
Source: Google web.dev / Lighthouse
Consider reducing the time spent parsing, compiling, and executing JS. You may find delivering smaller JS payloads helps with this. Learn how to reduce Javascript execution time.
Performance issues directly impact user engagement and conversion rates.
Consider reducing the time spent parsing, compiling and executing JS. You may find delivering smaller JS payloads helps with this. Learn how to minimize main-thread work
Performance issues directly impact user engagement and conversion rates.
| Category | Time Spent |
|---|---|
| Other | 76.3 s |
| Script Evaluation | 15.8 s |
| Garbage Collection | 691 ms |
| Style & Layout | 621 ms |
| Script Parsing & Compilation | 508 ms |
| Rendering | 288 ms |
| Parse HTML & CSS | 45 ms |
Large network payloads cost users real money and are highly correlated with long load times. Learn how to reduce payload sizes.
Performance issues directly impact user engagement and conversion rates.
Set an explicit width and height on image elements to reduce layout shifts and improve CLS. Learn how to set image dimensions
Performance issues directly impact user engagement and conversion rates.
| URL | |
|---|---|
Airport Statistics: Runway usage li.grid > div.px-1.5 > div.w-full > img.mb-4 | www.flightradar24.com/assets/images/airport_panel/runway-usage@2x.webp |
Airport & runway details li.grid > div.px-1.5 > div.w-full > img.mb-4 | www.flightradar24.com/assets/images/airport_panel/airport-runway-details@2x.webp |
Many ways to access airport information li.grid > div.px-1.5 > div.w-full > img.mb-4 | www.flightradar24.com/assets/images/airport_panel/airport-pins@2x.webp |
Discover the new airport panel li.grid > div.px-1.5 > div.w-full > img.mb-4 | www.flightradar24.com/assets/images/airport_panel/general@2x.webp |
Detailed airport disruption stats li.grid > div.px-1.5 > div.w-full > img.mb-4 | www.flightradar24.com/assets/images/airport_panel/airport-disruption@2x.webp |
Airport Statistics: Movements per day li.grid > div.px-1.5 > div.w-full > img.mb-4 | www.flightradar24.com/assets/images/airport_panel/movements-per-day@2x.webp |
website logo from config div#gravitoCMP-tab-container-id > div.gravitoCMP-brand-header > div.gravitoCMP-logo-div > img.gravitoCMP-logo | www.flightradar24.com/static/images/logo_fr24_flat_no_text.svg |
New features div.z-10 > article.max-h-[calc(100vh-2rem)] > picture > img.w-full | www.flightradar24.com/assets/images/airport_panel/whats-new@2x.png |
More information about the performance of your application. These numbers don't directly affect the Performance score.
These checks highlight opportunities to improve the accessibility of your web app. Automatic detection can only detect a subset of issues and does not guarantee the accessibility of your web app, so manual testing is also encouraged.
ARIA dialog elements without accessible names may prevent screen readers users from discerning the purpose of these elements. Learn how to make ARIA dialog elements more accessible.
Performance issues directly impact user engagement and conversion rates.
| Failing Elements |
|---|
PREMIUM FEATURE
Airport Statistics: Runway usage
See the last 7 days of total t… div#headlessui-portal-root > div > div > div#headlessui-dialog-v-24-1 |
These are opportunities to improve the usage of ARIA in your application which may enhance the experience for users of assistive technology, like a screen reader.
When a button doesn't have an accessible name, screen readers announce it as "button", making it unusable for users who rely on screen readers. Learn how to make buttons more accessible.
Performance issues directly impact user engagement and conversion rates.
| Failing Elements |
|---|
article.max-h-[calc(100vh-2rem)] > article.relative > nav.z-10 > button.size-2 article.max-h-[calc(100vh-2rem)] > article.relative > nav.z-10 > button.size-2 |
article.relative > section.group > nav > button.absolute article.relative > section.group > nav > button.absolute |
These are opportunities to improve the semantics of the controls in your application. This may enhance the experience for users of assistive technology, like a screen reader.
Low-contrast text is difficult or impossible for many users to read. Learn how to provide sufficient color contrast.
Performance issues directly impact user engagement and conversion rates.
| Failing Elements |
|---|
Agree and close div#gravitoCMP-tab-container-id > div.gravitoCMP-action-footer-div > div.gravitoCMP-action-container > button#gravitoTCFCMP-layer1-accept-all |
These are opportunities to improve the legibility of your content.
Errors logged to the console indicate unresolved problems. They can come from network request failures and other browser concerns. Learn more about this errors in console diagnostic audit
Performance issues directly impact user engagement and conversion rates.
| Source | Description |
|---|---|
maps.google.com/maps-api-v3/api/js/63/14d/main.js line 180, col 422 | Attempted to load a Vector Map, but failed. Falling back to Raster. Please see https://developers.google.com/maps/documentation/javascript/webgl/support for more info |
Failed to load resource: the server responded with a status of 503 () | |
Failed to load resource: the server responded with a status of 503 () |
Source maps translate minified code to the original source code. This helps developers debug in production. In addition, Lighthouse is able to provide further insights. Consider deploying source maps to take advantage of these benefits. Learn more about source maps.
Performance issues directly impact user engagement and conversion rates.
These checks ensure that your page is following basic search engine optimization advice. There are many additional factors Lighthouse does not score here that may affect your search ranking, including performance on Core Web Vitals. Learn more about Google Search Essentials.
Search engines may use `href` attributes on links to crawl websites. Ensure that the `href` attribute of anchor elements links to an appropriate destination, so more pages of the site can be discovered. Learn how to make links crawlable
Performance issues directly impact user engagement and conversion rates.
| Uncrawlable Link |
|---|
Our privacy policy div#gravitoCMP-tab-container-id > div.gravitoCMP-tab-footer > div.gravitoCMP-footer-links > a.gravitoCMP-text-light |
To appear in search results, crawlers need access to your app.
Industry-standard audits powered by Google Lighthouse. — Desktop
Key metrics that affect user experience. — Desktop
First Contentful Paint First Contentful Paint — how long until the browser renders the first piece of content. Under 1.8s is good.
914 ms
Largest Contentful Paint Largest Contentful Paint — how long until the largest visible element loads. Under 2.5s is good.
5.31 s
Total Blocking Time Total Blocking Time — total time the main thread was blocked, preventing user input. Under 200ms is good.
11.47 s
Cumulative Layout Shift Cumulative Layout Shift — measures visual stability. How much the page layout shifts during loading. Under 0.1 is good.
0.434
Speed Index Speed Index — how quickly content is visually displayed during load. Under 3.4s is good.
8.21 s
Time to Interactive Time to Interactive — how long until the page is fully interactive and responds to user input. Under 3.8s is good.
20.46 s
Audit breakdown by category with detailed findings.
Remove large, duplicate JavaScript modules from bundles to reduce unnecessary bytes consumed by network activity.
Performance issues directly impact user engagement and conversion rates.
Polyfills and transforms enable older browsers to use new JavaScript features. However, many aren't necessary for modern browsers. Consider modifying your JavaScript build process to not transpile Baseline features, unless you know you must support older browsers. Learn why most sites can deploy ES6+ code without transpiling
Shipping ES5 transpiled code to modern browsers wastes bytes — every user with an evergreen browser pays for compatibility you don't need.
Most users today run browsers that natively support ES6+, async/await, optional chaining, and the rest of modern JavaScript. Transpiling to ES5 'just in case' adds 20-40% to your bundle for no benefit. Configure your build to target a modern browserslist, or ship a differential bundle pair (modern + legacy) with the module/nomodule pattern.
Source: Google web.dev / Lighthouse
3rd party code can significantly impact load performance. Reduce and defer loading of 3rd party code to prioritize your page's content.
Performance issues directly impact user engagement and conversion rates.
A long cache lifetime can speed up repeat visits to your page. Learn more about caching.
Performance issues directly impact user engagement and conversion rates.
Layout shifts occur when elements move absent any user interaction. Investigate the causes of layout shifts, such as elements being added, removed, or their fonts changing as the page loads.
Performance issues directly impact user engagement and conversion rates.
Your first network request is the most important. Reduce its latency by avoiding redirects, ensuring a fast server response, and enabling text compression.
Performance issues directly impact user engagement and conversion rates.
Optimize LCP by making the LCP image discoverable from the HTML immediately, and avoiding lazy-loading
Performance issues directly impact user engagement and conversion rates.
Avoid chaining critical requests by reducing the length of chains, reducing the download size of resources, or deferring the download of unnecessary resources to improve page load.
Performance issues directly impact user engagement and conversion rates.
Requests are blocking the page's initial render, which may delay LCP. Deferring or inlining can move these network requests out of the critical path.
Performance issues directly impact user engagement and conversion rates.
| URL | Transfer Size | Duration |
|---|---|---|
| www.flightradar24.com/fonts/roboto-condensed.css | 1.2 KiB | 232 ms |
| www.flightradar24.com/fonts/roboto.css | 1.3 KiB | 108 ms |
| www.flightradar24.com/fonts/open-sans.css | 1.0 KiB | 108 ms |
Reducing the download time of images can improve the perceived load time of the page and LCP. Learn more about optimizing image size
Performance issues directly impact user engagement and conversion rates.
| URL | Resource Size | Est Savings | |
|---|---|---|---|
div > div > div > img div > div > div > img | /maps/vt?pb=!1m5!1m4!1i6!2i33!3i22!4i256!2m3!1e4!2st!3i77... | 56.8 KiB | 46.2 KiB |
div > div > div > img div > div > div > img | /maps/vt?pb=!1m5!1m4!1i6!2i31!3i24!4i256!2m3!1e4!2st!3i77... | 44.1 KiB | 33.5 KiB |
div > div > div > img div > div > div > img | /maps/vt?pb=!1m5!1m4!1i6!2i32!3i23!4i256!2m3!1e4!2st!3i77... | 41.7 KiB | 31.0 KiB |
div > div > div > img div > div > div > img | /maps/vt?pb=!1m5!1m4!1i6!2i32!3i22!4i256!2m3!1e4!2st!3i77... | 37.5 KiB | 26.8 KiB |
div > div > div > img div > div > div > img | /maps/vt?pb=!1m5!1m4!1i6!2i31!3i25!4i256!2m3!1e4!2st!3i77... | 36.4 KiB | 25.7 KiB |
div > div > div > img div > div > div > img | /maps/vt?pb=!1m5!1m4!1i6!2i31!3i23!4i256!2m3!1e4!2st!3i77... | 35.7 KiB | 25.1 KiB |
div > div > div > img div > div > div > img | /maps/vt?pb=!1m5!1m4!1i6!2i32!3i25!4i256!2m3!1e4!2st!3i77... | 31.6 KiB | 20.9 KiB |
div > div > div > img div > div > div > img | /maps/vt?pb=!1m5!1m4!1i6!2i33!3i25!4i256!2m3!1e4!2st!3i77... | 31.1 KiB | 20.5 KiB |
div > div > div > img div > div > div > img | /maps/vt?pb=!1m5!1m4!1i6!2i30!3i24!4i256!2m3!1e4!2st!3i77... | 26.2 KiB | 15.5 KiB |
div > div > div > img div > div > div > img | /maps/vt?pb=!1m5!1m4!1i6!2i33!3i23!4i256!2m3!1e4!2st!3i77... | 23.8 KiB | 13.1 KiB |
div > div > div > img div > div > div > img | /maps/vt?pb=!1m5!1m4!1i6!2i30!3i23!4i256!2m3!1e4!2st!3i77... | 20.2 KiB | 9.5 KiB |
Discover the new airport panel li.grid > div.px-1.5 > div.w-full > img.mb-4 | www.flightradar24.com/assets/images/airport_panel/general.webp | 33.8 KiB | 8.1 KiB |
div > div > div > img div > div > div > img | /maps/vt?pb=!1m5!1m4!1i6!2i31!3i22!4i256!2m3!1e4!2st!3i77... | 16.7 KiB | 6.0 KiB |
Detailed airport disruption stats li.grid > div.px-1.5 > div.w-full > img.mb-4 | www.flightradar24.com/assets/images/airport_panel/airport-disruption.webp | 30.5 KiB | 4.8 KiB |
These insights are also available in the Chrome DevTools Performance Panel - record a trace to view more detailed information.
Time to Interactive is the amount of time it takes for the page to become fully interactive. Learn more about the Time to Interactive metric.
Performance issues directly impact user engagement and conversion rates.
Redirects introduce additional delays before the page can be loaded. Learn how to avoid page redirects.
Performance issues directly impact user engagement and conversion rates.
| URL | Time Spent |
|---|---|
| flightradar24.com/ | 295 ms |
| www.flightradar24.com/ | 0.0 ms |
These are the largest layout shifts observed on the page. Each table item represents a single layout shift, and shows the element that shifted the most. Below each item are possible root causes that led to the layout shift. Some of these layout shifts may not be included in the CLS metric value due to windowing. Learn how to improve CLS
Performance issues directly impact user engagement and conversion rates.
| Element | Layout shift score |
|---|---|
PREMIUM FEATURE
Airport Statistics: Runway usage
See the last 7 days of total t… div#headlessui-dialog-v-25-1 > div.fixed > div.fixed > div#headlessui-dialog-panel-v-25-4 | 0.432 |
| 0.002 | |
div.relative > aside.flex > div.flex > div.inline-flex div.relative > aside.flex > div.flex > div.inline-flex | 0.000 |
The maximum potential First Input Delay that your users could experience is the duration of the longest task. Learn more about the Maximum Potential First Input Delay metric.
Performance issues directly impact user engagement and conversion rates.
Minifying JavaScript files can reduce payload sizes and script parse time. Learn how to minify JavaScript.
Performance issues directly impact user engagement and conversion rates.
| URL | Transfer Size | Est Savings |
|---|---|---|
| cdn.gravito.net/cmp/v6/gpp-test/index5.js | 41.7 KiB | 9.6 KiB |
| cdn.gravito.net/cmp/v6/gpp-test/index7.js | 22.9 KiB | 9.6 KiB |
| www.flightradar24.com/build/assets/init-CSCl8LBk.js | 15.5 KiB | 6.5 KiB |
| live.primis.tech/live/liveView.php?s=116446 | 36.1 KiB | 5.5 KiB |
| cdn.gravito.net/customhtmlscripts/fr24gppcmpwrapper.js | 9.5 KiB | 3.1 KiB |
| cdn.gravito.net/cmp/v6/gpp-test/consent2.js | 10.9 KiB | 2.4 KiB |
Reduce unused JavaScript and defer loading scripts until they are required to decrease bytes consumed by network activity. Learn how to reduce unused JavaScript.
Multi-megabyte JavaScript bundles delay every interactive feature on the page.
This is the Lighthouse audit fired when too much JS is shipped relative to what executes. The fix isn't a config flag — it requires bundle analysis (webpack-bundle-analyzer, rollup-plugin-visualizer), splitting routes into chunks, lazy-loading off-screen components, and removing unused dependencies. Fundamentally different from minification: minifying reduces byte count, this reduces what's downloaded at all.
Source: Google web.dev / Lighthouse
Consider reducing the time spent parsing, compiling, and executing JS. You may find delivering smaller JS payloads helps with this. Learn how to reduce Javascript execution time.
Performance issues directly impact user engagement and conversion rates.
Consider reducing the time spent parsing, compiling and executing JS. You may find delivering smaller JS payloads helps with this. Learn how to minimize main-thread work
Performance issues directly impact user engagement and conversion rates.
| Category | Time Spent |
|---|---|
| Other | 15.3 s |
| Script Evaluation | 4.0 s |
| Garbage Collection | 198 ms |
| Style & Layout | 187 ms |
| Script Parsing & Compilation | 130 ms |
| Rendering | 63 ms |
| Parse HTML & CSS | 13 ms |
Reduce unused rules from stylesheets and defer CSS not used for above-the-fold content to decrease bytes consumed by network activity. Learn how to reduce unused CSS.
Performance issues directly impact user engagement and conversion rates.
| URL | Transfer Size | Est Savings |
|---|---|---|
| www.flightradar24.com/build/assets/app-DW2t_My-.css | 21.8 KiB | 19.4 KiB |
Large network payloads cost users real money and are highly correlated with long load times. Learn how to reduce payload sizes.
Performance issues directly impact user engagement and conversion rates.
Set an explicit width and height on image elements to reduce layout shifts and improve CLS. Learn how to set image dimensions
Performance issues directly impact user engagement and conversion rates.
| URL | |
|---|---|
Airport Statistics: Runway usage li.grid > div.px-1.5 > div.w-full > img.mb-4 | www.flightradar24.com/assets/images/airport_panel/runway-usage.webp |
Airport & runway details li.grid > div.px-1.5 > div.w-full > img.mb-4 | www.flightradar24.com/assets/images/airport_panel/airport-runway-details.webp |
Many ways to access airport information li.grid > div.px-1.5 > div.w-full > img.mb-4 | www.flightradar24.com/assets/images/airport_panel/airport-pins.webp |
Discover the new airport panel li.grid > div.px-1.5 > div.w-full > img.mb-4 | www.flightradar24.com/assets/images/airport_panel/general.webp |
Detailed airport disruption stats li.grid > div.px-1.5 > div.w-full > img.mb-4 | www.flightradar24.com/assets/images/airport_panel/airport-disruption.webp |
Airport Statistics: Movements per day li.grid > div.px-1.5 > div.w-full > img.mb-4 | www.flightradar24.com/assets/images/airport_panel/movements-per-day.webp |
Flightradar24 - Flight Tracker aside.flex > div.flex > div.flex > img.h-4.5 | www.flightradar24.com/assets/svg/logo-without-radar-and-slogan.svg |
website logo from config div#gravitoCMP-tab-container-id > div.gravitoCMP-brand-header > div.gravitoCMP-logo-div > img.gravitoCMP-logo | www.flightradar24.com/static/images/logo_fr24_flat_no_text.svg |
New features div.z-10 > article.max-h-[calc(100vh-2rem)] > picture > img.w-full | www.flightradar24.com/assets/images/airport_panel/whats-new.png |
Flightradar24 - Flight Tracker div.flex > div.flex > a > img.h-3 | www.flightradar24.com/build/assets/social_youtube_logo-DMiXPbtd.svg |
More information about the performance of your application. These numbers don't directly affect the Performance score.
These checks highlight opportunities to improve the accessibility of your web app. Automatic detection can only detect a subset of issues and does not guarantee the accessibility of your web app, so manual testing is also encouraged.
ARIA dialog elements without accessible names may prevent screen readers users from discerning the purpose of these elements. Learn how to make ARIA dialog elements more accessible.
Performance issues directly impact user engagement and conversion rates.
| Failing Elements |
|---|
PREMIUM FEATURE
Airport Statistics: Runway usage
See the last 7 days of total t… div#headlessui-portal-root > div > div > div#headlessui-dialog-v-25-1 |
These are opportunities to improve the usage of ARIA in your application which may enhance the experience for users of assistive technology, like a screen reader.
When a button doesn't have an accessible name, screen readers announce it as "button", making it unusable for users who rely on screen readers. Learn how to make buttons more accessible.
Performance issues directly impact user engagement and conversion rates.
| Failing Elements |
|---|
article.max-h-[calc(100vh-2rem)] > article.relative > nav.z-10 > button.size-2 article.max-h-[calc(100vh-2rem)] > article.relative > nav.z-10 > button.size-2 |
article.relative > section.group > nav > button.absolute article.relative > section.group > nav > button.absolute |
These are opportunities to improve the semantics of the controls in your application. This may enhance the experience for users of assistive technology, like a screen reader.
Low-contrast text is difficult or impossible for many users to read. Learn how to provide sufficient color contrast.
Performance issues directly impact user engagement and conversion rates.
| Failing Elements |
|---|
Agree and close div#gravitoCMP-tab-container-id > div.gravitoCMP-action-footer-div > div.gravitoCMP-action-container > button#gravitoTCFCMP-layer1-accept-all |
These are opportunities to improve the legibility of your content.
Errors logged to the console indicate unresolved problems. They can come from network request failures and other browser concerns. Learn more about this errors in console diagnostic audit
Performance issues directly impact user engagement and conversion rates.
| Source | Description |
|---|---|
maps.google.com/maps-api-v3/api/js/63/14d/main.js line 180, col 422 | Attempted to load a Vector Map, but failed. Falling back to Raster. Please see https://developers.google.com/maps/documentation/javascript/webgl/support for more info |
Source maps translate minified code to the original source code. This helps developers debug in production. In addition, Lighthouse is able to provide further insights. Consider deploying source maps to take advantage of these benefits. Learn more about source maps.
Performance issues directly impact user engagement and conversion rates.
These checks ensure that your page is following basic search engine optimization advice. There are many additional factors Lighthouse does not score here that may affect your search ranking, including performance on Core Web Vitals. Learn more about Google Search Essentials.
Search engines may use `href` attributes on links to crawl websites. Ensure that the `href` attribute of anchor elements links to an appropriate destination, so more pages of the site can be discovered. Learn how to make links crawlable
Performance issues directly impact user engagement and conversion rates.
| Uncrawlable Link |
|---|
Our privacy policy div#gravitoCMP-tab-container-id > div.gravitoCMP-tab-footer > div.gravitoCMP-footer-links > a.gravitoCMP-text-light |
To appear in search results, crawlers need access to your app.
Send Feedback