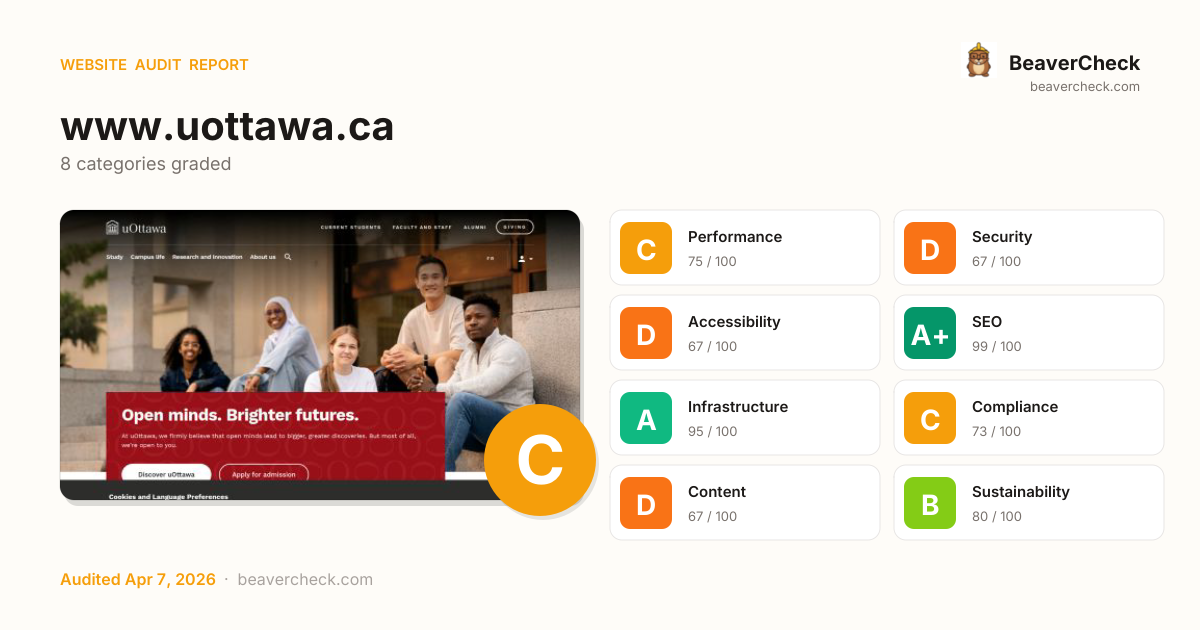
Audit overview
3 categories need attention: Security, and 2 others.
Fix Priority Matrix
5 findingsQuick Wins
3High impact, low effort — start here.
Strategic
2High impact, requires investment.
Easy Improvements
0Small gains, minimal effort.
Nothing in this quadrant — good news.
Deprioritize
0Low impact, high effort — do last.
Nothing in this quadrant — good news.
Screenshots


Top Priorities (5)
Page weighs 8.0 MB (4.6 MB transferred)
Informational: total page weight (uncompressed) and bytes actually transferred over the wire.
106 HTTP requests — consider bundling or reducing
High HTTP request count — bundling, sprite-ing, and HTTP/2 server push can reduce per-request overhead.
Cross-Origin-Embedder-Policy header is missing
COEP enforces that all embedded resources opt-in to cross-origin embedding — required for cross-origin isolation features.
Cross-Origin-Opener-Policy header is missing
COOP isolates your top-level browsing context from cross-origin windows — without it, popup-based side-channel attacks remain possible.
External link from cdnjs.cloudflare.com lacks integrity attribute
External resource without SRI — if the third-party CDN is compromised, your site executes attacker-controlled code.
Business case
What fixing the audit's findings is worth -- and what ignoring them keeps costing.
Return on investment
CAD 546 investment → CAD 9,289/month returns + CAD 100,000 risk avoided
Figures combine localized regulatory fine ceilings, search/conversion value priced against local CPC, and bandwidth waste estimates. Results depend on implementation quality and audience composition. Not legal or financial advice.
Conversion barriers
9 barrier(s) likely increasing bounce by ~33%.
- Page takes 18.6s to loadUsers abandon at ~3s — you're 16.1s over the 2.5s threshold→ Optimize render-blocking resources, preload the hero image, and compress images
- Page feels frozen for 1.6sClicks on the primary CTA are ignored while JavaScript runs→ Break up long tasks; defer non-critical JavaScript to post-hydration
- Severe layout shift during page loadUsers mis-click when content jumps — converting intent into frustration→ Reserve space for images, ads, and embeds with explicit width/height
- No HSTS headerReturning visitors are briefly exposed to downgrade attacks on first request→ Set Strict-Transport-Security: max-age=31536000; includeSubDomains
- No Content-Security-Policy headerHigher XSS blast radius — one compromised script can exfiltrate the checkout form→ Ship a reporting-only CSP first, then enforce once violations are clean
Preliminary CRO audit — each barrier links to the tab with detailed analysis.
Remediation cost
Start here for the best return on investment
Cost by category
Cost by effort level
Adjust assumptions
Team composition
Multiplier applied to dev hours to reflect QA, design, and PM overhead. Use Dev only for solo work; Full team for projects with formal review processes.
Rates reflect fully-loaded developer cost including overhead
Warning:Cost of inaction
Compliance Risk
CAD 100,000
- No privacy policy link detectedPIPEDA: CAD 1,000 – CAD 100,000
- 1 advertising/retargeting trackers detectedPIPEDA: CAD 1,000 – CAD 100,000
- Trackers detected but no cookie policy foundPIPEDA: CAD 1,000 – CAD 100,000
Bounce-Rate Cost
CAD 9,288 /mo
+33.2pp bounce · ~3,317 lost visitors/mo
CPC: CAD 2.80
Bandwidth Waste
CAD 1.58 /mo
14576.0 MB/mo × 0.108 CAD/GB
- Optimize transfer: save ~1.5 MB per page loadSaves CAD 1.58/mo
Compliance figures represent the statutory maximum fine for the most severe triggered category, capped per regulation — not the sum of per-finding penalties. Based on published regulatory fine ranges. This is not legal advice.
Unique monthly visitors from your analytics
Purchases, signups, or key actions
Optional — for revenue estimation
more engaged visitors from reduced bounce
Fix 1 critical issues to capture this value
How this is calculated
Based on Google/Deloitte research ("Milliseconds Make Millions") showing a ~7% bounce rate increase per additional second of LCP above the 2.5s "Good" threshold.
Your site's LCP: → estimated after fixes.
These are estimates based on industry research — actual results vary
Your data stays in your browser — nothing is sent to our servers
Lighthouse
Mobile
First Contentful Paint First Contentful Paint — how long until the browser renders the first piece of content. Under 1.8s is good.
2.61 s
Largest Contentful Paint Largest Contentful Paint — how long until the largest visible element loads. Under 2.5s is good.
18.63 s
Total Blocking Time Total Blocking Time — total time the main thread was blocked, preventing user input. Under 200ms is good.
1.59 s
Cumulative Layout Shift Cumulative Layout Shift — measures visual stability. How much the page layout shifts during loading. Under 0.1 is good.
0.361
Speed Index Speed Index — how quickly content is visually displayed during load. Under 3.4s is good.
5.27 s
Time to Interactive Time to Interactive — how long until the page is fully interactive and responds to user input. Under 3.8s is good.
21.71 s
Desktop
First Contentful Paint First Contentful Paint — how long until the browser renders the first piece of content. Under 1.8s is good.
965 ms
Largest Contentful Paint Largest Contentful Paint — how long until the largest visible element loads. Under 2.5s is good.
3.85 s
Total Blocking Time Total Blocking Time — total time the main thread was blocked, preventing user input. Under 200ms is good.
80 ms
Cumulative Layout Shift Cumulative Layout Shift — measures visual stability. How much the page layout shifts during loading. Under 0.1 is good.
0.024
Speed Index Speed Index — how quickly content is visually displayed during load. Under 3.4s is good.
1.83 s
Time to Interactive Time to Interactive — how long until the page is fully interactive and responds to user input. Under 3.8s is good.
4.27 s
Categories
8Performance
Page weighs 8.0 MB (4.6 MB transferred)
Security
Cross-Origin-Embedder-Policy header is missing
Accessibility
All checks pass
SEO
All checks pass
Infrastructure
All checks pass
Compliance
All checks pass
Content
All checks pass
Sustainability
All checks pass
How you compare
Where this site stands against peers running the same stack.
Top 10% of Drupal sites score 85+ on Compliance; you're at 73 — closing this gap is the highest-leverage improvement.
Top 10% of core-js sites score 95+ on Content; you're at 67 — closing this gap is the highest-leverage improvement.
Technology stack
Drupal 10, on PHP, hosted on Acquia Cloud Platform, with Cloudflare CDN
Stack Architecture
 Acquia Cloud Site Factory
  Drupal Multisite
  Facebook Pixel 2.9.291
 Google Analytics
  Google Tag Manager
  Siteimprove
  StackAdapt
  TikTok Pixel Drupal 10
 GSAP
GSAP  Google Font API HSTS
  HTTP/3
  LazySizes
  Slick 1.9.0
 Varnish
  YouTube
  core-js 3.32.2
 jQuery 3.7.1
 PHP
PHP  Cloudflare
  cdnjs
cdnjs  Acquia Cloud Platform
  Amazon Web Services
 All Detected Technologies (25)
Cloudflare is a web-infrastructure and website-security company, providing content-delivery-network services, DDoS mitigation, Internet security, and distributed domain-name-server services.
cdnjs is a free distributed JS library delivery service.
Acquia Cloud Platform is a Drupal-tuned application lifecycle management suite with an infrastructure to support Drupal deployment workflow processes.
Amazon Web Services (AWS) is a comprehensive cloud services platform offering compute power, database storage, content delivery and other functionality.
PHP is a general-purpose scripting language used for web development.
Drupal is a free and open-source web content management framework.
GSAP is an animation library that allows you to create animations with JavaScript.
Google Font API is a web service that supports open-source font files that can be used on your web designs.
HTTP Strict Transport Security (HSTS) informs browsers that the site should only be accessed using HTTPS.
HTTP/3 is the third major version of the Hypertext Transfer Protocol used to exchange information on the World Wide Web.
LazySizes is a JavaScript library used to delay the loading of images (iframes, scripts, etc) until they come into view.
Varnish is a reverse caching proxy.
YouTube is a video sharing service where users can create their own profile, upload videos, watch, like and comment on other videos.
core-js is a modular standard library for JavaScript, with polyfills for cutting-edge ECMAScript features.
jQuery is a JavaScript library which is a free, open-source software designed to simplify HTML DOM tree traversal and manipulation, as well as event handling, CSS animation, and Ajax.
Acquia Site Factory is a multisite platform for Drupal.
Drupal Multisite enables separate, independent sites to be served from a single codebase.
Facebook pixel is an analytics tool that allows you to measure the effectiveness of your advertising.
Google Analytics is a free web analytics service that tracks and reports website traffic.
Google Tag Manager is a tag management system (TMS) that allows you to quickly and easily update measurement codes and related code fragments collectively known as tags on your website or mobile app.
Siteimprove is a digital analytics and content QA platform.
StackAdapt is a platform that provides a content advertising strategy solution for planning, executing, and optimizing digital campaigns.
Observations (2)
No build tool detected
A framework (Facebook SDK) was detected but no bundler was identified. The build tool may not be detectable from output patterns, or the site may use the framework's built-in bundler.
Complex technology stack detected
25 technologies identified. A complex stack increases maintenance burden and attack surface. Consider whether all components are actively needed.
Show your score
Drop this badge on your README, marketing site, or status page. It auto-updates every time the audit re-runs and links back to this report.
This badge auto-updates with your latest scan result.
[](https://beavercheck.com/results/250c375e-c60f-7702-04ec-b8c4cea14ad7)<a href="https://beavercheck.com/results/250c375e-c60f-7702-04ec-b8c4cea14ad7"><img src="https://beavercheck.com/badge?url=https%3A%2F%2Fwww.uottawa.ca" alt="BeaverCheck Score"></a>https://beavercheck.com/badge?url=https%3A%2F%2Fwww.uottawa.caExport & share
Download the audit, share with your team, or grab a fix plan ready to copy into your tracker.
Copies markdown to clipboard
Fix Plan
Three-week roadmap to ship the audit's findings, with one-click copy targets for your tracker.
Three-week fix plan
2 sprints · 6h total → projected B (82)
Sprint 1: Quick Wins
+4Highest ROI — low effort, high impact
- · Page weighs 8.0 MB (4.6 MB transferred)
- · Cross-Origin-Opener-Policy header is missing
- · External link from cdnjs.cloudflare.com lacks integrity attribute
Sprint 2: Core Fixes
+2Medium effort, high structural impact
- · Cross-Origin-Embedder-Policy header is missing
- · 106 HTTP requests — consider bundling or reducing