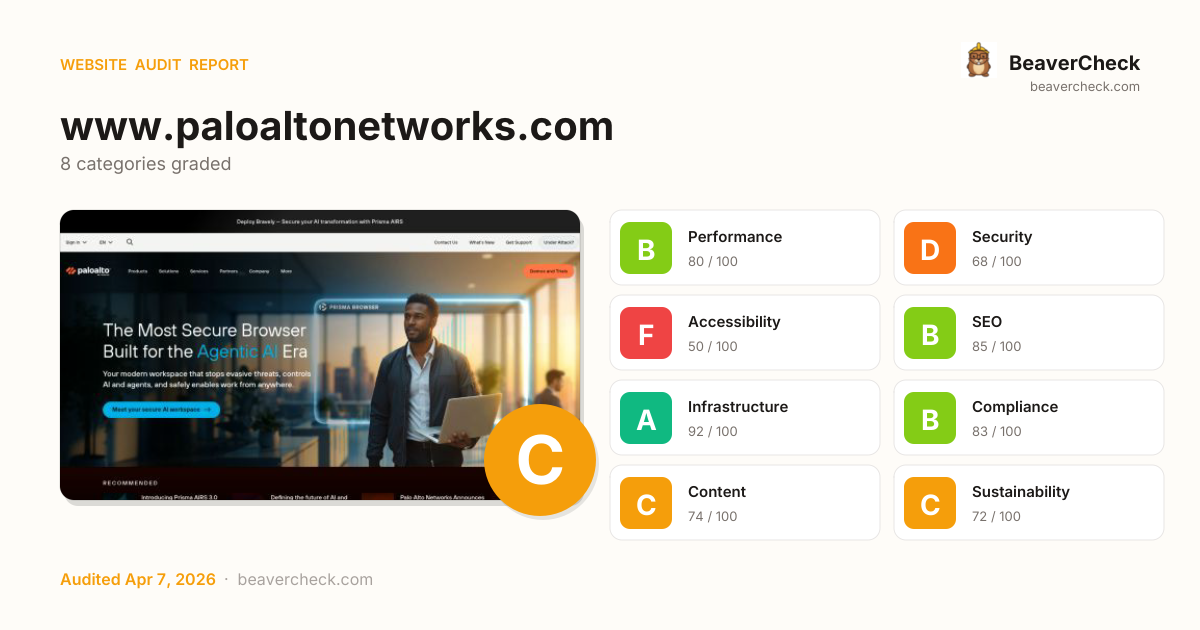
Audit overview
Security and Accessibility need attention; the other categories are in good shape.
Fix Priority Matrix
5 findingsQuick Wins
4High impact, low effort — start here.
Strategic
1High impact, requires investment.
Easy Improvements
0Small gains, minimal effort.
Nothing in this quadrant — good news.
Deprioritize
0Low impact, high effort — do last.
Nothing in this quadrant — good news.
Screenshots


Top Priorities (5)
3 image-only link(s) without alt text
Image-only links with no alt are unidentifiable to screen-reader users — link's destination is invisible.
6 link(s) with no accessible text
Links with no accessible text (empty <a></a>, image-only no alt, icon-only no aria-label) are unidentifiable to screen readers.
9 control(s) without accessible label
Form controls without labels — assistive tech announces 'edit text' with no context; users can't complete forms.
No <main> landmark found
Without a <main> landmark, screen-reader users can't skip past the navigation to the page content — every page starts with re-reading the menu.
Cookie 'pan-lang-cookie' has no SameSite attribute
Without SameSite, cookies ride along on cross-site requests — enabling CSRF attacks that SameSite=Lax blocks for free.
Business case
What fixing the audit's findings is worth -- and what ignoring them keeps costing.
Return on investment
$242 investment → $14,312/month returns + USD 157,500 risk avoided
Figures combine localized regulatory fine ceilings, search/conversion value priced against local CPC, and bandwidth waste estimates. Results depend on implementation quality and audience composition. Not legal or financial advice.
Conversion barriers
10 barrier(s) likely increasing bounce by ~35%.
- Page takes 6.5s to loadUsers abandon at ~3s — you're 4.0s over the 2.5s threshold→ Optimize render-blocking resources, preload the hero image, and compress images
- Page feels frozen for 666msClicks on the primary CTA are ignored while JavaScript runs→ Break up long tasks; defer non-critical JavaScript to post-hydration
- 9 form field(s) without a labelScreen readers skip unlabeled fields; autofill can't identify them; checkout abandonment spikes→ Associate every input with a visible <label for="…">; add autocomplete attributes
- 174 broken link(s) on the pageClicks land on 404s — trust drops and the session often ends→ Fix or remove the broken destinations surfaced on the Content tab
- No HSTS headerReturning visitors are briefly exposed to downgrade attacks on first request→ Set Strict-Transport-Security: max-age=31536000; includeSubDomains
Preliminary CRO audit — each barrier links to the tab with detailed analysis.
Remediation cost
Start here for the best return on investment
Cost by category
Cost by effort level
Adjust assumptions
Team composition
Multiplier applied to dev hours to reflect QA, design, and PM overhead. Use Dev only for solo work; Full team for projects with formal review processes.
Rates reflect fully-loaded developer cost including overhead
Warning:Cost of inaction
Compliance Risk
$157,500
- No privacy policy link detectedCCPA/CPRA: USD 2,500 – USD 7,500
- Trackers detected but no cookie policy foundCCPA/CPRA: USD 2,500 – USD 7,500
- Trackers detected but no privacy policy foundCCPA/CPRA: USD 2,500 – USD 7,500
Bounce-Rate Cost
$9,399 /mo
+34.9pp bounce · ~3,494 lost visitors/mo
CPC: USD 2.69
Bandwidth Waste
$0.68 /mo
8558.1 MB/mo × 0.080 USD/GB
- Optimize transfer: save ~856 KB per page loadSaves $0.68/mo
Compliance figures represent the statutory maximum fine for the most severe triggered category, capped per regulation — not the sum of per-finding penalties. Based on published regulatory fine ranges. This is not legal advice.
Unique monthly visitors from your analytics
Purchases, signups, or key actions
Optional — for revenue estimation
more engaged visitors from reduced bounce
Fix 4 critical issues to capture this value
How this is calculated
Based on Google/Deloitte research ("Milliseconds Make Millions") showing a ~7% bounce rate increase per additional second of LCP above the 2.5s "Good" threshold.
Your site's LCP: → estimated after fixes.
These are estimates based on industry research — actual results vary
Your data stays in your browser — nothing is sent to our servers
Lighthouse
Mobile
First Contentful Paint First Contentful Paint — how long until the browser renders the first piece of content. Under 1.8s is good.
2.40 s
Largest Contentful Paint Largest Contentful Paint — how long until the largest visible element loads. Under 2.5s is good.
6.52 s
Total Blocking Time Total Blocking Time — total time the main thread was blocked, preventing user input. Under 200ms is good.
666 ms
Cumulative Layout Shift Cumulative Layout Shift — measures visual stability. How much the page layout shifts during loading. Under 0.1 is good.
0.000
Speed Index Speed Index — how quickly content is visually displayed during load. Under 3.4s is good.
4.04 s
Time to Interactive Time to Interactive — how long until the page is fully interactive and responds to user input. Under 3.8s is good.
10.32 s
Desktop
First Contentful Paint First Contentful Paint — how long until the browser renders the first piece of content. Under 1.8s is good.
870 ms
Largest Contentful Paint Largest Contentful Paint — how long until the largest visible element loads. Under 2.5s is good.
1.86 s
Total Blocking Time Total Blocking Time — total time the main thread was blocked, preventing user input. Under 200ms is good.
5 ms
Cumulative Layout Shift Cumulative Layout Shift — measures visual stability. How much the page layout shifts during loading. Under 0.1 is good.
0.004
Speed Index Speed Index — how quickly content is visually displayed during load. Under 3.4s is good.
1.41 s
Time to Interactive Time to Interactive — how long until the page is fully interactive and responds to user input. Under 3.8s is good.
2.19 s
Categories
8Performance
All checks pass
Security
Cookie 'pan-lang-cookie' has no SameSite attribute
Accessibility
3 image-only link(s) without alt text
SEO
All checks pass
Infrastructure
All checks pass
Compliance
All checks pass
Content
All checks pass
Sustainability
All checks pass
How you compare
Where this site stands against peers running the same stack.
Top 10% of WordPress sites score 75+ on Accessibility; you're at 50 — closing this gap is the highest-leverage improvement.
Technology stack
Adobe Experience Manager, on Apache/Java, hosted on Apache HTTP Server, with ...
Stack Architecture
 Adobe Analytics
  Adobe Experience Platform Launch
  Akamai mPulse Adobe Experience Manager
  WordPress
  Boomerang
  FingerprintJS 1.5.1HSTS
  Lozad.js OneTrust
  Open Graph
  Popper
  ServiceNow
  VideoJS 7.20.3
 jQuery 3.6.1
 Java
Java  Apache Akamai Apache HTTP Server
 All Detected Technologies (19)
Akamai is global content delivery network (CDN) services provider for media and software delivery, and cloud security solutions.
Apache is a free and open-source cross-platform web server software.
Java is a class-based, object-oriented programming language that is designed to have as few implementation dependencies as possible.
Adobe Experience Manager (AEM) is a content management solution for building websites, mobile apps and forms.
boomerang is a JavaScript library that measures the page load time experienced by real users, commonly called RUM (Real User Measurement).
FingerprintJS is a browser fingerprinting library that queries browser attributes and computes a hashed visitor identifier from them.
HTTP Strict Transport Security (HSTS) informs browsers that the site should only be accessed using HTTPS.
Lozad.js is a lightweight lazy-loading library that's just 535 bytes minified & gzipped.
Open Graph is a protocol that is used to integrate any web page into the social graph.
Popper is a positioning engine, its purpose is to calculate the position of an element to make it possible to position it near a given reference element.
ServiceNow is a cloud computing platform to help companies manage digital workflows for enterprise operations.
Video.js is a JavaScript and CSS library that makes it easier to work with and build on HTML5 video.
jQuery is a JavaScript library which is a free, open-source software designed to simplify HTML DOM tree traversal and manipulation, as well as event handling, CSS animation, and Ajax.
Adobe Analytics is a web analytics, marketing and cross-channel analytics application.
Adobe Experience Cloud Launch is an extendable tag management solution for Adobe Experience Cloud, Adobe Experience Platform, and other applications.
Akamai mPulse is a real user monitoring (RUM) solution that enables companies to monitor, find, and fix website and application performance issues.
Observations (3)
WordPress detected — review security configuration
WordPress sites benefit from: protecting wp-login.php, disabling XML-RPC if unused, restricting REST API access, and keeping all plugins and themes up to date. Check the Security tab for specific findings.
No build tool detected
A framework (Boomerang) was detected but no bundler was identified. The build tool may not be detectable from output patterns, or the site may use the framework's built-in bundler.
Complex technology stack detected
19 technologies identified. A complex stack increases maintenance burden and attack surface. Consider whether all components are actively needed.
Show your score
Drop this badge on your README, marketing site, or status page. It auto-updates every time the audit re-runs and links back to this report.
This badge auto-updates with your latest scan result.
[](https://beavercheck.com/results/280472c2-7e96-c346-59b8-16e4e5d86b59)<a href="https://beavercheck.com/results/280472c2-7e96-c346-59b8-16e4e5d86b59"><img src="https://beavercheck.com/badge?url=https%3A%2F%2Fwww.paloaltonetworks.com" alt="BeaverCheck Score"></a>https://beavercheck.com/badge?url=https%3A%2F%2Fwww.paloaltonetworks.comExport & share
Download the audit, share with your team, or grab a fix plan ready to copy into your tracker.
Copies markdown to clipboard
Fix Plan
Three-week roadmap to ship the audit's findings, with one-click copy targets for your tracker.
Three-week fix plan
2 sprints · 2h total → projected C (79)
Sprint 1: Quick Wins
+5Highest ROI — low effort, high impact
- · No <main> landmark found
- · 3 image-only link(s) without alt text
- · 6 link(s) with no accessible text
- · Cookie 'pan-lang-cookie' has no SameSite attribute
Sprint 2: Core Fixes
Medium effort, high structural impact
- · 9 control(s) without accessible label