

Global Performance
6/6 locations ✓High global latency — average 875ms across 6 locations, fastest from Sao Paulo (107ms), slowest from Singapore (1441ms). No CDN (document or assets). Cache-Control header is missing. 5 locations above the 500ms target.
Audit overview
4 categories need attention: Infrastructure, and 3 others.
Fix Priority Matrix
5 findingsQuick Wins
3High impact, low effort — start here.
Strategic
2High impact, requires investment.
Easy Improvements
0Small gains, minimal effort.
Nothing in this quadrant — good news.
Deprioritize
0Low impact, high effort — do last.
Nothing in this quadrant — good news.
Screenshots


Your mail setup has problems.
caixa.gov.br fails 2 mail checks: No DMARC record found, No SPF record found. This is the kind of misconfiguration that sends your mail to spam.
Top Priorities (5)
Content-Security-Policy header is missing
Without a CSP, a single XSS bug can exfiltrate everything your users type — including credentials.
Cookie 'security' is missing the Secure flag
A cookie without the Secure flag can leak over HTTP — in HSTS-protected sites, this is still a defense-in-depth gap.
No Content-Security-Policy header found
Without a CSP, a single XSS bug can exfiltrate everything users type — credentials, payment data, session tokens.
Page weighs 12.4 MB (8.6 MB transferred)
Informational: total page weight (uncompressed) and bytes actually transferred over the wire.
1 button(s) with no accessible text
Buttons with no accessible text (icon-only, no aria-label) can't be activated by voice control or understood by screen readers.
Business case
What fixing the audit's findings is worth -- and what ignoring them keeps costing.
Return on investment
BRL 1,215 investment → BRL 2,166/month returns + BRL 50,000,000 risk avoided
Figures combine localized regulatory fine ceilings, search/conversion value priced against local CPC, and bandwidth waste estimates. Results depend on implementation quality and audience composition. Not legal or financial advice.
Conversion barriers
10 barrier(s) likely increasing bounce by ~36%.
- Page takes 28.9s to loadUsers abandon at ~3s — you're 26.4s over the 2.5s threshold→ Optimize render-blocking resources, preload the hero image, and compress images
- Page feels frozen for 1.0sClicks on the primary CTA are ignored while JavaScript runs→ Break up long tasks; defer non-critical JavaScript to post-hydration
- Mixed content on HTTPS pageBrowsers block insecure subresources — broken images, missing scripts, warning badge→ Change http:// URLs inside the page to https:// (or protocol-relative)
- 3 broken link(s) on the pageClicks land on 404s — trust drops and the session often ends→ Fix or remove the broken destinations surfaced on the Content tab
- HSTS is enabled but max-age is short (900s)First-visit protection is in place, but browsers forget the policy sooner than recommended→ Raise Strict-Transport-Security max-age to at least 31536000 (1 year)
Preliminary CRO audit — each barrier links to the tab with detailed analysis.
Remediation cost
Start here for the best return on investment
Cost by category
Cost by effort level
Adjust assumptions
Team composition
Multiplier applied to dev hours to reflect QA, design, and PM overhead. Use Dev only for solo work; Full team for projects with formal review processes.
Rates reflect fully-loaded developer cost including overhead
Warning:Cost of inaction
Compliance Risk
BRL 50.000.000
- 1 non-essential cookie(s) set without consent bannerLGPD: BRL 10.000 – BRL 50.000.000
Bounce-Rate Cost
BRL 2.155 /mo
+35.9pp bounce · ~3,591 lost visitors/mo
CPC: BRL 0.60
Bandwidth Waste
BRL 11 /mo
26910.3 MB/mo × 0.410 BRL/GB
- Optimize transfer: save ~2.7 MB per page loadSaves BRL 11/mo
Compliance figures represent the statutory maximum fine for the most severe triggered category, capped per regulation — not the sum of per-finding penalties. Based on published regulatory fine ranges. This is not legal advice.
Unique monthly visitors from your analytics
Purchases, signups, or key actions
Optional — for revenue estimation
more engaged visitors from reduced bounce
Fix 5 critical issues to capture this value
How this is calculated
Based on Google/Deloitte research ("Milliseconds Make Millions") showing a ~7% bounce rate increase per additional second of LCP above the 2.5s "Good" threshold.
Your site's LCP: → estimated after fixes.
These are estimates based on industry research — actual results vary
Your data stays in your browser — nothing is sent to our servers
Lighthouse
Mobile
First Contentful Paint First Contentful Paint — how long until the browser renders the first piece of content. Under 1.8s is good.
8.73 s
Largest Contentful Paint Largest Contentful Paint — how long until the largest visible element loads. Under 2.5s is good.
28.93 s
Total Blocking Time Total Blocking Time — total time the main thread was blocked, preventing user input. Under 200ms is good.
1.01 s
Cumulative Layout Shift Cumulative Layout Shift — measures visual stability. How much the page layout shifts during loading. Under 0.1 is good.
0.035
Speed Index Speed Index — how quickly content is visually displayed during load. Under 3.4s is good.
17.61 s
Time to Interactive Time to Interactive — how long until the page is fully interactive and responds to user input. Under 3.8s is good.
32.09 s
Desktop
First Contentful Paint First Contentful Paint — how long until the browser renders the first piece of content. Under 1.8s is good.
1.79 s
Largest Contentful Paint Largest Contentful Paint — how long until the largest visible element loads. Under 2.5s is good.
5.19 s
Total Blocking Time Total Blocking Time — total time the main thread was blocked, preventing user input. Under 200ms is good.
98 ms
Cumulative Layout Shift Cumulative Layout Shift — measures visual stability. How much the page layout shifts during loading. Under 0.1 is good.
0.009
Speed Index Speed Index — how quickly content is visually displayed during load. Under 3.4s is good.
4.92 s
Time to Interactive Time to Interactive — how long until the page is fully interactive and responds to user input. Under 3.8s is good.
5.89 s
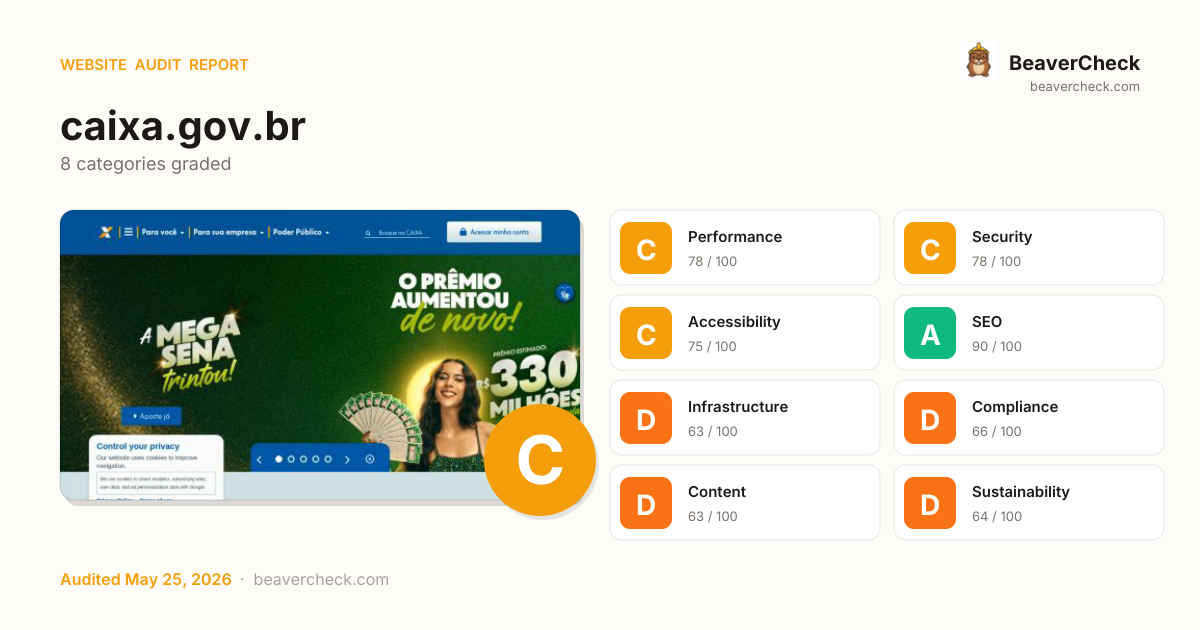
Categories
8Performance
Page weighs 12.4 MB (8.6 MB transferred)
Security
Content-Security-Policy header is missing
Accessibility
1 button(s) with no accessible text
SEO
All checks pass
Infrastructure
All checks pass
Compliance
All checks pass
Content
All checks pass
Sustainability
All checks pass
How you compare
Where this site stands against peers running the same stack.
Top 10% of Cart Functionality sites score 93+ on Infrastructure; you're at 63 — closing this gap is the highest-leverage improvement.
Technology stack
Microsoft SharePoint
Stack Architecture
 Facebook Pixel
  Google Analytics
  Google Tag Manager
  Microsoft Clarity
  Cart Functionality
  Microsoft SharePoint
  AdOpt
AdOpt  Font Awesome 6HSTS
  Microsoft ASP.NET
  Priority Hints
  Svelte
  Swiper
  jQuery 3.7.1
 jQuery UI 1.14.0
All Detected Technologies (15)
SharePoint is a cloud-based collaborative platform to manage and share content.
Websites that have a shopping cart or checkout page, either using a known ecommerce platform or a custom solution.
AdOpt is a consent tool that prioritises privacy and usability towards the LGPD.
Font Awesome is a font and icon toolkit based on CSS and Less.
HTTP Strict Transport Security (HSTS) informs browsers that the site should only be accessed using HTTPS.
ASP.NET is an open-source, server-side web-application framework designed for web development to produce dynamic web pages.
Priority Hints exposes a mechanism for developers to signal a relative priority for browsers to consider when fetching resources.
Svelte is a free and open-source front end compiler created by Rich Harris and maintained by the Svelte core team members.
Swiper is a JavaScript library that creates modern touch sliders with hardware-accelerated transitions.
jQuery is a JavaScript library which is a free, open-source software designed to simplify HTML DOM tree traversal and manipulation, as well as event handling, CSS animation, and Ajax.
jQuery UI is a collection of GUI widgets, animated visual effects, and themes implemented with jQuery, Cascading Style Sheets, and HTML.
Facebook pixel is an analytics tool that allows you to measure the effectiveness of your advertising.
Google Analytics is a free web analytics service that tracks and reports website traffic.
Google Tag Manager is a tag management system (TMS) that allows you to quickly and easily update measurement codes and related code fragments collectively known as tags on your website or mobile app.
Microsoft's Clarity is a analytics tool which provides website usage statistics, session recording, and heatmaps.
Observations (3)
jQuery loaded alongside a modern framework
Both jQuery and Svelte are loaded. Modern frameworks handle DOM manipulation natively. jQuery may be unnecessary and adds ~30KB to the page weight. Check the Performance tab for bundle analysis.
No build tool detected
A framework (AdOpt) was detected but no bundler was identified. The build tool may not be detectable from output patterns, or the site may use the framework's built-in bundler.
Complex technology stack detected
15 technologies identified. A complex stack increases maintenance burden and attack surface. Consider whether all components are actively needed.
Show your score
Drop this badge on your README, marketing site, or status page. It auto-updates every time the audit re-runs and links back to this report.

This badge auto-updates with your latest scan result.
[](https://beavercheck.com/sites/caixa.gov.br)<a href="https://beavercheck.com/sites/caixa.gov.br"><img src="https://beavercheck.com/badge?url=https%3A%2F%2Fcaixa.gov.br" alt="BeaverCheck Score"></a>https://beavercheck.com/badge?url=https%3A%2F%2Fcaixa.gov.brExport & share
Download the audit, share with your team, or grab a fix plan ready to copy into your tracker.
Copies markdown to clipboard
Fix Plan
Three-week roadmap to ship the audit's findings, with one-click copy targets for your tracker.
Three-week fix plan
2 sprints · 7h total → projected B (85)
Sprint 1: Quick Wins
+7Highest ROI — low effort, high impact
- · Page weighs 12.4 MB (8.6 MB transferred)
- · Cookie 'security' is missing the Secure flag
- · 1 button(s) with no accessible text
Sprint 2: Core Fixes
+3Medium effort, high structural impact
- · Content-Security-Policy header is missing
- · No Content-Security-Policy header found