United States · Santa Clara Completed: Apr 15, 2026 23:27 UTC
Mobile 375 × 812

Desktop 1440 × 900
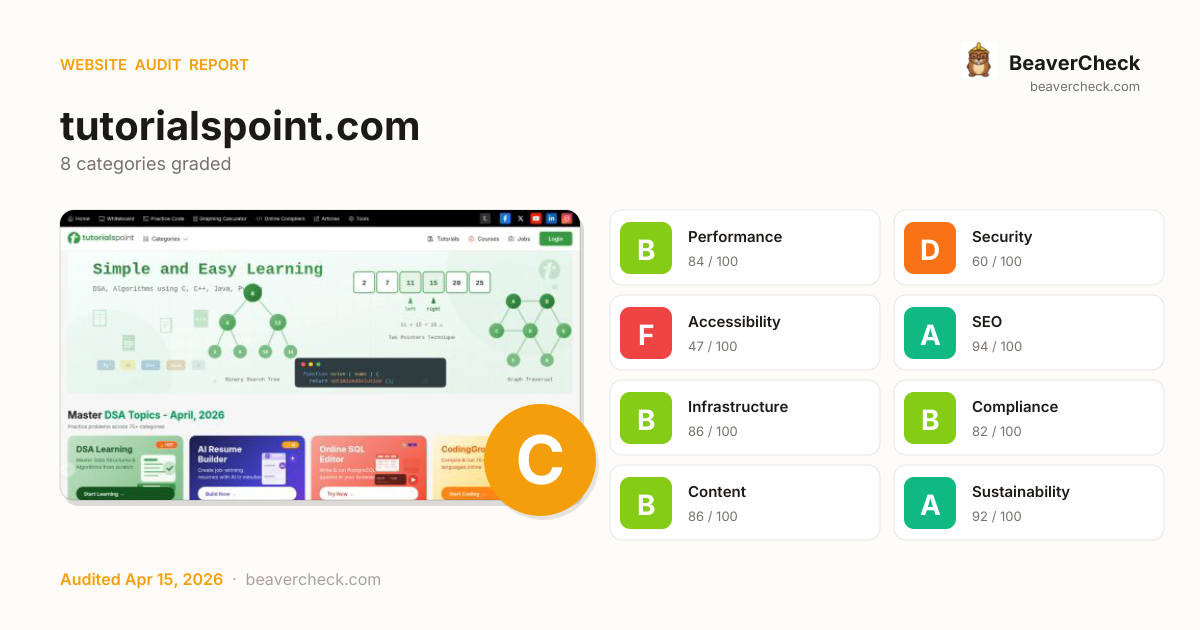
Score: 74 / 100
Based on 8 categories, 0 sections
Decent speed, but optimizing further could improve engagement.
Several missing protections leave your users and data exposed.
Major barriers for users with disabilities — up to 15% of your audience.
Well-optimized for search — your content is discoverable.
Solid infrastructure — fast server responses across the board.
Mostly compliant — a few items need attention.
Rich content metadata — your pages look great everywhere.
Lean and efficient — low environmental impact per visit.
The overall score is a weighted average of individual category scores. Categories with more impact on user experience and security carry more weight.
Weights reflect general web best practices. Individual needs may differ.
/.git/HEAD is publicly accessible
Security gaps expose your site and users to attacks, eroding trust.
/.git/config is publicly accessible
Security gaps expose your site and users to attacks, eroding trust.
Content-Security-Policy header is missing
Security gaps expose your site and users to attacks, eroding trust.
No Content-Security-Policy header found
Security gaps expose your site and users to attacks, eroding trust.
1 control(s) without accessible label
Accessibility issues exclude users with disabilities — up to 15% of your potential audience.
High impact, low effort — start here.
High impact, requires investment.
Small gains, minimal effort.
Nothing in this quadrant — good news.
Low impact, high effort — do last.
Nothing in this quadrant — good news.
[](https://beavercheck.com/results/322d307c-b601-45ad-af06-b5030b32af54)<a href="https://beavercheck.com/results/322d307c-b601-45ad-af06-b5030b32af54"><img src="https://beavercheck.com/badge?url=https%3A%2F%2Ftutorialspoint.com" alt="BeaverCheck Score"></a>https://beavercheck.com/badge?url=https%3A%2F%2Ftutorialspoint.comThis badge auto-updates with your latest scan result.
Your site performs reasonably well, but a few targeted fixes could meaningfully improve results. Accessibility issues exclude users who rely on assistive technology — an estimated 15% of your potential audience. Addressing the critical issues below would have the most immediate impact on your user trust.
€315 investment → €2,572/month returns + EUR 120,500,000 risk avoided
€315
4h · 5 findings
€2,572 /mo
~€30,860 / year
EUR 120,500,000
if kept compliant
€180 — in quick wins — start here for the fastest payback
Figures combine localized regulatory fine ceilings, search/conversion value priced against local CPC, and bandwidth waste estimates. Results depend on implementation quality and audience composition. Not legal or financial advice.
3.5 developer hours at €90/hr
Based on Germany rates (€90/hr)
Start here for the best return on investment
€10,041,667 / month at risk
~€120,500,002 / year if left unfixed
€120,500,000
+11 more
€0.13 /mo
1812.4 MB/mo × 0.074 EUR/GB
Compliance figures represent the statutory maximum fine for the most severe triggered category, capped per regulation — not the sum of per-finding penalties. Based on published regulatory fine ranges. This is not legal advice.
Unique monthly visitors from your analytics
Purchases, signups, or key actions
Optional — for revenue estimation
more engaged visitors from reduced bounce
Fix 5 critical issues to capture this value
Based on Google/Deloitte research ("Milliseconds Make Millions") showing a ~7% bounce rate increase per additional second of LCP above the 2.5s "Good" threshold.
Your site's LCP: → estimated after fixes.
These are estimates based on industry research — actual results vary
Your data stays in your browser — nothing is sent to our servers
Thanks for your feedback!
We'll use a cached audit if available, or offer to scan.
Industry-standard audits powered by Google Lighthouse.
Key metrics that affect user experience.
First Contentful Paint First Contentful Paint — how long until the browser renders the first piece of content. Under 1.8s is good.
4.02 s
Largest Contentful Paint Largest Contentful Paint — how long until the largest visible element loads. Under 2.5s is good.
4.17 s
Total Blocking Time Total Blocking Time — total time the main thread was blocked, preventing user input. Under 200ms is good.
354 ms
Cumulative Layout Shift Cumulative Layout Shift — measures visual stability. How much the page layout shifts during loading. Under 0.1 is good.
0.009
Speed Index Speed Index — how quickly content is visually displayed during load. Under 3.4s is good.
4.02 s
Time to Interactive Time to Interactive — how long until the page is fully interactive and responds to user input. Under 3.8s is good.
6.33 s
Audit breakdown by category with detailed findings.
Remove large, duplicate JavaScript modules from bundles to reduce unnecessary bytes consumed by network activity.
Performance issues directly impact user engagement and conversion rates.
Polyfills and transforms enable older browsers to use new JavaScript features. However, many aren't necessary for modern browsers. Consider modifying your JavaScript build process to not transpile Baseline features, unless you know you must support older browsers. Learn why most sites can deploy ES6+ code without transpiling
Shipping ES5 transpiled code to modern browsers wastes bytes — every user with an evergreen browser pays for compatibility you don't need.
Most users today run browsers that natively support ES6+, async/await, optional chaining, and the rest of modern JavaScript. Transpiling to ES5 'just in case' adds 20-40% to your bundle for no benefit. Configure your build to target a modern browserslist, or ship a differential bundle pair (modern + legacy) with the module/nomodule pattern.
Source: Google web.dev / Lighthouse
3rd party code can significantly impact load performance. Reduce and defer loading of 3rd party code to prioritize your page's content.
Performance issues directly impact user engagement and conversion rates.
Your first network request is the most important. Reduce its latency by avoiding redirects, ensuring a fast server response, and enabling text compression.
Performance issues directly impact user engagement and conversion rates.
A forced reflow occurs when JavaScript queries geometric properties (such as offsetWidth) after styles have been invalidated by a change to the DOM state. This can result in poor performance. Learn more about forced reflows and possible mitigations.
Performance issues directly impact user engagement and conversion rates.
Optimize LCP by making the LCP image discoverable from the HTML immediately, and avoiding lazy-loading
Performance issues directly impact user engagement and conversion rates.
Avoid chaining critical requests by reducing the length of chains, reducing the download size of resources, or deferring the download of unnecessary resources to improve page load.
Performance issues directly impact user engagement and conversion rates.
Requests are blocking the page's initial render, which may delay LCP. Deferring or inlining can move these network requests out of the critical path.
Performance issues directly impact user engagement and conversion rates.
| URL | Transfer Size | Duration |
|---|---|---|
| fonts.googleapis.com/css2?family=Inter:wght@400;500;600;700;800&display=swap | 1.2 KiB | 836 ms |
| kit.fontawesome.com/d10db5a94a.js | 5.6 KiB | 771 ms |
| cdn.jsdelivr.net/npm/swiper@11/swiper-bundle.min.css | 5.4 KiB | 776 ms |
| www.tutorialspoint.com/practice/css/practice-common.css?v7 | 14.1 KiB |
A long cache lifetime can speed up repeat visits to your page. Learn more about caching.
Performance issues directly impact user engagement and conversion rates.
Reducing the download time of images can improve the perceived load time of the page and LCP. Learn more about optimizing image size
Performance issues directly impact user engagement and conversion rates.
| URL | Resource Size | Est Savings | |
|---|---|---|---|
body > section.coding-ground > div.coding-ground-card > ::before body > section.coding-ground > div.coding-ground-card > ::before | www.tutorialspoint.com/static/img/auth/bg-bottom.png | 177.2 KiB | 37.1 KiB |
These insights are also available in the Chrome DevTools Performance Panel - record a trace to view more detailed information.
Redirects introduce additional delays before the page can be loaded. Learn how to avoid page redirects.
Performance issues directly impact user engagement and conversion rates.
| URL | Time Spent |
|---|---|
| tutorialspoint.com/ | 1.2 s |
| www.tutorialspoint.com/ | 0.0 ms |
The maximum potential First Input Delay that your users could experience is the duration of the longest task. Learn more about the Maximum Potential First Input Delay metric.
Performance issues directly impact user engagement and conversion rates.
Time to Interactive is the amount of time it takes for the page to become fully interactive. Learn more about the Time to Interactive metric.
Performance issues directly impact user engagement and conversion rates.
Consider reducing the time spent parsing, compiling and executing JS. You may find delivering smaller JS payloads helps with this. Learn how to minimize main-thread work
Performance issues directly impact user engagement and conversion rates.
| Category | Time Spent |
|---|---|
| Other | 1.8 s |
| Style & Layout | 1.4 s |
| Script Evaluation | 1.1 s |
| Rendering | 928 ms |
| Script Parsing & Compilation | 117 ms |
| Parse HTML & CSS | 70 ms |
| Garbage Collection | 30 ms |
Minifying CSS files can reduce network payload sizes. Learn how to minify CSS.
Performance issues directly impact user engagement and conversion rates.
| URL | Transfer Size | Est Savings |
|---|---|---|
| www.tutorialspoint.com/practice/css/practice-common.css?v7 | 14.1 KiB | 5.1 KiB |
Reduce unused JavaScript and defer loading scripts until they are required to decrease bytes consumed by network activity. Learn how to reduce unused JavaScript.
Multi-megabyte JavaScript bundles delay every interactive feature on the page.
This is the Lighthouse audit fired when too much JS is shipped relative to what executes. The fix isn't a config flag — it requires bundle analysis (webpack-bundle-analyzer, rollup-plugin-visualizer), splitting routes into chunks, lazy-loading off-screen components, and removing unused dependencies. Fundamentally different from minification: minifying reduces byte count, this reduces what's downloaded at all.
Source: Google web.dev / Lighthouse
| URL | Transfer Size | Est Savings |
|---|---|---|
| www.googletagmanager.com/gtag/js?id=G-EX9ZP4VY84 | 170.2 KiB | 68.3 KiB |
| cdn.jsdelivr.net/npm/swiper@11/swiper-bundle.min.js | 43.0 KiB | 27.6 KiB |
Set an explicit width and height on image elements to reduce layout shifts and improve CLS. Learn how to set image dimensions
Performance issues directly impact user engagement and conversion rates.
| URL | |
|---|---|
body > div.tp-main-content > div.container > img.hero-image body > div.tp-main-content > div.container > img.hero-image | www.tutorialspoint.com/images/tp_hero_image.svg |
tutorials point logo body > footer.footer > div.footer__socials > img.footer__logo | www.tutorialspoint.com/static/images/logo-footer.svg |
Download Android App div.footer__socials > div.footer__apps > a > img | www.tutorialspoint.com/static/images/googleplay.svg |
Download IOS App div.footer__socials > div.footer__apps > a > img | www.tutorialspoint.com/static/images/appstore.svg |
More information about the performance of your application. These numbers don't directly affect the Performance score.
These checks highlight opportunities to improve the accessibility of your web app. Automatic detection can only detect a subset of issues and does not guarantee the accessibility of your web app, so manual testing is also encouraged.
When a button doesn't have an accessible name, screen readers announce it as "button", making it unusable for users who rely on screen readers. Learn how to make buttons more accessible.
Performance issues directly impact user engagement and conversion rates.
| Failing Elements |
|---|
div.tp-header-inner > div.tp-header-left > div.tp-categories-wrapper > button.tp-categories-btn div.tp-header-inner > div.tp-header-left > div.tp-categories-wrapper > button.tp-categories-btn |
Informative elements should aim for short, descriptive alternate text. Decorative elements can be ignored with an empty alt attribute. Learn more about the `alt` attribute.
Performance issues directly impact user engagement and conversion rates.
| Failing Elements |
|---|
body > div.tp-main-content > div.container > img.hero-image body > div.tp-main-content > div.container > img.hero-image |
Form elements without effective labels can create frustrating experiences for screen reader users. Learn more about the `select` element.
Performance issues directly impact user engagement and conversion rates.
| Failing Elements |
|---|
All Topics
Array
Array manipulation
Backtracking
Biconnected Component
Binary I… body > section#problems > div#filterForm > select#topicFilter |
Link text (and alternate text for images, when used as links) that is discernible, unique, and focusable improves the navigation experience for screen reader users. Learn how to make links accessible.
Performance issues directly impact user engagement and conversion rates.
| Failing Elements |
|---|
section#problems > div#problemsPagination > div.practice-pagination-btns > a.practice-page-btn section#problems > div#problemsPagination > div.practice-pagination-btns > a.practice-page-btn |
These are opportunities to improve the semantics of the controls in your application. This may enhance the experience for users of assistive technology, like a screen reader.
Low-contrast text is difficult or impossible for many users to read. Learn how to provide sufficient color contrast.
Performance issues directly impact user engagement and conversion rates.
| Failing Elements |
|---|
Login header.tp-header > div.tp-header-inner > div.tp-header-right > a.tp-login-btn |
DSA Topics - April, 2026 div.tp-main-content > div.container > h2.section-title > span |
🔥 HOT div#swiper-wrapper-446239fcc4c6e79d > div.swiper-slide > a.banner > span.badge |
1,947 Problems div#cardsGrid > a.card > div > div.count |
803 Problems div#cardsGrid > a.card > div > div.count |
719 Problems div#cardsGrid > a.card > div > div.count |
602 Problems div#cardsGrid > a.card > div > div.count |
464 Problems div#cardsGrid > a.card > div > div.count |
420 Problems div#cardsGrid > a.card > div > div.count |
325 Problems div#cardsGrid > a.card > div > div.count |
73 Categories div#cardsGrid > div#seeAllBtn > div > div.count |
Coding Problems div.practice-title-wrapper > div > h2.section-title > span |
3800+ div.practice-title-wrapper > div > p.section-subtitle > strong |
All section#problems > div#filterForm > div.practice-filter-btns > button.practice-filter-btn |
Copyright 2026. All Rights Reserved. footer.footer > div.footer__legal-wrapper > div.footer__legal > p.footer__copyright |
These are opportunities to improve the legibility of your content.
Properly ordered headings that do not skip levels convey the semantic structure of the page, making it easier to navigate and understand when using assistive technologies. Learn more about heading order.
Performance issues directly impact user engagement and conversion rates.
| Failing Elements |
|---|
Python Tutorial div.container > div.proto6-main > a.proto6-card > h4 |
AI Resume Builder div#swiper-wrapper-9143ffb4937f10da0 > div.swiper-slide > a.dev-tool-card > h4 |
These are opportunities to improve keyboard navigation in your application.
Touch targets with sufficient size and spacing help users who may have difficulty targeting small controls to activate the targets. Learn more about touch targets.
Performance issues directly impact user engagement and conversion rates.
| Failing Elements |
|---|
ABOUT US footer.footer > ul.footer__list > li > a |
OUR TEAM footer.footer > ul.footer__list > li > a |
CAREERS footer.footer > ul.footer__list > li > a |
JOBS footer.footer > ul.footer__list > li > a |
CONTACT US footer.footer > ul.footer__list > li > a |
TERMS OF USE footer.footer > ul.footer__list > li > a |
PRIVACY POLICY footer.footer > ul.footer__list > li > a |
REFUND POLICY footer.footer > ul.footer__list > li > a |
COOKIES POLICY footer.footer > ul.footer__list > li > a |
FAQ'S footer.footer > ul.footer__list > li > a |
One main landmark helps screen reader users navigate a web page. Learn more about landmarks.
Performance issues directly impact user engagement and conversion rates.
| Failing Elements |
|---|
html.fontawesome-i2svg-active html.fontawesome-i2svg-active |
These items highlight common accessibility best practices.
These checks ensure that your page is following basic search engine optimization advice. There are many additional factors Lighthouse does not score here that may affect your search ranking, including performance on Core Web Vitals. Learn more about Google Search Essentials.
Informative elements should aim for short, descriptive alternate text. Decorative elements can be ignored with an empty alt attribute. Learn more about the `alt` attribute.
Performance issues directly impact user engagement and conversion rates.
| Failing Elements |
|---|
body > div.tp-main-content > div.container > img.hero-image body > div.tp-main-content > div.container > img.hero-image |
Format your HTML in a way that enables crawlers to better understand your app’s content.
Industry-standard audits powered by Google Lighthouse. — Desktop
Key metrics that affect user experience. — Desktop
First Contentful Paint First Contentful Paint — how long until the browser renders the first piece of content. Under 1.8s is good.
1.51 s
Largest Contentful Paint Largest Contentful Paint — how long until the largest visible element loads. Under 2.5s is good.
1.51 s
Total Blocking Time Total Blocking Time — total time the main thread was blocked, preventing user input. Under 200ms is good.
0 ms
Cumulative Layout Shift Cumulative Layout Shift — measures visual stability. How much the page layout shifts during loading. Under 0.1 is good.
0.019
Speed Index Speed Index — how quickly content is visually displayed during load. Under 3.4s is good.
1.51 s
Time to Interactive Time to Interactive — how long until the page is fully interactive and responds to user input. Under 3.8s is good.
1.51 s
Audit breakdown by category with detailed findings.
Remove large, duplicate JavaScript modules from bundles to reduce unnecessary bytes consumed by network activity.
Performance issues directly impact user engagement and conversion rates.
Polyfills and transforms enable older browsers to use new JavaScript features. However, many aren't necessary for modern browsers. Consider modifying your JavaScript build process to not transpile Baseline features, unless you know you must support older browsers. Learn why most sites can deploy ES6+ code without transpiling
Shipping ES5 transpiled code to modern browsers wastes bytes — every user with an evergreen browser pays for compatibility you don't need.
Most users today run browsers that natively support ES6+, async/await, optional chaining, and the rest of modern JavaScript. Transpiling to ES5 'just in case' adds 20-40% to your bundle for no benefit. Configure your build to target a modern browserslist, or ship a differential bundle pair (modern + legacy) with the module/nomodule pattern.
Source: Google web.dev / Lighthouse
3rd party code can significantly impact load performance. Reduce and defer loading of 3rd party code to prioritize your page's content.
Performance issues directly impact user engagement and conversion rates.
Your first network request is the most important. Reduce its latency by avoiding redirects, ensuring a fast server response, and enabling text compression.
Performance issues directly impact user engagement and conversion rates.
A forced reflow occurs when JavaScript queries geometric properties (such as offsetWidth) after styles have been invalidated by a change to the DOM state. This can result in poor performance. Learn more about forced reflows and possible mitigations.
Performance issues directly impact user engagement and conversion rates.
Optimize LCP by making the LCP image discoverable from the HTML immediately, and avoiding lazy-loading
Performance issues directly impact user engagement and conversion rates.
Avoid chaining critical requests by reducing the length of chains, reducing the download size of resources, or deferring the download of unnecessary resources to improve page load.
Performance issues directly impact user engagement and conversion rates.
Requests are blocking the page's initial render, which may delay LCP. Deferring or inlining can move these network requests out of the critical path.
Performance issues directly impact user engagement and conversion rates.
| URL | Transfer Size | Duration |
|---|---|---|
| fonts.googleapis.com/css2?family=Inter:wght@400;500;600;700;800&display=swap | 1.2 KiB | 289 ms |
| kit.fontawesome.com/d10db5a94a.js | 5.6 KiB | 233 ms |
| cdn.jsdelivr.net/npm/swiper@11/swiper-bundle.min.css | 5.1 KiB | 212 ms |
| www.tutorialspoint.com/practice/css/practice-common.css?v7 | 14.1 KiB |
A long cache lifetime can speed up repeat visits to your page. Learn more about caching.
Performance issues directly impact user engagement and conversion rates.
Reducing the download time of images can improve the perceived load time of the page and LCP. Learn more about optimizing image size
Performance issues directly impact user engagement and conversion rates.
| URL | Resource Size | Est Savings | |
|---|---|---|---|
body > section.coding-ground > div.coding-ground-card > ::before body > section.coding-ground > div.coding-ground-card > ::before | www.tutorialspoint.com/static/img/auth/bg-bottom.png | 177.2 KiB | 37.1 KiB |
These insights are also available in the Chrome DevTools Performance Panel - record a trace to view more detailed information.
Minifying CSS files can reduce network payload sizes. Learn how to minify CSS.
Performance issues directly impact user engagement and conversion rates.
| URL | Transfer Size | Est Savings |
|---|---|---|
| www.tutorialspoint.com/practice/css/practice-common.css?v7 | 14.1 KiB | 5.1 KiB |
Reduce unused JavaScript and defer loading scripts until they are required to decrease bytes consumed by network activity. Learn how to reduce unused JavaScript.
Multi-megabyte JavaScript bundles delay every interactive feature on the page.
This is the Lighthouse audit fired when too much JS is shipped relative to what executes. The fix isn't a config flag — it requires bundle analysis (webpack-bundle-analyzer, rollup-plugin-visualizer), splitting routes into chunks, lazy-loading off-screen components, and removing unused dependencies. Fundamentally different from minification: minifying reduces byte count, this reduces what's downloaded at all.
Source: Google web.dev / Lighthouse
| URL | Transfer Size | Est Savings |
|---|---|---|
| www.googletagmanager.com/gtag/js?id=G-EX9ZP4VY84 | 170.2 KiB | 68.3 KiB |
| cdn.jsdelivr.net/npm/swiper@11/swiper-bundle.min.js | 43.0 KiB | 27.6 KiB |
Set an explicit width and height on image elements to reduce layout shifts and improve CLS. Learn how to set image dimensions
Performance issues directly impact user engagement and conversion rates.
| URL | |
|---|---|
body > div.tp-main-content > div.container > img.hero-image body > div.tp-main-content > div.container > img.hero-image | www.tutorialspoint.com/images/tp_hero_image.svg |
tutorials point logo body > footer.footer > div.footer__socials > img.footer__logo | www.tutorialspoint.com/static/images/logo-footer.svg |
Download Android App div.footer__socials > div.footer__apps > a > img | www.tutorialspoint.com/static/images/googleplay.svg |
Download IOS App div.footer__socials > div.footer__apps > a > img | www.tutorialspoint.com/static/images/appstore.svg |
More information about the performance of your application. These numbers don't directly affect the Performance score.
Redirects introduce additional delays before the page can be loaded. Learn how to avoid page redirects.
Performance issues directly impact user engagement and conversion rates.
| URL | Time Spent |
|---|---|
| tutorialspoint.com/ | 679 ms |
| www.tutorialspoint.com/ | 0.0 ms |
These checks highlight opportunities to improve the accessibility of your web app. Automatic detection can only detect a subset of issues and does not guarantee the accessibility of your web app, so manual testing is also encouraged.
Low-contrast text is difficult or impossible for many users to read. Learn how to provide sufficient color contrast.
Performance issues directly impact user engagement and conversion rates.
| Failing Elements |
|---|
Login header.tp-header > div.tp-header-inner > div.tp-header-right > a.tp-login-btn |
DSA Topics - April, 2026 div.tp-main-content > div.container > h2.section-title > span |
🔥 HOT div#swiper-wrapper-c9f7de9bd843d1b8 > div.swiper-slide > a.banner > span.badge |
✨ AI div#swiper-wrapper-c9f7de9bd843d1b8 > div.swiper-slide > a.banner > span.badge |
Start Coding → div#swiper-wrapper-c9f7de9bd843d1b8 > div.swiper-slide > a.banner > span.btn |
1,947 Problems div#cardsGrid > a.card > div > div.count |
803 Problems div#cardsGrid > a.card > div > div.count |
719 Problems div#cardsGrid > a.card > div > div.count |
602 Problems div#cardsGrid > a.card > div > div.count |
464 Problems div#cardsGrid > a.card > div > div.count |
420 Problems div#cardsGrid > a.card > div > div.count |
325 Problems div#cardsGrid > a.card > div > div.count |
73 Categories div#cardsGrid > div#seeAllBtn > div > div.count |
3800+ div.practice-title-wrapper > div > p.section-subtitle > strong |
All section#problems > div#filterForm > div.practice-filter-btns > button.practice-filter-btn |
Medium tbody#problemsTableBody > tr > td > span.practice-difficulty |
Easy tbody#problemsTableBody > tr > td > span.practice-difficulty |
Medium tbody#problemsTableBody > tr > td > span.practice-difficulty |
Medium tbody#problemsTableBody > tr > td > span.practice-difficulty |
Hard tbody#problemsTableBody > tr > td > span.practice-difficulty |
Medium tbody#problemsTableBody > tr > td > span.practice-difficulty |
Medium tbody#problemsTableBody > tr > td > span.practice-difficulty |
Medium tbody#problemsTableBody > tr > td > span.practice-difficulty |
Medium tbody#problemsTableBody > tr > td > span.practice-difficulty |
Medium tbody#problemsTableBody > tr > td > span.practice-difficulty |
Medium tbody#problemsTableBody > tr > td > span.practice-difficulty |
Medium tbody#problemsTableBody > tr > td > span.practice-difficulty |
Easy tbody#problemsTableBody > tr > td > span.practice-difficulty |
Hard tbody#problemsTableBody > tr > td > span.practice-difficulty |
Medium tbody#problemsTableBody > tr > td > span.practice-difficulty |
Copyright 2026. All Rights Reserved. footer.footer > div.footer__legal-wrapper > div.footer__legal > p.footer__copyright |
These are opportunities to improve the legibility of your content.
Properly ordered headings that do not skip levels convey the semantic structure of the page, making it easier to navigate and understand when using assistive technologies. Learn more about heading order.
Performance issues directly impact user engagement and conversion rates.
| Failing Elements |
|---|
Python Tutorial div.container > div.proto6-main > a.proto6-card > h4 |
AI Resume Builder div#swiper-wrapper-d7b14d3f37afbe109 > div.swiper-slide > a.dev-tool-card > h4 |
These are opportunities to improve keyboard navigation in your application.
Informative elements should aim for short, descriptive alternate text. Decorative elements can be ignored with an empty alt attribute. Learn more about the `alt` attribute.
Performance issues directly impact user engagement and conversion rates.
| Failing Elements |
|---|
body > div.tp-main-content > div.container > img.hero-image body > div.tp-main-content > div.container > img.hero-image |
Form elements without effective labels can create frustrating experiences for screen reader users. Learn more about the `select` element.
Performance issues directly impact user engagement and conversion rates.
| Failing Elements |
|---|
All Topics
Array
Array manipulation
Backtracking
Biconnected Component
Binary I… body > section#problems > div#filterForm > select#topicFilter |
Link text (and alternate text for images, when used as links) that is discernible, unique, and focusable improves the navigation experience for screen reader users. Learn how to make links accessible.
Performance issues directly impact user engagement and conversion rates.
| Failing Elements |
|---|
section#problems > div#problemsPagination > div.practice-pagination-btns > a.practice-page-btn section#problems > div#problemsPagination > div.practice-pagination-btns > a.practice-page-btn |
These are opportunities to improve the semantics of the controls in your application. This may enhance the experience for users of assistive technology, like a screen reader.
One main landmark helps screen reader users navigate a web page. Learn more about landmarks.
Performance issues directly impact user engagement and conversion rates.
| Failing Elements |
|---|
html.fontawesome-i2svg-active html.fontawesome-i2svg-active |
These items highlight common accessibility best practices.
These checks ensure that your page is following basic search engine optimization advice. There are many additional factors Lighthouse does not score here that may affect your search ranking, including performance on Core Web Vitals. Learn more about Google Search Essentials.
Informative elements should aim for short, descriptive alternate text. Decorative elements can be ignored with an empty alt attribute. Learn more about the `alt` attribute.
Performance issues directly impact user engagement and conversion rates.
| Failing Elements |
|---|
body > div.tp-main-content > div.container > img.hero-image body > div.tp-main-content > div.container > img.hero-image |
Format your HTML in a way that enables crawlers to better understand your app’s content.
Send Feedback