United States · Santa Clara Completed: Apr 16, 2026 17:39 UTC
Mobile 375 × 812

Desktop 1440 × 900

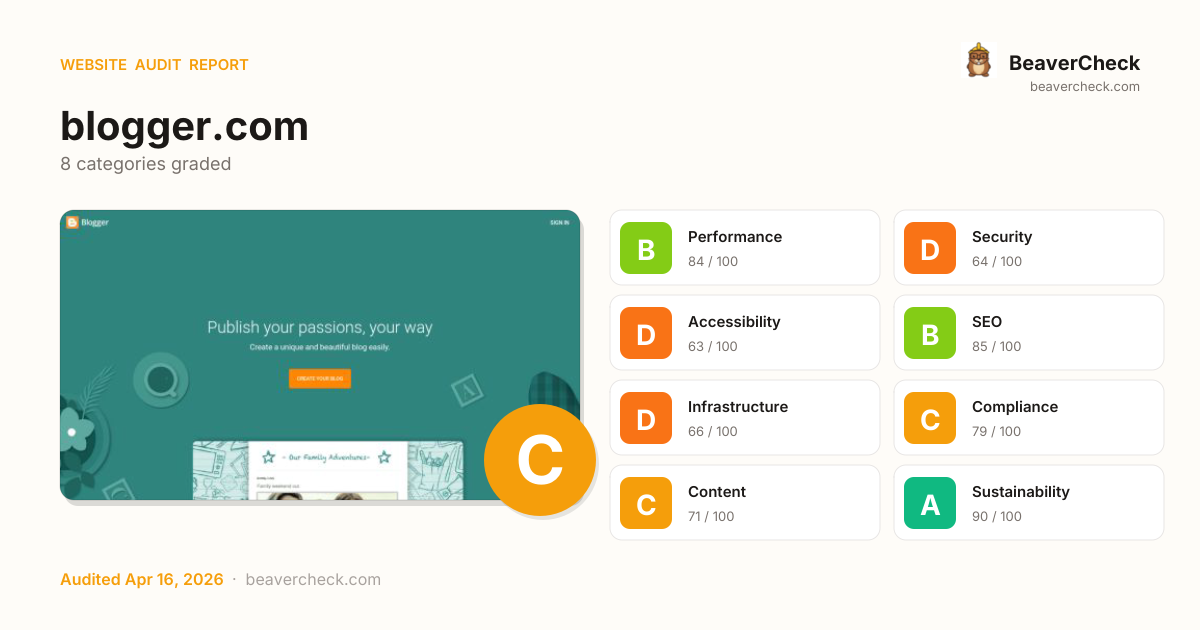
Score: 73 / 100
Based on 8 categories, 0 sections
Decent speed, but optimizing further could improve engagement.
Several missing protections leave your users and data exposed.
Several issues make your site difficult for assistive technology users.
Well-optimized for search — your content is discoverable.
Infrastructure issues create a speed ceiling frontend fixes can't overcome.
Mostly compliant — a few items need attention.
Good content signals with minor gaps.
Lean and efficient — low environmental impact per visit.
The overall score is a weighted average of individual category scores. Categories with more impact on user experience and security carry more weight.
Weights reflect general web best practices. Individual needs may differ.
Content-Security-Policy header is missing
Security gaps expose your site and users to attacks, eroding trust.
HSTS header is missing
Security gaps expose your site and users to attacks, eroding trust.
No Content-Security-Policy header found
Security gaps expose your site and users to attacks, eroding trust.
No H1 heading found
Accessibility issues exclude users with disabilities — up to 15% of your potential audience.
56 third-party resources (100% of weight)
Performance issues directly impact user engagement and conversion rates.
High impact, low effort — start here.
High impact, requires investment.
Small gains, minimal effort.
Nothing in this quadrant — good news.
Low impact, high effort — do last.
Nothing in this quadrant — good news.
[](https://beavercheck.com/results/363db140-ef53-4c71-a9db-15dfe1817492)<a href="https://beavercheck.com/results/363db140-ef53-4c71-a9db-15dfe1817492"><img src="https://beavercheck.com/badge?url=https%3A%2F%2Fblogger.com" alt="BeaverCheck Score"></a>https://beavercheck.com/badge?url=https%3A%2F%2Fblogger.comThis badge auto-updates with your latest scan result.
Your site performs reasonably well, but a few targeted fixes could meaningfully improve results. Your LCP of 6.0s exceeds Google's 2.5s 'Good' threshold and the 1 performance issue below directly contributes to it. Addressing the critical issues below would have the most immediate impact on your user trust.
5 barrier(s) likely increasing bounce by ~25%.
Page takes 6.0s to load
+12% bounceUsers abandon at ~3s — you're 3.5s over the 2.5s threshold
Fix: Optimize render-blocking resources, preload the hero image, and compress images
No HSTS header
+1% bounceReturning visitors are briefly exposed to downgrade attacks on first request
Fix: Set Strict-Transport-Security: max-age=31536000; includeSubDomains
No Content-Security-Policy header
+1% bounceHigher XSS blast radius — one compromised script can exfiltrate the checkout form
Fix: Ship a reporting-only CSP first, then enforce once violations are clean
No structured data
+2% bounceNo rich-result eligibility in Google — lower SERP CTR vs competitors with stars and prices
Fix: Add JSON-LD for your page type (Product, Article, FAQPage, LocalBusiness, …)
32 broken link(s) on the page
+5% bounceClicks land on 404s — trust drops and the session often ends
Fix: Fix or remove the broken destinations surfaced on the Content tab
Preliminary CRO audit — each barrier links to the tab with detailed analysis.
€425 investment → €3,701/month returns + EUR 120,500,000 risk avoided
€425
5h · 5 findings
€3,701 /mo
~€44,417 / year
EUR 120,500,000
if kept compliant
€128 — in quick wins — start here for the fastest payback
Figures combine localized regulatory fine ceilings, search/conversion value priced against local CPC, and bandwidth waste estimates. Results depend on implementation quality and audience composition. Not legal or financial advice.
5.0 developer hours at €85/hr
Based on European Union rates (€85/hr)
Start here for the best return on investment
€10,041,667 / month at risk
~€120,500,004 / year if left unfixed
€120,500,000
+5 more
€0.35 /mo
4721.0 MB/mo × 0.074 EUR/GB
Compliance figures represent the statutory maximum fine for the most severe triggered category, capped per regulation — not the sum of per-finding penalties. Based on published regulatory fine ranges. This is not legal advice.
Unique monthly visitors from your analytics
Purchases, signups, or key actions
Optional — for revenue estimation
more engaged visitors from reduced bounce
Fix 4 critical issues to capture this value
Based on Google/Deloitte research ("Milliseconds Make Millions") showing a ~7% bounce rate increase per additional second of LCP above the 2.5s "Good" threshold.
Your site's LCP: → estimated after fixes.
These are estimates based on industry research — actual results vary
Your data stays in your browser — nothing is sent to our servers
Thanks for your feedback!
We'll use a cached audit if available, or offer to scan.
Industry-standard audits powered by Google Lighthouse.
Key metrics that affect user experience.
First Contentful Paint First Contentful Paint — how long until the browser renders the first piece of content. Under 1.8s is good.
4.52 s
Largest Contentful Paint Largest Contentful Paint — how long until the largest visible element loads. Under 2.5s is good.
6.01 s
Total Blocking Time Total Blocking Time — total time the main thread was blocked, preventing user input. Under 200ms is good.
0 ms
Cumulative Layout Shift Cumulative Layout Shift — measures visual stability. How much the page layout shifts during loading. Under 0.1 is good.
0.001
Speed Index Speed Index — how quickly content is visually displayed during load. Under 3.4s is good.
4.52 s
Time to Interactive Time to Interactive — how long until the page is fully interactive and responds to user input. Under 3.8s is good.
6.01 s
Audit breakdown by category with detailed findings.
Remove large, duplicate JavaScript modules from bundles to reduce unnecessary bytes consumed by network activity.
Performance issues directly impact user engagement and conversion rates.
Polyfills and transforms enable older browsers to use new JavaScript features. However, many aren't necessary for modern browsers. Consider modifying your JavaScript build process to not transpile Baseline features, unless you know you must support older browsers. Learn why most sites can deploy ES6+ code without transpiling
Shipping ES5 transpiled code to modern browsers wastes bytes — every user with an evergreen browser pays for compatibility you don't need.
Most users today run browsers that natively support ES6+, async/await, optional chaining, and the rest of modern JavaScript. Transpiling to ES5 'just in case' adds 20-40% to your bundle for no benefit. Configure your build to target a modern browserslist, or ship a differential bundle pair (modern + legacy) with the module/nomodule pattern.
Source: Google web.dev / Lighthouse
3rd party code can significantly impact load performance. Reduce and defer loading of 3rd party code to prioritize your page's content.
Performance issues directly impact user engagement and conversion rates.
A long cache lifetime can speed up repeat visits to your page. Learn more about caching.
Performance issues directly impact user engagement and conversion rates.
Your first network request is the most important. Reduce its latency by avoiding redirects, ensuring a fast server response, and enabling text compression.
Performance issues directly impact user engagement and conversion rates.
Optimize LCP by making the LCP image discoverable from the HTML immediately, and avoiding lazy-loading
Performance issues directly impact user engagement and conversion rates.
Avoid chaining critical requests by reducing the length of chains, reducing the download size of resources, or deferring the download of unnecessary resources to improve page load.
Performance issues directly impact user engagement and conversion rates.
Requests are blocking the page's initial render, which may delay LCP. Deferring or inlining can move these network requests out of the critical path.
Performance issues directly impact user engagement and conversion rates.
| URL | Transfer Size | Duration |
|---|---|---|
| /css?family=Roboto+Slab:400,700,300|Roboto:400,500,700,30... | 2.5 KiB | 825 ms |
| www.blogger.com/about/css/styles.min.css?v=1476060772 | 6.4 KiB | 172 ms |
Consider setting font-display to swap or optional to ensure text is consistently visible. swap can be further optimized to mitigate layout shifts with font metric overrides.
Performance issues directly impact user engagement and conversion rates.
| URL | Est Savings |
|---|---|
| fonts.gstatic.com/s/roboto/v51/KFO7CnqEu92Fr1ME7kSn66aGLdTylUAMa3yUBHMdazQ.woff2 | 5.0 ms |
Reducing the download time of images can improve the perceived load time of the page and LCP. Learn more about optimizing image size
Performance issues directly impact user engagement and conversion rates.
| URL | Resource Size | Est Savings | |
|---|---|---|---|
Preview template main#maincontent > section#choose-design > div.background > img.background--layer | /img/b/U2hvZWJveA/AVvXsEjsaEt5A4SYwcHEcf8URFjtMn93oIRkU7O... | 226.1 KiB | 207.1 KiB |
Preview template main#maincontent > section#choose-design > div.background > img.background--layer | /img/b/U2hvZWJveA/AVvXsEhMb8VfHaBQc75VuVWTGhAFkvwGOuwukzT... | 122.8 KiB | 83.9 KiB |
Play Icon main#maincontent > section.section > div.background > img.background--layer | /img/b/U2hvZWJveA/AVvXsEifcKcuZTmiN1y1IYI8xRPNgYrkn-jlttJ... | 58.8 KiB | 44.3 KiB |
Family Photo main#maincontent > section.section > div.background > img.background--layer | /img/b/U2hvZWJveA/AVvXsEgXsIMRUWZAjqTgybLi1m2hfUgOVwkJk2B... | 56.1 KiB | 35.0 KiB |
Documents main#maincontent > section.section > div.background > img.background--layer | /img/b/U2hvZWJveA/AVvXsEhj-HOsPWyaNMGlTy0Oy85FJwdlR-DvTWY... | 50.8 KiB | 32.5 KiB |
Calculator main#maincontent > section.section > div.background > img.background--layer | /img/b/U2hvZWJveA/AVvXsEgW5dTZMQN73WuAwOLHt72JBXieDoVVrzj... | 14.3 KiB | 11.4 KiB |
Graphs section.section > div.background > div > img.background--layer | /img/b/U2hvZWJveA/AVvXsEjDW914EBAPitHRrvw_x8DFPK0w38om9GO... | 28.6 KiB | 7.4 KiB |
These insights are also available in the Chrome DevTools Performance Panel - record a trace to view more detailed information.
Redirects introduce additional delays before the page can be loaded. Learn how to avoid page redirects.
Performance issues directly impact user engagement and conversion rates.
| URL | Time Spent |
|---|---|
| blogger.com/ | 773 ms |
| www.blogger.com/ | 772 ms |
| /ServiceLogin?passive=true&go=true&service=blogger&contin... | 799 ms |
| www.blogger.com/?bpli=1 | 0.0 ms |
| www.blogger.com/about?bpli=1 | 0.0 ms |
| www.blogger.com/about/?bpli=1 | 0.0 ms |
Time to Interactive is the amount of time it takes for the page to become fully interactive. Learn more about the Time to Interactive metric.
Performance issues directly impact user engagement and conversion rates.
Set an explicit width and height on image elements to reduce layout shifts and improve CLS. Learn how to set image dimensions
Performance issues directly impact user engagement and conversion rates.
| URL | |
|---|---|
Graphs section.section > div.background > div > img.background--layer | /img/b/U2hvZWJveA/AVvXsEjDW914EBAPitHRrvw_x8DFPK0w38om9GO... |
More information about the performance of your application. These numbers don't directly affect the Performance score.
These checks highlight opportunities to improve the accessibility of your web app. Automatic detection can only detect a subset of issues and does not guarantee the accessibility of your web app, so manual testing is also encouraged.
Low-contrast text is difficult or impossible for many users to read. Learn how to provide sufficient color contrast.
Performance issues directly impact user engagement and conversion rates.
| Failing Elements |
|---|
SIGN IN div.header--content > div.header--buttons > a.sign-in > span |
Create a unique and beautiful blog easily. main#maincontent > section.section > header.hero--header > p |
CREATE YOUR BLOG main#maincontent > section.section > header.hero--header > a.cta |
Choose the perfect design section#choose-design > header > div > h2 |
Create a beautiful blog that fits your style. Choose from a selection of easy-t… section#choose-design > header > div > p |
Get paid for your hard work. Google AdSense can automatically display relevant … section.section > header > div > p |
Whether sharing your expertise, breaking news, or whatever’s on your mind, you’… main#maincontent > section.section > header.millions--header > p |
These are opportunities to improve the legibility of your content.
Touch targets with sufficient size and spacing help users who may have difficulty targeting small controls to activate the targets. Learn more about touch targets.
Performance issues directly impact user engagement and conversion rates.
| Failing Elements |
|---|
Help Center section > ul > li > a.ga-footer |
Help Forum section > ul > li > a.ga-footer |
These items highlight common accessibility best practices.
These checks ensure that your page is following basic search engine optimization advice. There are many additional factors Lighthouse does not score here that may affect your search ranking, including performance on Core Web Vitals. Learn more about Google Search Essentials.
Industry-standard audits powered by Google Lighthouse. — Desktop
Key metrics that affect user experience. — Desktop
First Contentful Paint First Contentful Paint — how long until the browser renders the first piece of content. Under 1.8s is good.
1.29 s
Largest Contentful Paint Largest Contentful Paint — how long until the largest visible element loads. Under 2.5s is good.
2.42 s
Total Blocking Time Total Blocking Time — total time the main thread was blocked, preventing user input. Under 200ms is good.
0 ms
Cumulative Layout Shift Cumulative Layout Shift — measures visual stability. How much the page layout shifts during loading. Under 0.1 is good.
0.000
Speed Index Speed Index — how quickly content is visually displayed during load. Under 3.4s is good.
1.29 s
Time to Interactive Time to Interactive — how long until the page is fully interactive and responds to user input. Under 3.8s is good.
2.42 s
Audit breakdown by category with detailed findings.
Remove large, duplicate JavaScript modules from bundles to reduce unnecessary bytes consumed by network activity.
Performance issues directly impact user engagement and conversion rates.
Polyfills and transforms enable older browsers to use new JavaScript features. However, many aren't necessary for modern browsers. Consider modifying your JavaScript build process to not transpile Baseline features, unless you know you must support older browsers. Learn why most sites can deploy ES6+ code without transpiling
Shipping ES5 transpiled code to modern browsers wastes bytes — every user with an evergreen browser pays for compatibility you don't need.
Most users today run browsers that natively support ES6+, async/await, optional chaining, and the rest of modern JavaScript. Transpiling to ES5 'just in case' adds 20-40% to your bundle for no benefit. Configure your build to target a modern browserslist, or ship a differential bundle pair (modern + legacy) with the module/nomodule pattern.
Source: Google web.dev / Lighthouse
3rd party code can significantly impact load performance. Reduce and defer loading of 3rd party code to prioritize your page's content.
Performance issues directly impact user engagement and conversion rates.
A long cache lifetime can speed up repeat visits to your page. Learn more about caching.
Performance issues directly impact user engagement and conversion rates.
Your first network request is the most important. Reduce its latency by avoiding redirects, ensuring a fast server response, and enabling text compression.
Performance issues directly impact user engagement and conversion rates.
Reducing the download time of images can improve the perceived load time of the page and LCP. Learn more about optimizing image size
Performance issues directly impact user engagement and conversion rates.
| URL | Resource Size | Est Savings | |
|---|---|---|---|
Preview template main#maincontent > section#choose-design > div.background > img.background--layer | /img/b/U2hvZWJveA/AVvXsEgUBB5DXNlnFzdymjib0jVusprDx6SfFiw... | 205.5 KiB | 131.5 KiB |
Preview template main#maincontent > section#choose-design > div.background > img.background--layer | /img/b/U2hvZWJveA/AVvXsEjon2O8dgvD23b6Gpf7w_9s-wlenp6JBJR... | 159.1 KiB | 90.2 KiB |
Action Cam section.section > div.hero--background > div.theme > img.theme--layer | /img/b/U2hvZWJveA/AVvXsEgv8iuqPf2uJ3ZR-r-GK2Zrk5SEZuaQkuK... | 74.7 KiB | 62.2 KiB |
Vase section.section > div.hero--background > div.theme > img.theme--layer | /img/b/U2hvZWJveA/AVvXsEgbcmMEiMqeCCInT4nGykybsk0OTzbH11e... | 76.5 KiB | 60.0 KiB |
Drone section.section > div.hero--background > div.theme > img.theme--layer | /img/b/U2hvZWJveA/AVvXsEiIqvu5M95FBdFKO_hqlNOOqYxf3Famh9p... | 76.6 KiB | 59.4 KiB |
Family Blog section.section > div.hero--background > div.theme > img.theme--layer | /img/b/U2hvZWJveA/AVvXsEjpu5-8AfV3m50TWEhjKcmn67d9jZUuFpw... | 101.5 KiB | 54.2 KiB |
Play Icon main#maincontent > section.section > div.background > img.background--layer | /img/b/U2hvZWJveA/AVvXsEifcKcuZTmiN1y1IYI8xRPNgYrkn-jlttJ... | 58.8 KiB | 47.8 KiB |
Tech Blog section.section > div.hero--background > div.theme > img.theme--layer | /img/b/U2hvZWJveA/AVvXsEgHt9KECuCs7ZHjOggd1bJOdZqQt534a-w... | 89.6 KiB | 45.5 KiB |
Family Photo main#maincontent > section.section > div.background > img.background--layer | /img/b/U2hvZWJveA/AVvXsEgXsIMRUWZAjqTgybLi1m2hfUgOVwkJk2B... | 56.1 KiB | 42.3 KiB |
Calculator main#maincontent > section.section > div.background > img.background--layer | /img/b/U2hvZWJveA/AVvXsEiKcvu9hJsHC-b_QpHjXykOYrSZL4Ro2FC... | 35.6 KiB | 24.0 KiB |
Slipper section.section > div.hero--background > div.theme > img.theme--layer | /img/b/U2hvZWJveA/AVvXsEhugZ62oJjNWQyfOoTcBbyAGObqD3ZpJYJ... | 33.7 KiB | 23.6 KiB |
Tools main#maincontent > section#choose-design > div.background > img.background--layer | /img/b/U2hvZWJveA/AVvXsEhnuGlBA9tyNRHqAquiFF2wDdz3bCI9KAW... | 37.1 KiB | 21.4 KiB |
Device main#maincontent > section.section > div.background > img.background--layer | /img/b/U2hvZWJveA/AVvXsEiRP6C_AlI6Qfp9GpD_YDBfOfbTm8EbtV0... | 37.6 KiB | 19.9 KiB |
Documents main#maincontent > section.section > div.background > img.background--layer | /img/b/U2hvZWJveA/AVvXsEgeMav77-TZdE7D7PI0GPbe5vKx4OdM4HY... | 29.1 KiB | 17.7 KiB |
Info map section.section > div.background > div > img.background--layer | /img/b/U2hvZWJveA/AVvXsEhy9r8vyLfwnrBV2wBe_8yh4eCCMJtO8VN... | 31.1 KiB | 14.3 KiB |
Graphs section.section > div.background > div > img.background--layer | /img/b/U2hvZWJveA/AVvXsEjDW914EBAPitHRrvw_x8DFPK0w38om9GO... | 28.6 KiB | 7.4 KiB |
Card main#maincontent > section.section > div.background > img.background--layer | /img/b/U2hvZWJveA/AVvXsEilwNFgoyAWdAKjuUHNQS8EXeUzCLqmgH2... | 15.1 KiB | 4.5 KiB |
Optimize LCP by making the LCP image discoverable from the HTML immediately, and avoiding lazy-loading
Performance issues directly impact user engagement and conversion rates.
Avoid chaining critical requests by reducing the length of chains, reducing the download size of resources, or deferring the download of unnecessary resources to improve page load.
Performance issues directly impact user engagement and conversion rates.
Requests are blocking the page's initial render, which may delay LCP. Deferring or inlining can move these network requests out of the critical path.
Performance issues directly impact user engagement and conversion rates.
| URL | Transfer Size | Duration |
|---|---|---|
| ajax.googleapis.com/ajax/libs/webfont/1.5.10/webfont.js | 7.3 KiB | 251 ms |
| /css?family=Roboto+Slab:400,700,300|Roboto:400,500,700,30... | 2.5 KiB | 289 ms |
| www.blogger.com/about/css/styles.min.css?v=1476060772 | 6.4 KiB | 69 ms |
Consider setting font-display to swap or optional to ensure text is consistently visible. swap can be further optimized to mitigate layout shifts with font metric overrides.
Performance issues directly impact user engagement and conversion rates.
| URL | Est Savings |
|---|---|
| fonts.gstatic.com/s/roboto/v51/KFO7CnqEu92Fr1ME7kSn66aGLdTylUAMa3yUBHMdazQ.woff2 | 5.0 ms |
These insights are also available in the Chrome DevTools Performance Panel - record a trace to view more detailed information.
Set an explicit width and height on image elements to reduce layout shifts and improve CLS. Learn how to set image dimensions
Performance issues directly impact user engagement and conversion rates.
| URL | |
|---|---|
Device main#maincontent > section.section > div.background > img.background--layer | /img/b/U2hvZWJveA/AVvXsEiRP6C_AlI6Qfp9GpD_YDBfOfbTm8EbtV0... |
Info map section.section > div.background > div > img.background--layer | /img/b/U2hvZWJveA/AVvXsEhy9r8vyLfwnrBV2wBe_8yh4eCCMJtO8VN... |
Graphs section.section > div.background > div > img.background--layer | /img/b/U2hvZWJveA/AVvXsEjDW914EBAPitHRrvw_x8DFPK0w38om9GO... |
Histogram section.section > div.background > div > img.background--layer | /img/b/U2hvZWJveA/AVvXsEilJRojQUoBApWmgFSKMk0FVvIQIuijBNV... |
Chart section.section > div.background > div > img.background--layer | /img/b/U2hvZWJveA/AVvXsEhgXRIVYGid-p5Uj0rjUNvSL61D6UgQLUw... |
More information about the performance of your application. These numbers don't directly affect the Performance score.
Redirects introduce additional delays before the page can be loaded. Learn how to avoid page redirects.
Performance issues directly impact user engagement and conversion rates.
| URL | Time Spent |
|---|---|
| blogger.com/ | 202 ms |
| www.blogger.com/ | 230 ms |
| /ServiceLogin?passive=true&go=true&service=blogger&contin... | 246 ms |
| www.blogger.com/?bpli=1 | 0.0 ms |
| www.blogger.com/about?bpli=1 | 0.0 ms |
| www.blogger.com/about/?bpli=1 | 0.0 ms |
These checks highlight opportunities to improve the accessibility of your web app. Automatic detection can only detect a subset of issues and does not guarantee the accessibility of your web app, so manual testing is also encouraged.
Low-contrast text is difficult or impossible for many users to read. Learn how to provide sufficient color contrast.
Performance issues directly impact user engagement and conversion rates.
| Failing Elements |
|---|
SIGN IN div.header--content > div.header--buttons > a.sign-in > span |
Create a unique and beautiful blog easily. main#maincontent > section.section > header.hero--header > p |
CREATE YOUR BLOG main#maincontent > section.section > header.hero--header > a.cta |
Choose the perfect design section#choose-design > header > div > h2 |
Create a beautiful blog that fits your style. Choose from a selection of easy-t… section#choose-design > header > div > p |
Get paid for your hard work. Google AdSense can automatically display relevant … section.section > header > div > p |
These are opportunities to improve the legibility of your content.
These checks ensure that your page is following basic search engine optimization advice. There are many additional factors Lighthouse does not score here that may affect your search ranking, including performance on Core Web Vitals. Learn more about Google Search Essentials.
Send Feedback