Global Performance
6/6 locations ✓High global latency — average 909ms across 6 locations, fastest from Amsterdam (397ms), slowest from Sao Paulo (1504ms). No CDN detected. Cache-Control header is missing. 4 locations above the 500ms target.
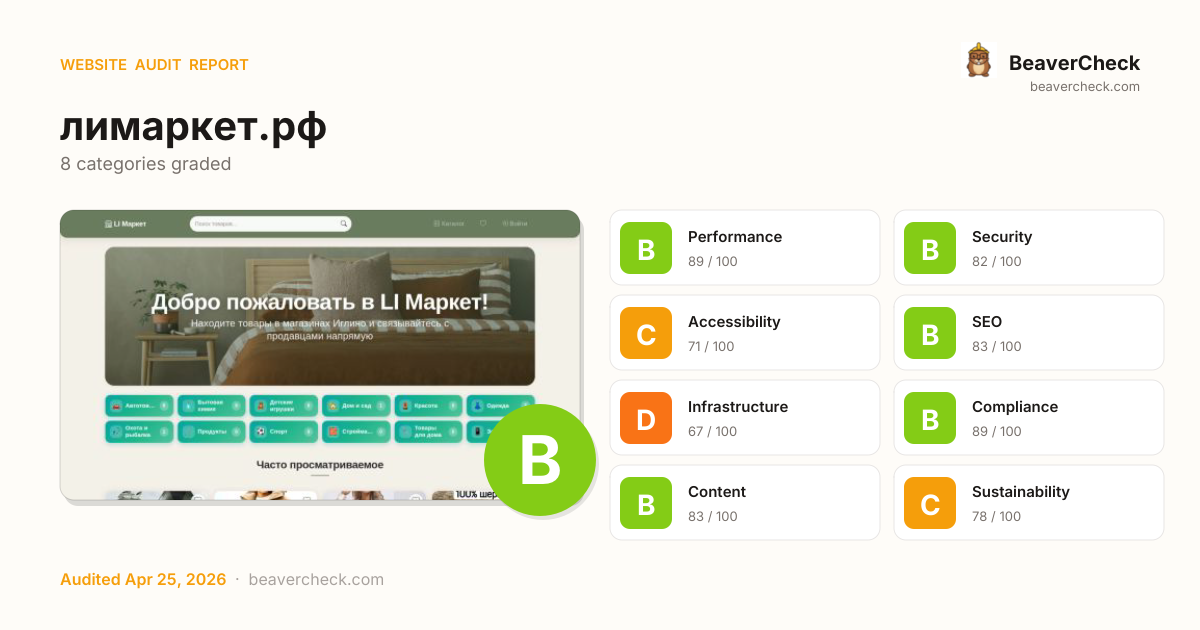
Audit overview
Infrastructure needs attention; the rest of the categories are in good shape.
Fix Priority Matrix
5 findingsQuick Wins
1High impact, low effort — start here.
Strategic
4High impact, requires investment.
Easy Improvements
0Small gains, minimal effort.
Nothing in this quadrant — good news.
Deprioritize
0Low impact, high effort — do last.
Nothing in this quadrant — good news.
Screenshots


Top Priorities (5)
'unsafe-inline' found in script source
Unsafe value (unsafe-inline, unsafe-eval) in script-src defeats CSP's main protection — XSS injections can execute again.
6 button(s) with no accessible text
Buttons with no accessible text (icon-only, no aria-label) can't be activated by voice control or understood by screen readers.
Cross-Origin-Embedder-Policy header is missing
COEP enforces that all embedded resources opt-in to cross-origin embedding — required for cross-origin isolation features.
Images are 1.2 MB — compress or use modern formats
Image bandwidth is high — modern formats (WebP/AVIF) and resizing typically cut it 50%+.
No DMARC record found
Without DMARC, anyone can send phishing emails using your domain name.
Business case
What fixing the audit's findings is worth -- and what ignoring them keeps costing.
Return on investment
€850 investment → €7,862/month returns + EUR 500,000 risk avoided
Figures combine localized regulatory fine ceilings, search/conversion value priced against local CPC, and bandwidth waste estimates. Results depend on implementation quality and audience composition. Not legal or financial advice.
Conversion barriers
5 barrier(s) likely increasing bounce by ~23%.
- Page takes 5.5s to loadUsers abandon at ~3s — you're 3.0s over the 2.5s threshold→ Optimize render-blocking resources, preload the hero image, and compress images
- No Content-Security-Policy headerHigher XSS blast radius — one compromised script can exfiltrate the checkout form→ Ship a reporting-only CSP first, then enforce once violations are clean
- No structured dataNo rich-result eligibility in Google — lower SERP CTR vs competitors with stars and prices→ Add JSON-LD for your page type (Product, Article, FAQPage, LocalBusiness, …)
- Thin contentUnder 300 words — visitors bounce looking for substance, search engines rank competitors first→ Add a substantive FAQ, product detail, or case-study section
- No skip-to-content linkKeyboard and screen-reader users must tab through the entire header on every page→ Add a visible-on-focus <a href="#main">Skip to content</a> as the first focusable element
Preliminary CRO audit — each barrier links to the tab with detailed analysis.
Remediation cost
Start here for the best return on investment
Cost by category
Cost by effort level
Adjust assumptions
Team composition
Multiplier applied to dev hours to reflect QA, design, and PM overhead. Use Dev only for solo work; Full team for projects with formal review processes.
Rates reflect fully-loaded developer cost including overhead
Warning:Cost of inaction
Compliance Risk
€500.000
- 1 of 2 <nav> elements are unlabeledEAA: EUR 1.000 – EUR 500.000
- Skip navigation link is missing (WCAG 2.4.1)EAA: EUR 1.000 – EUR 500.000
- Heading level skipped: H2 → H6 (missing H3)EAA: EUR 1.000 – EUR 500.000
Bounce-Rate Cost
€5.161 /mo
+23.5pp bounce · ~2,346 lost visitors/mo
CPC: EUR 2.20
Bandwidth Waste
€0,41 /mo
5596.3 MB/mo × 0.074 EUR/GB
- Optimize transfer: save ~560 KB per page loadSaves €0,41/mo
Compliance figures represent the statutory maximum fine for the most severe triggered category, capped per regulation — not the sum of per-finding penalties. Based on published regulatory fine ranges. This is not legal advice.
Unique monthly visitors from your analytics
Purchases, signups, or key actions
Optional — for revenue estimation
more engaged visitors from reduced bounce
Fix 2 critical issues to capture this value
How this is calculated
Based on Google/Deloitte research ("Milliseconds Make Millions") showing a ~7% bounce rate increase per additional second of LCP above the 2.5s "Good" threshold.
Your site's LCP: → estimated after fixes.
These are estimates based on industry research — actual results vary
Your data stays in your browser — nothing is sent to our servers
Lighthouse
Mobile
First Contentful Paint First Contentful Paint — how long until the browser renders the first piece of content. Under 1.8s is good.
3.45 s
Largest Contentful Paint Largest Contentful Paint — how long until the largest visible element loads. Under 2.5s is good.
5.48 s
Total Blocking Time Total Blocking Time — total time the main thread was blocked, preventing user input. Under 200ms is good.
0 ms
Cumulative Layout Shift Cumulative Layout Shift — measures visual stability. How much the page layout shifts during loading. Under 0.1 is good.
0.000
Speed Index Speed Index — how quickly content is visually displayed during load. Under 3.4s is good.
4.68 s
Time to Interactive Time to Interactive — how long until the page is fully interactive and responds to user input. Under 3.8s is good.
5.49 s
Desktop
First Contentful Paint First Contentful Paint — how long until the browser renders the first piece of content. Under 1.8s is good.
726 ms
Largest Contentful Paint Largest Contentful Paint — how long until the largest visible element loads. Under 2.5s is good.
1.05 s
Total Blocking Time Total Blocking Time — total time the main thread was blocked, preventing user input. Under 200ms is good.
0 ms
Cumulative Layout Shift Cumulative Layout Shift — measures visual stability. How much the page layout shifts during loading. Under 0.1 is good.
0.000
Speed Index Speed Index — how quickly content is visually displayed during load. Under 3.4s is good.
1.85 s
Time to Interactive Time to Interactive — how long until the page is fully interactive and responds to user input. Under 3.8s is good.
1.05 s
Categories
8Performance
Images are 1.2 MB — compress or use modern formats
Security
'unsafe-inline' found in script source
Accessibility
6 button(s) with no accessible text
SEO
All checks pass
Infrastructure
All checks pass
Compliance
All checks pass
Content
All checks pass
Sustainability
All checks pass
How you compare
Where this site stands against peers running the same stack.
Top 10% of Bootstrap sites score 95+ on Infrastructure; you're at 67 — closing this gap is the highest-leverage improvement.
Technology stack
Bootstrap 5.3.0, with Nginx CDN
Stack Architecture
 Webpack
  Bootstrap 5.3.0
 Bootstrap Icons HSTS
  Open Graph
  PWA
PWA  Tailwind CSS
  Ubuntu
  Nginx 1.24.0
All Detected Technologies (9)
Nginx is a web server that can also be used as a reverse proxy, load balancer, mail proxy and HTTP cache.
Bootstrap is a free and open-source CSS framework directed at responsive, mobile-first front-end web development. It contains CSS and JavaScript-based design templates for typography, forms, buttons, navigation, and other interface components.
Bootstrap Icons is a growing library of SVG icons that are designed by @mdo and maintained by the Bootstrap Team.
HTTP Strict Transport Security (HSTS) informs browsers that the site should only be accessed using HTTPS.
Open Graph is a protocol that is used to integrate any web page into the social graph.
Progressive Web Apps (PWAs) are web apps built and enhanced with modern APIs to deliver enhanced capabilities, reliability, and installability while reaching anyone, anywhere, on any device, all with a single codebase.
Ubuntu is a free and open-source operating system on Linux for the enterprise server, desktop, cloud, and IoT.
Observations (1)
Complex technology stack detected
9 technologies identified. A complex stack increases maintenance burden and attack surface. Consider whether all components are actively needed.
Show your score
Drop this badge on your README, marketing site, or status page. It auto-updates every time the audit re-runs and links back to this report.
This badge auto-updates with your latest scan result.
[](https://beavercheck.com/results/36744aa0-4be8-4eb4-95f8-c8df29c9ffe7)<a href="https://beavercheck.com/results/36744aa0-4be8-4eb4-95f8-c8df29c9ffe7"><img src="https://beavercheck.com/badge?url=https%3A%2F%2F%D0%BB%D0%B8%D0%BC%D0%B0%D1%80%D0%BA%D0%B5%D1%82.%D1%80%D1%84" alt="BeaverCheck Score"></a>https://beavercheck.com/badge?url=https%3A%2F%2F%D0%BB%D0%B8%D0%BC%D0%B0%D1%80%D0%BA%D0%B5%D1%82.%D1%80%D1%84Export & share
Download the audit, share with your team, or grab a fix plan ready to copy into your tracker.
Copies markdown to clipboard
Fix Plan
Three-week roadmap to ship the audit's findings, with one-click copy targets for your tracker.
Three-week fix plan
3 sprints · 10h total → projected B (87)
Sprint 1: Quick Wins
+2Highest ROI — low effort, high impact
- · 6 button(s) with no accessible text
Sprint 2: Core Fixes
+3Medium effort, high structural impact
- · Cross-Origin-Embedder-Policy header is missing
- · No DMARC record found
- · Images are 1.2 MB — compress or use modern formats
Sprint 3: Strategic Improvements
+1Higher effort, long-term payoff
- · 'unsafe-inline' found in script source