Spain · Madrid Completed: Apr 7, 2026 20:14 UTC
Mobile 375 × 812

Desktop 1440 × 900

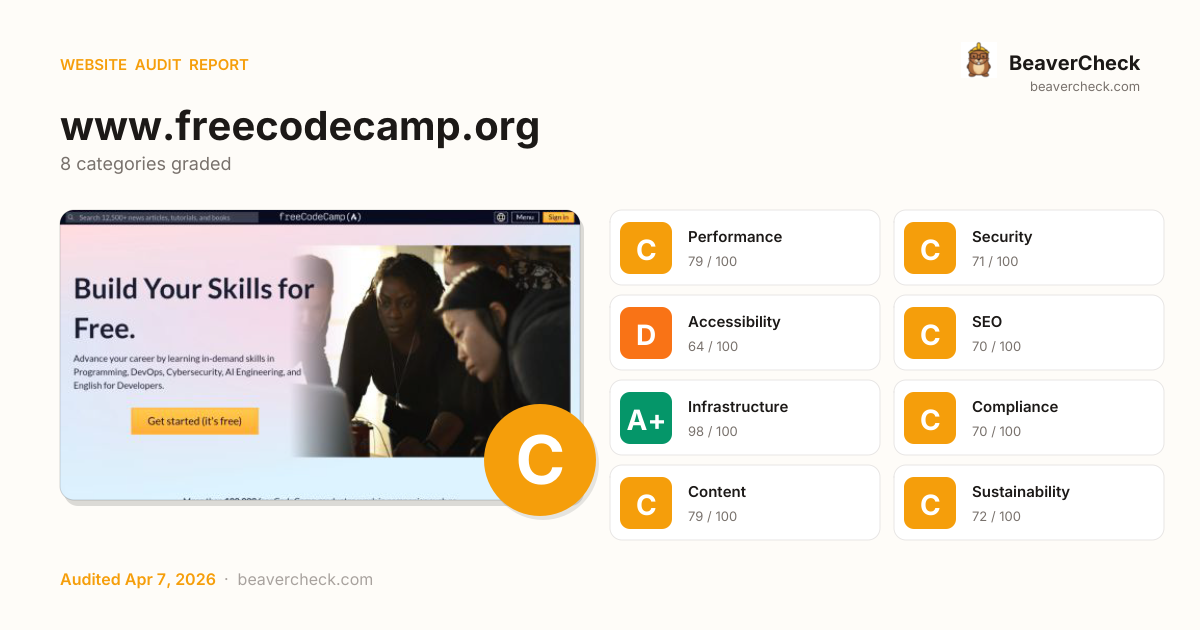
Score: 75 / 100
Based on 8 categories, 0 sections
The overall score is a weighted average of individual category scores. Categories with more impact on user experience and security carry more weight.
Weights reflect general web best practices. Individual needs may differ.
'unsafe-eval' found in script source
'unsafe-inline' found in script source
No <main> landmark found
Cross-Origin-Embedder-Policy header is missing
Cross-Origin-Opener-Policy header is missing
[](https://beavercheck.com/results/38f48373-ee21-a01f-89bd-6e55979ab0b0)<a href="https://beavercheck.com/results/38f48373-ee21-a01f-89bd-6e55979ab0b0"><img src="https://beavercheck.com/badge?url=https%3A%2F%2Fwww.freecodecamp.org" alt="BeaverCheck Score"></a>https://beavercheck.com/badge?url=https%3A%2F%2Fwww.freecodecamp.orgThis badge auto-updates with your latest scan result.
Thanks for your feedback!
Industry-standard audits powered by Google Lighthouse.
Key metrics that affect user experience.
First Contentful Paint First Contentful Paint — how long until the browser renders the first piece of content. Under 1.8s is good.
3.94 s
Largest Contentful Paint Largest Contentful Paint — how long until the largest visible element loads. Under 2.5s is good.
13.24 s
Total Blocking Time Total Blocking Time — total time the main thread was blocked, preventing user input. Under 200ms is good.
1.21 s
Cumulative Layout Shift Cumulative Layout Shift — measures visual stability. How much the page layout shifts during loading. Under 0.1 is good.
0.000
Speed Index Speed Index — how quickly content is visually displayed during load. Under 3.4s is good.
5.09 s
Time to Interactive Time to Interactive — how long until the page is fully interactive and responds to user input. Under 3.8s is good.
17.75 s
Audit breakdown by category with detailed findings.
Remove large, duplicate JavaScript modules from bundles to reduce unnecessary bytes consumed by network activity.
Polyfills and transforms enable older browsers to use new JavaScript features. However, many aren't necessary for modern browsers. Consider modifying your JavaScript build process to not transpile Baseline features, unless you know you must support older browsers. Learn why most sites can deploy ES6+ code without transpiling
3rd party code can significantly impact load performance. Reduce and defer loading of 3rd party code to prioritize your page's content.
A long cache lifetime can speed up repeat visits to your page. Learn more about caching.
Consider setting font-display to swap or optional to ensure text is consistently visible. swap can be further optimized to mitigate layout shifts with font metric overrides.
Avoid chaining critical requests by reducing the length of chains, reducing the download size of resources, or deferring the download of unnecessary resources to improve page load.
Reducing the download time of images can improve the perceived load time of the page and LCP. Learn more about optimizing image size
| URL | Resource Size | Est Savings | |
|---|---|---|---|
Sarah Chima, a young-looking Black woman, smiling for the camera while sitting … div.testimonials-row > div.testimonial-card > div.testimonial-card-header > img.testimonial-image | www.freecodecamp.org/static/Sarah-04dee53ff6709a3b1c0bbe0023554a46.png | 44.5 KiB | 24.6 KiB |
Shawn Wang, a young-looking Asian man, smiling for a selfie with a snow-capped … div.testimonials-row > div.testimonial-card > div.testimonial-card-header > img.testimonial-image | www.freecodecamp.org/static/Shawn-75f7dad2bfcbae1988440b303b5a465b.png | 44.1 KiB | 24.2 KiB |
These insights are also available in the Chrome DevTools Performance Panel - record a trace to view more detailed information.
Time to Interactive is the amount of time it takes for the page to become fully interactive. Learn more about the Time to Interactive metric.
The maximum potential First Input Delay that your users could experience is the duration of the longest task. Learn more about the Maximum Potential First Input Delay metric.
Reduce unused JavaScript and defer loading scripts until they are required to decrease bytes consumed by network activity. Learn how to reduce unused JavaScript.
| URL | Transfer Size | Est Savings |
|---|---|---|
| /c8f7fe3b0e41be846d5687592cf2018ff6e22687-40d71bcd1644bb1... | 725.4 KiB | 725.0 KiB |
| www.freecodecamp.org/app-f5209401474dfc55e08f.js | 466.7 KiB | 142.0 KiB |
| js.stripe.com/v3 | 219.5 KiB | 141.3 KiB |
| www.freecodecamp.org/7e3b4c62-ba61f723d90acd3f2bee.js | 130.9 KiB | 78.5 KiB |
| www.googletagmanager.com/gtag/js?id=G-SF1BGBDCNS&cx=c>m=4e6460 | 154.7 KiB | 64.7 KiB |
| /gtm.js?id=GTM-57R6KJM>m_auth=>m_preview=>m_cookies... | 122.2 KiB | 62.4 KiB |
| www.freecodecamp.org/component---src-pages-index-tsx-593d70c38cd28a78f7ef.js | 39.6 KiB | 21.1 KiB |
Consider reducing the time spent parsing, compiling, and executing JS. You may find delivering smaller JS payloads helps with this. Learn how to reduce Javascript execution time.
| URL | Total CPU Time | Script Evaluation | Script Parse |
|---|---|---|---|
| www.freecodecamp.org/app-f5209401474dfc55e08f.js | 1.5 s | 1.2 s | 189 ms |
| www.freecodecamp.org/ | 564 ms | 22 ms | 2.7 ms |
| Unattributable | 378 ms | 13 ms | 0.0 ms |
| /c8f7fe3b0e41be846d5687592cf2018ff6e22687-40d71bcd1644bb1... | 360 ms | 8.0 ms | 351 ms |
| js.stripe.com/v3 | 322 ms | 236 ms | 80 ms |
| www.googletagmanager.com/gtag/js?id=G-SF1BGBDCNS&cx=c>m=4e6460 | 273 ms | 222 ms | 38 ms |
| /gtm.js?id=GTM-57R6KJM>m_auth=>m_preview=>m_cookies... | 163 ms | 122 ms | 39 ms |
| www.freecodecamp.org/7e3b4c62-ba61f723d90acd3f2bee.js | 54 ms | 1.7 ms | 48 ms |
Consider reducing the time spent parsing, compiling and executing JS. You may find delivering smaller JS payloads helps with this. Learn how to minimize main-thread work
| Category | Time Spent |
|---|---|
| Script Evaluation | 1.9 s |
| Script Parsing & Compilation | 768 ms |
| Other | 552 ms |
| Style & Layout | 221 ms |
| Garbage Collection | 96 ms |
| Rendering | 88 ms |
| Parse HTML & CSS | 83 ms |
Reduce unused rules from stylesheets and defer CSS not used for above-the-fold content to decrease bytes consumed by network activity. Learn how to reduce unused CSS.
| URL | Transfer Size | Est Savings |
|---|---|---|
| .ais-Breadcrumb-list,.ais-CurrentRefinements-list,.ais-Hi... | 70.6 KiB | 66.9 KiB |
Large network payloads cost users real money and are highly correlated with long load times. Learn how to reduce payload sizes.
More information about the performance of your application. These numbers don't directly affect the Performance score.
These checks highlight opportunities to improve the accessibility of your web app. Automatic detection can only detect a subset of issues and does not guarantee the accessibility of your web app, so manual testing is also encouraged.
Link text (and alternate text for images, when used as links) that is discernible, unique, and focusable improves the navigation experience for screen reader users. Learn how to make links accessible.
| Failing Elements |
|---|
header.site-header > nav#universal-nav > div.universal-nav-right > a.signup-btn header.site-header > nav#universal-nav > div.universal-nav-right > a.signup-btn |
These are opportunities to improve the semantics of the controls in your application. This may enhance the experience for users of assistive technology, like a screen reader.
These checks ensure that your page is following basic search engine optimization advice. There are many additional factors Lighthouse does not score here that may affect your search ranking, including performance on Core Web Vitals. Learn more about Google Search Essentials.
Industry-standard audits powered by Google Lighthouse. — Desktop
Key metrics that affect user experience. — Desktop
First Contentful Paint First Contentful Paint — how long until the browser renders the first piece of content. Under 1.8s is good.
953 ms
Largest Contentful Paint Largest Contentful Paint — how long until the largest visible element loads. Under 2.5s is good.
3.61 s
Total Blocking Time Total Blocking Time — total time the main thread was blocked, preventing user input. Under 200ms is good.
148 ms
Cumulative Layout Shift Cumulative Layout Shift — measures visual stability. How much the page layout shifts during loading. Under 0.1 is good.
0.000
Speed Index Speed Index — how quickly content is visually displayed during load. Under 3.4s is good.
1.84 s
Time to Interactive Time to Interactive — how long until the page is fully interactive and responds to user input. Under 3.8s is good.
4.00 s
Audit breakdown by category with detailed findings.
Remove large, duplicate JavaScript modules from bundles to reduce unnecessary bytes consumed by network activity.
Polyfills and transforms enable older browsers to use new JavaScript features. However, many aren't necessary for modern browsers. Consider modifying your JavaScript build process to not transpile Baseline features, unless you know you must support older browsers. Learn why most sites can deploy ES6+ code without transpiling
3rd party code can significantly impact load performance. Reduce and defer loading of 3rd party code to prioritize your page's content.
A long cache lifetime can speed up repeat visits to your page. Learn more about caching.
Consider setting font-display to swap or optional to ensure text is consistently visible. swap can be further optimized to mitigate layout shifts with font metric overrides.
| URL | Est Savings |
|---|---|
| www.freecodecamp.org/static/Lato-Regular-77ca2742388f408c3be7d0ec3e7dc392.woff | 60 ms |
A forced reflow occurs when JavaScript queries geometric properties (such as offsetWidth) after styles have been invalidated by a change to the DOM state. This can result in poor performance. Learn more about forced reflows and possible mitigations.
Avoid chaining critical requests by reducing the length of chains, reducing the download size of resources, or deferring the download of unnecessary resources to improve page load.
Reducing the download time of images can improve the perceived load time of the page and LCP. Learn more about optimizing image size
| URL | Resource Size | Est Savings | |
|---|---|---|---|
A group of people, including a White man, a Black woman, and an Asian woman, ga… div.mx-[-15px] > div.landing-top-right > figure > img.img-loaded | www.freecodecamp.org/static/wide-image-becdb4c281c527b989315b2f7ce20378.png | 100.3 KiB | 46.2 KiB |
Emma Bostian, a young-looking White woman, smiling for the camera in front of g… div.testimonials-row > div.testimonial-card > div.testimonial-card-header > img.testimonial-image | www.freecodecamp.org/static/Emma-1384890b0c332b769f67e8c14b628e13.png | 57.2 KiB | 40.6 KiB |
Sarah Chima, a young-looking Black woman, smiling for the camera while sitting … div.testimonials-row > div.testimonial-card > div.testimonial-card-header > img.testimonial-image | www.freecodecamp.org/static/Sarah-04dee53ff6709a3b1c0bbe0023554a46.png | 44.5 KiB | 27.9 KiB |
Shawn Wang, a young-looking Asian man, smiling for a selfie with a snow-capped … div.testimonials-row > div.testimonial-card > div.testimonial-card-header > img.testimonial-image | www.freecodecamp.org/static/Shawn-75f7dad2bfcbae1988440b303b5a465b.png | 44.1 KiB | 27.4 KiB |
These insights are also available in the Chrome DevTools Performance Panel - record a trace to view more detailed information.
Time to Interactive is the amount of time it takes for the page to become fully interactive. Learn more about the Time to Interactive metric.
Reduce unused JavaScript and defer loading scripts until they are required to decrease bytes consumed by network activity. Learn how to reduce unused JavaScript.
| URL | Transfer Size | Est Savings |
|---|---|---|
| /c8f7fe3b0e41be846d5687592cf2018ff6e22687-40d71bcd1644bb1... | 725.4 KiB | 725.0 KiB |
| js.stripe.com/v3 | 224.1 KiB | 145.8 KiB |
| www.freecodecamp.org/app-f5209401474dfc55e08f.js | 466.7 KiB | 142.1 KiB |
| www.freecodecamp.org/7e3b4c62-ba61f723d90acd3f2bee.js | 130.9 KiB | 78.5 KiB |
| www.googletagmanager.com/gtag/js?id=G-SF1BGBDCNS&cx=c>m=4e6460 | 154.7 KiB | 64.8 KiB |
| /gtm.js?id=GTM-57R6KJM>m_auth=>m_preview=>m_cookies... | 122.2 KiB | 62.4 KiB |
| www.freecodecamp.org/component---src-pages-index-tsx-593d70c38cd28a78f7ef.js | 39.6 KiB | 21.1 KiB |
Reduce unused rules from stylesheets and defer CSS not used for above-the-fold content to decrease bytes consumed by network activity. Learn how to reduce unused CSS.
| URL | Transfer Size | Est Savings |
|---|---|---|
| .ais-Breadcrumb-list,.ais-CurrentRefinements-list,.ais-Hi... | 70.8 KiB | 65.9 KiB |
Large network payloads cost users real money and are highly correlated with long load times. Learn how to reduce payload sizes.
More information about the performance of your application. These numbers don't directly affect the Performance score.
These checks highlight opportunities to improve the accessibility of your web app. Automatic detection can only detect a subset of issues and does not guarantee the accessibility of your web app, so manual testing is also encouraged.
Image display dimensions should match natural aspect ratio. Learn more about image aspect ratio.
| URL | Aspect Ratio (Displayed) | Aspect Ratio (Actual) | |
|---|---|---|---|
A group of people, including a White man, a Black woman, and an Asian woman, ga… div.mx-[-15px] > div.landing-top-right > figure > img.img-loaded | www.freecodecamp.org/static/wide-image-becdb4c281c527b989315b2f7ce20378.png | 850 x 550 (1.55) | 750 x 443 (1.69) |
These checks ensure that your page is following basic search engine optimization advice. There are many additional factors Lighthouse does not score here that may affect your search ranking, including performance on Core Web Vitals. Learn more about Google Search Essentials.
Send Feedback