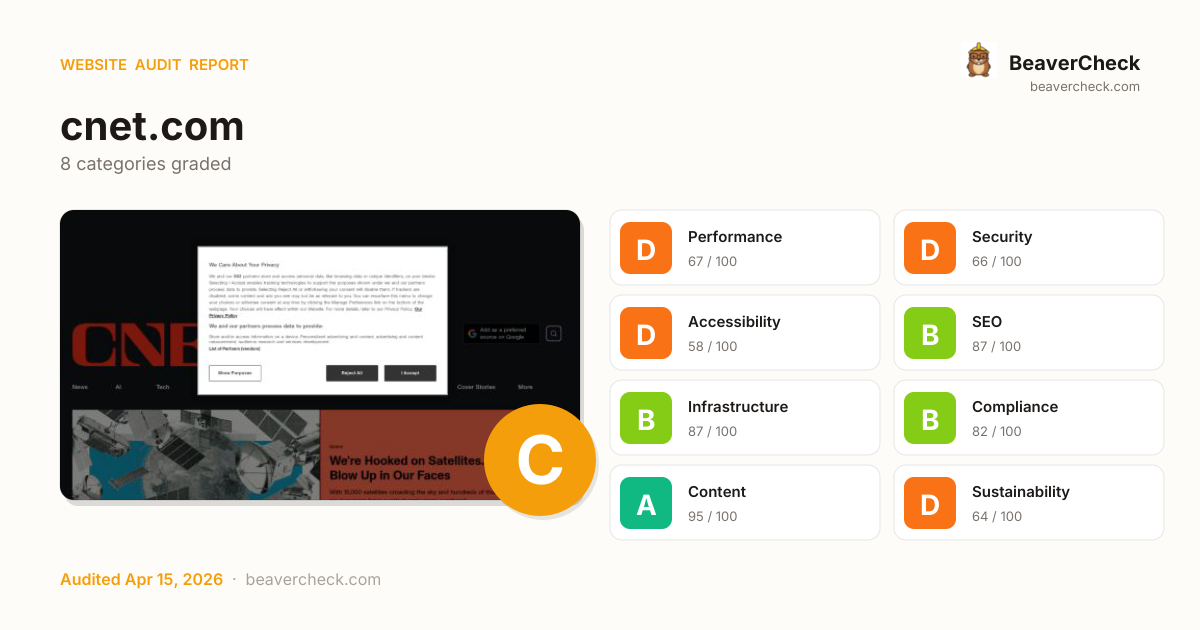
Skip to content
Audit Complete

Results for https://cnet.com

Visit site
Corporate / Enterprise · estimated Tracking: leads
Spain Spain · Madrid Completed: Apr 15, 2026 23:24 UTC
Download JSON Download Markdown Report

Mobile 375 × 812

Screenshot of the audited page (Mobile 375×812)

Desktop 1440 × 900

Screenshot of the audited page (Desktop 1440×900)
C72

Site Health

Score: 72 / 100

Based on 8 categories, 0 sections

Room to improve — your 14.8s load time is above Google's 2.5s 'Good' threshold.

Several missing protections leave your users and data exposed.

Several issues make your site difficult for assistive technology users.

Well-optimized for search — your content is discoverable.

Solid infrastructure — fast server responses across the board.

Mostly compliant — a few items need attention.

Rich content metadata — your pages look great everywhere.

Heavier than average — reducing page weight saves energy and bandwidth.

How is this calculated?

The overall score is a weighted average of individual category scores. Categories with more impact on user experience and security carry more weight.

Performance 25%Security 25%Accessibility 15%SEO 10%Infrastructure 10%Compliance 8%Content 5%Sustainability 2%

Weights reflect general web best practices. Individual needs may differ.

How the composite score is calculated

How you compare

Admiral sites average 73
At average
Better than 28% of Admiral sites See full Admiral benchmark →
Framework sites average 75
At average
Better than 17% of Framework sites

Top Priorities (5)

1

Content-Security-Policy header is missing

Security gaps expose your site and users to attacks, eroding trust.

Security › Security Headers
2

No Content-Security-Policy header found

Security gaps expose your site and users to attacks, eroding trust.

Security › Content Security Policy
3

Page weighs 16.6 MB (7.2 MB transferred)

Performance issues directly impact user engagement and conversion rates.

Performance › Page Weight Budget
4

1 button(s) with no accessible text

Accessibility issues exclude users with disabilities — up to 15% of your potential audience.

Accessibility › Link & Button Quality
5

1 control(s) without accessible label

Accessibility issues exclude users with disabilities — up to 15% of your potential audience.

Accessibility › Form Accessibility
View fix priority matrix

Fix Priority Matrix

5 findings

Quick Wins

2

High impact, low effort — start here.

Strategic

3

High impact, requires investment.

Easy Improvements

0

Small gains, minimal effort.

Nothing in this quadrant — good news.

Deprioritize

0

Low impact, high effort — do last.

Nothing in this quadrant — good news.

← Low effort High effort →
BeaverCheck badge
Embed this badge
[![BeaverCheck](https://beavercheck.com/badge?url=https%3A%2F%2Fcnet.com)](https://beavercheck.com/results/3bafecac-fabc-4fb4-902d-ca4b91556412)
<a href="https://beavercheck.com/results/3bafecac-fabc-4fb4-902d-ca4b91556412"><img src="https://beavercheck.com/badge?url=https%3A%2F%2Fcnet.com" alt="BeaverCheck Score"></a>
https://beavercheck.com/badge?url=https%3A%2F%2Fcnet.com

This badge auto-updates with your latest scan result.

What fixing these means

Your site performs reasonably well, but a few targeted fixes could meaningfully improve results. Your LCP of 14.8s exceeds Google's 2.5s 'Good' threshold and the 1 performance issue below directly contributes to it. Accessibility issues exclude users who rely on assistive technology — an estimated 15% of your potential audience. Addressing the critical issues below would have the most immediate impact on your user trust.

2 security gaps detected — browsers may warn visitors about your site.
Your LCP is 14.8s — fixing the 1 performance critical could bring it under Google's 2.5s 'Good' threshold.
2 accessibility issues exclude users who rely on assistive technology.

Return on Investment

€510 investment → €45/month returns + EUR 120,500,000 risk avoided

Payback period: ~11 months First-year ROI: +5%

Investment

€510

6h · 5 findings

Monthly returns

€45 /mo

~€535 / year

  • Conversions recovered €43
  • Bandwidth savings €1.68

Regulatory risk avoided

EUR 120,500,000

if kept compliant

  • ePrivacy Directive EUR 100,000,000
  • GDPR EUR 20,000,000
  • EAA EUR 500,000

Payback period

0 12mo 24mo

€85 — in quick wins — start here for the fastest payback

Figures combine localized regulatory fine ceilings, search/conversion value priced against local CPC, and bandwidth waste estimates. Results depend on implementation quality and audience composition. Not legal or financial advice.

Full methodology & sources

Estimated Remediation Cost

€510

6.0 developer hours at €85/hr

Based on European Union rates (€85/hr)

Quick wins
€85 2 fixes in ~60 minutes

Start here for the best return on investment

Cost by category

Cost by effort level

Adjust assumptions
/hr

Rates reflect fully-loaded developer cost including overhead

How developer rates are sourced

What Inaction Is Costing You

€10,041,668 / month at risk

~€120,500,020 / year if left unfixed

Compliance Risk

€120,500,000

ePrivacy DirectiveGDPREAA
  • No privacy policy link detected
    GDPR: EUR 10,000 – EUR 20,000,000
  • 3 advertising/retargeting trackers detected
    GDPR: EUR 10,000 – EUR 20,000,000
  • Trackers detected but no cookie policy found
    GDPR: EUR 5,000 – EUR 10,000,000

+7 more

Bandwidth Waste

€1.68 /mo

22630.2 MB/mo × 0.074 EUR/GB

  • Optimize transfer: save ~2.3 MB per page load
    Saves €1.68/mo

Compliance figures represent the statutory maximum fine for the most severe triggered category, capped per regulation — not the sum of per-finding penalties. Based on published regulatory fine ranges. This is not legal advice.

Compliance methodology · SEO assumptions · Bandwidth model

Your performance is already good — improvements may show diminishing returns

Unique monthly visitors from your analytics

Purchases, signups, or key actions

Optional — for revenue estimation

additional conversions/month

more engaged visitors from reduced bounce

potential monthly revenue
Current bounce (est.)
After fixes (est.)
Estimated bounce reduction

Fix 5 critical issues to capture this value

How this is calculated

Based on Google/Deloitte research ("Milliseconds Make Millions") showing a ~7% bounce rate increase per additional second of LCP above the 2.5s "Good" threshold.

Your site's LCP: → estimated after fixes.

These are estimates based on industry research — actual results vary

Bounce-rate model & assumptions

Your data stays in your browser — nothing is sent to our servers

Was this report useful?

Thanks for your feedback!

We'll use a cached audit if available, or offer to scan.

Checking for existing audit...

Lighthouse Scores

Industry-standard audits powered by Google Lighthouse.

26
Performance Overall performance score (0–100) based on Core Web Vitals and other metrics. 90+ is good.
92
Accessibility Measures how accessible the page is for users with disabilities. Checks color contrast, ARIA labels, and semantic HTML.
100
Best Practices Checks for modern web development best practices including HTTPS, no console errors, and secure JavaScript.
92
SEO Measures basic SEO optimizations: meta tags, crawlability, link text, and mobile friendliness.

Core Web Vitals

Key metrics that affect user experience.

First Contentful Paint First Contentful Paint — how long until the browser renders the first piece of content. Under 1.8s is good.

9.42 s

Largest Contentful Paint Largest Contentful Paint — how long until the largest visible element loads. Under 2.5s is good.

14.83 s

Total Blocking Time Total Blocking Time — total time the main thread was blocked, preventing user input. Under 200ms is good.

4.13 s

Cumulative Layout Shift Cumulative Layout Shift — measures visual stability. How much the page layout shifts during loading. Under 0.1 is good.

0.000

Speed Index Speed Index — how quickly content is visually displayed during load. Under 3.4s is good.

12.37 s

Time to Interactive Time to Interactive — how long until the page is fully interactive and responds to user input. Under 3.8s is good.

34.13 s

Detailed Report

Audit breakdown by category with detailed findings.

26

Performance

Insights

Remove large, duplicate JavaScript modules from bundles to reduce unnecessary bytes consumed by network activity.

Why this matters

Performance issues directly impact user engagement and conversion rates.

Polyfills and transforms enable older browsers to use new JavaScript features. However, many aren't necessary for modern browsers. Consider modifying your JavaScript build process to not transpile Baseline features, unless you know you must support older browsers. Learn why most sites can deploy ES6+ code without transpiling

Why this matters

Shipping ES5 transpiled code to modern browsers wastes bytes — every user with an evergreen browser pays for compatibility you don't need.

Learn more

Most users today run browsers that natively support ES6+, async/await, optional chaining, and the rest of modern JavaScript. Transpiling to ES5 'just in case' adds 20-40% to your bundle for no benefit. Configure your build to target a modern browserslist, or ship a differential bundle pair (modern + legacy) with the module/nomodule pattern.

Source: Google web.dev / Lighthouse

3rd party code can significantly impact load performance. Reduce and defer loading of 3rd party code to prioritize your page's content.

Why this matters

Performance issues directly impact user engagement and conversion rates.

Your first network request is the most important. Reduce its latency by avoiding redirects, ensuring a fast server response, and enabling text compression.

Why this matters

Performance issues directly impact user engagement and conversion rates.

A forced reflow occurs when JavaScript queries geometric properties (such as offsetWidth) after styles have been invalidated by a change to the DOM state. This can result in poor performance. Learn more about forced reflows and possible mitigations.

Why this matters

Performance issues directly impact user engagement and conversion rates.

headings: [map[key:source label:Top function call valueType:source-location] map[granularity:1 key:reflowTime label:Total reflow time valueType:ms]]
items: [map[reflowTime:15.585 source:map[column:23360 line:1 type:source-location url:https://www.cnet.com/a/neutron/708c8bde17c4.modern.js urlProvider:network]]]
headings: [map[key:source label:Source valueType:source-location] map[granularity:1 key:reflowTime label:Total reflow time valueType:ms]]
items: [map[reflowTime:3.165 source:map[type:text value:[unattributed]]] map[reflowTime:8.531 source:map[column:104 line:160 type:source-location url:https://cdn.ziffstatic.com/pg/cnet.js urlProvider:network]] map[reflowTime:0.495 source:map[column:248670 line:1 type:source-location url:https://www.cnet.com/a/neutron/eb626a70ccf6.modern.js urlProvider:network]] map[reflowTime:5.329 source:map[column:70729 line:0 type:source-location url:https://www.cnet.com/a/neutron/3d1897abd40d.modern.js urlProvider:network]] map[reflowTime:0.784 source:map[column:253687 line:0 type:source-location url:https://www.cnet.com/a/neutron/3d1897abd40d.modern.js urlProvider:network]] map[reflowTime:4.771 source:map[column:63225 line:0 type:source-location url:https://www.cnet.com/a/neutron/d52d1ea3a562.modern.js urlProvider:network]] map[reflowTime:2.903 source:map[column:6978 line:0 type:source-location url:https://www.cnet.com/a/neutron/a5012ebf0873.modern.js urlProvider:network]] map[reflowTime:15.554 source:map[column:58912 line:0 type:source-location url:https://www.cnet.com/a/neutron/d52d1ea3a562.modern.js urlProvider:network]] map[reflowTime:0.031 source:map[column:61837 line:0 type:source-location url:https://www.cnet.com/a/neutron/d52d1ea3a562.modern.js urlProvider:network]]]

Reducing the download time of images can improve the perceived load time of the page and LCP. Learn more about optimizing image size

Why this matters

Performance issues directly impact user engagement and conversion rates.

URLResource SizeEst Savings
div.c-storiesNeonHighlightsLead_media > div.c-cmsImage > div.c-cmsImage_video > video div.c-storiesNeonHighlightsLead_media > div.c-cmsImage > div.c-cmsImage_video > video
/a/img/resize/45dc3ed12ffab202ee43fee530a3c7516d9b6e72/hu...544.3 KiB495.8 KiB
/a/img/resize/67645cd53bcf5acd9b0ef7347e22f12b69936d69/hu...6.8 KiB4.0 KiB

Optimize LCP by making the LCP image discoverable from the HTML immediately, and avoiding lazy-loading

Why this matters

Performance issues directly impact user engagement and conversion rates.

lhId: page-0-VIDEO
nodeLabel: div.c-storiesNeonHighlightsLead_media > div.c-cmsImage > div.c-cmsImage_video > video
path: 1,HTML,1,BODY,1,DIV,1,DIV,0,DIV,10,MAIN,0,DIV,0,DIV,0,DIV,0,DIV,0,DIV,0,DIV,0,DIV,2,DIV,0,DIV,1,DIV,0,DIV,0,A,0,DIV,0,DIV,0,DIV,0,DIV,0,VIDEO
selector: div.c-storiesNeonHighlightsLead_media > div.c-cmsImage > div.c-cmsImage_video > video
snippet: <video src="https://www.cnet.com/a/img/resize/102c5db689c0443be53c7d05547f1392c3165004…" poster="https://www.cnet.com/a/img/resize/45dc3ed12ffab202ee43fee530a3c7516d9b6e72…" width="1280" height="720" autoplay="autoplay" loop="loop" muted="muted" playsinline="" disableremoteplayback="">

Avoid chaining critical requests by reducing the length of chains, reducing the download size of resources, or deferring the download of unnecessary resources to improve page load.

Why this matters

Performance issues directly impact user engagement and conversion rates.

description: [preconnect](https://developer.chrome.com/docs/lighthouse/performance/uses-rel-preconnect/) hints help the browser establish a connection earlier in the page load, saving time when the first request for that origin is made. The following are the origins that the page preconnected to.
title: Preconnected origins
description: Add [preconnect](https://developer.chrome.com/docs/lighthouse/performance/uses-rel-preconnect/) hints to your most important origins, but try to use no more than 4.
title: Preconnect candidates
value: No additional origins are good candidates for preconnecting

Requests are blocking the page's initial render, which may delay LCP. Deferring or inlining can move these network requests out of the critical path.

Why this matters

Performance issues directly impact user engagement and conversion rates.

URLTransfer SizeDuration
cdn.ziffstatic.com/pg/cnet.css1001 B755 ms

These insights are also available in the Chrome DevTools Performance Panel - record a trace to view more detailed information.

Time to Interactive is the amount of time it takes for the page to become fully interactive. Learn more about the Time to Interactive metric.

Why this matters

Performance issues directly impact user engagement and conversion rates.

TTI

The maximum potential First Input Delay that your users could experience is the duration of the longest task. Learn more about the Maximum Potential First Input Delay metric.

Why this matters

Performance issues directly impact user engagement and conversion rates.

Redirects introduce additional delays before the page can be loaded. Learn how to avoid page redirects.

Why this matters

Performance issues directly impact user engagement and conversion rates.

Estimated savings: 751 ms
URLTime Spent
cnet.com/751 ms
www.cnet.com/0.0 ms

Keep the server response time for the main document short because all other requests depend on it. Learn more about the Time to First Byte metric.

Why this matters

Performance issues directly impact user engagement and conversion rates.

Estimated savings: 525 ms
URLTime Spent
www.cnet.com/625 ms

Diagnostics

Reduce unused JavaScript and defer loading scripts until they are required to decrease bytes consumed by network activity. Learn how to reduce unused JavaScript.

Why this matters

Multi-megabyte JavaScript bundles delay every interactive feature on the page.

Learn more

This is the Lighthouse audit fired when too much JS is shipped relative to what executes. The fix isn't a config flag — it requires bundle analysis (webpack-bundle-analyzer, rollup-plugin-visualizer), splitting routes into chunks, lazy-loading off-screen components, and removing unused dependencies. Fundamentally different from minification: minifying reduces byte count, this reduces what's downloaded at all.

Source: Google web.dev / Lighthouse

Consider reducing the time spent parsing, compiling, and executing JS. You may find delivering smaller JS payloads helps with this. Learn how to reduce Javascript execution time.

Why this matters

Performance issues directly impact user engagement and conversion rates.

URLTotal CPU TimeScript EvaluationScript Parse
www.cnet.com/a/neutron/eb626a70ccf6.modern.js3.3 s3.0 s28 ms
www.cnet.com/1.4 s96 ms248 ms
Unattributable1.2 s135 ms0.0 ms
cdn.ziffstatic.com/jst/otTCF.202512.1.0.js598 ms522 ms4.8 ms
www.cnet.com/a/neutron/6518b13b9504.modern.js512 ms439 ms4.2 ms
client.aps.amazon-adsystem.com/publisher.js410 ms372 ms32 ms
/pagead/managed/js/gpt/m202604100101/pubads_impl.js401 ms342 ms45 ms
www.cnet.com/a/neutron/47d696a75771.modern.js396 ms262 ms5.0 ms
cdn.ziffstatic.com/jst/otBannerSdk.202512.1.0.js391 ms287 ms41 ms
www.googletagmanager.com/gtag/destination?id=G-R820W8QX02&cx=c&gtm=4e64e1357 ms308 ms47 ms
www.cnet.com/a/neutron/da62f8586255.modern.js334 ms306 ms3.0 ms
cdn.confiant-integrations.net/gptprebidnative/202603241056/wrap.js319 ms286 ms30 ms
cdn.ziffstatic.com/pg/cnet.js217 ms122 ms26 ms
www.cnet.com/a/neutron/2737a08764f1.modern.js191 ms190 ms0.4 ms
fundingchoicesmessages.google.com/i/pub-8038936283815017?ers=1191 ms172 ms16 ms
cdn.ziffstatic.com/pg/cnet.prebid.js186 ms128 ms56 ms
/w37htfhcq2/vendor/474a4045-633c-42d5-8a01-35be527d3b9a/m...185 ms96 ms33 ms
www.googletagmanager.com/gtm.js?id=GTM-NHBTHTVT179 ms152 ms24 ms
openads-cdn.adsrvr.org/openadsjs/build/v1.0/ziffdavis/openads.js159 ms122 ms36 ms
www.cnet.com/a/neutron/d77860478607.modern.js143 ms141 ms1.6 ms
/a4flkt7l2b/z9gd/45898/www.cnet.com/jsonp/z?cb=1776295376...140 ms134 ms0.3 ms
/J3UXFee1xclY-bfFlWh1mIZ_phU/gpt_and_prebid/config.js101 ms24 ms25 ms
frugalfiestas.com/public/de27c0d40747/04bc79fd5f2951beba7a20d2.js101 ms62 ms9.6 ms
securepubads.g.doubleclick.net/tag/js/gpt.js100 ms89 ms11 ms
pub.doubleverify.com/dvtag/33936767/DV1379166/pub.js86 ms73 ms12 ms
www.cnet.com/a/neutron/708c8bde17c4.modern.js84 ms4.6 ms0.1 ms
cdn.ziffstatic.com/jst/zdconsent.js72 ms59 ms6.3 ms
static.chartbeat.com/js/chartbeat.js53 ms48 ms4.0 ms

Consider reducing the time spent parsing, compiling and executing JS. You may find delivering smaller JS payloads helps with this. Learn how to minimize main-thread work

Why this matters

Performance issues directly impact user engagement and conversion rates.

CategoryTime Spent
Script Evaluation8.3 s
Other1.4 s
Style & Layout856 ms
Script Parsing & Compilation800 ms
Garbage Collection396 ms
Parse HTML & CSS316 ms
Rendering130 ms

More information about the performance of your application. These numbers don't directly affect the Performance score.

Layout shift culprits
Optimize DOM size
Font display
LCP breakdown
Modern HTTP
Optimize viewport for mobile
Minify CSS
Minify JavaScript
Reduce unused CSS
User Timing marks and measures 25 user timings
Avoid long main-thread tasks 20 long tasks found
Image elements have explicit `width` and `height`
Page didn't prevent back/forward cache restoration
Network Requests
Network Round Trip Times 100 ms
Server Backend Latencies 120 ms
Tasks
Diagnostics
Metrics
Screenshot Thumbnails
Final Screenshot
Script Treemap Data
Resources Summary
INP breakdown
Avoid non-composited animations
Avoid large layout shifts
92

Accessibility

These checks highlight opportunities to improve the accessibility of your web app. Automatic detection can only detect a subset of issues and does not guarantee the accessibility of your web app, so manual testing is also encouraged.

Names and labels

When a button doesn't have an accessible name, screen readers announce it as "button", making it unusable for users who rely on screen readers. Learn how to make buttons more accessible.

Why this matters

Performance issues directly impact user engagement and conversion rates.

Failing Elements
div.c-siteHeaderMasthead_container > div.c-siteHeaderMasthead_logoLogin > div.c-siteHeaderMasthead_searchLogin > button.c-siteHeaderMasthead_mobileNav div.c-siteHeaderMasthead_container > div.c-siteHeaderMasthead_logoLogin > div.c-siteHeaderMasthead_searchLogin > button.c-siteHeaderMasthead_mobileNav

These are opportunities to improve the semantics of the controls in your application. This may enhance the experience for users of assistive technology, like a screen reader.

Best practices

Touch targets with sufficient size and spacing help users who may have difficulty targeting small controls to activate the targets. Learn more about touch targets.

Why this matters

Performance issues directly impact user engagement and conversion rates.

Failing Elements
2 div.c-paginationControl_buttons-wrapper > div.c-paginationControl_buttons > div.c-paginationControl_button > a
3 div.c-paginationControl_buttons-wrapper > div.c-paginationControl_buttons > div.c-paginationControl_button > a
4 div.c-paginationControl_buttons-wrapper > div.c-paginationControl_buttons > div.c-paginationControl_button > a
5 div.c-paginationControl_buttons-wrapper > div.c-paginationControl_buttons > div.c-paginationControl_button > a
6 div.c-paginationControl_buttons-wrapper > div.c-paginationControl_buttons > div.c-paginationControl_button > a
7 div.c-paginationControl_buttons-wrapper > div.c-paginationControl_buttons > div.c-paginationControl_button > a
8 div.c-paginationControl_buttons-wrapper > div.c-paginationControl_buttons > div.c-paginationControl_button > a
9 div.c-paginationControl_buttons-wrapper > div.c-paginationControl_buttons > div.c-paginationControl_button > a

These items highlight common accessibility best practices.

Visible text labels that do not match the accessible name can result in a confusing experience for screen reader users. Learn more about accessible names.

Why this matters

Performance issues directly impact user engagement and conversion rates.

Failing Elements
Manage Preferences div.md:flex > div.md:max-w-80 > div.mb-6 > a.primary-link
Our Privacy Policy div#onetrust-group-container > div#onetrust-policy > div#onetrust-policy-text > a.ot-cookie-policy-link
Interactive controls are keyboard focusable
Interactive elements indicate their purpose and state
The page has a logical tab order
Visual order on the page follows DOM order
User focus is not accidentally trapped in a region
The user's focus is directed to new content added to the page
HTML5 landmark elements are used to improve navigation
Offscreen content is hidden from assistive technology
Custom controls have associated labels
Custom controls have ARIA roles
`[aria-*]` attributes match their roles
`[aria-hidden="true"]` is not present on the document `<body>`
`[role]`s have all required `[aria-*]` attributes
`[role]` values are valid
`[aria-*]` attributes have valid values
`[aria-*]` attributes are valid and not misspelled
Image elements have `[alt]` attributes
Input buttons have discernible text.
Form elements have associated labels
`[user-scalable="no"]` is not used in the `<meta name="viewport">` element and the `[maximum-scale]` attribute is not less than 5.
ARIA attributes are used as specified for the element's role
Elements with `role="dialog"` or `role="alertdialog"` have accessible names.
`[aria-hidden="true"]` elements do not contain focusable descendents
Elements use only permitted ARIA attributes
Background and foreground colors have a sufficient contrast ratio
Document has a `<title>` element
`<html>` element has a `[lang]` attribute
`<html>` element has a valid value for its `[lang]` attribute
Links are distinguishable without relying on color.
Links have a discernible name
No element has a `[tabindex]` value greater than 0
Heading elements appear in a sequentially-descending order
Document has a main landmark.
Deprecated ARIA roles were not used
`<video>` elements contain a `<track>` element with `[kind="captions"]`
`[accesskey]` values are unique
`button`, `link`, and `menuitem` elements have accessible names
ARIA input fields have accessible names
ARIA `meter` elements have accessible names
ARIA `progressbar` elements have accessible names
Elements with an ARIA `[role]` that require children to contain a specific `[role]` have all required children.
`[role]`s are contained by their required parent element
Elements with the `role=text` attribute do not have focusable descendents.
ARIA toggle fields have accessible names
ARIA `tooltip` elements have accessible names
ARIA `treeitem` elements have accessible names
The page contains a heading, skip link, or landmark region
`<dl>`'s contain only properly-ordered `<dt>` and `<dd>` groups, `<script>`, `<template>` or `<div>` elements.
Definition list items are wrapped in `<dl>` elements
ARIA IDs are unique
No form fields have multiple labels
`<frame>` or `<iframe>` elements have a title
`<html>` element has an `[xml:lang]` attribute with the same base language as the `[lang]` attribute.
`<input type="image">` elements have `[alt]` text
Lists contain only `<li>` elements and script supporting elements (`<script>` and `<template>`).
List items (`<li>`) are contained within `<ul>`, `<ol>` or `<menu>` parent elements
The document does not use `<meta http-equiv="refresh">`
`<object>` elements have alternate text
Select elements have associated label elements.
Skip links are focusable.
Cells in a `<table>` element that use the `[headers]` attribute refer to table cells within the same table.
`<th>` elements and elements with `[role="columnheader"/"rowheader"]` have data cells they describe.
`[lang]` attributes have a valid value
Tables have different content in the summary attribute and `<caption>`.
All heading elements contain content.
Uses ARIA roles only on compatible elements
Image elements do not have `[alt]` attributes that are redundant text.
Identical links have the same purpose.
Tables use `<caption>` instead of cells with the `[colspan]` attribute to indicate a caption.
`<td>` elements in a large `<table>` have one or more table headers.
100

Best Practices

General

Source maps translate minified code to the original source code. This helps developers debug in production. In addition, Lighthouse is able to provide further insights. Consider deploying source maps to take advantage of these benefits. Learn more about source maps.

Why this matters

Performance issues directly impact user engagement and conversion rates.

Uses HTTPS
Avoids deprecated APIs
Avoids third-party cookies
Allows users to paste into input fields
Avoids requesting the geolocation permission on page load
Avoids requesting the notification permission on page load
Displays images with correct aspect ratio
Serves images with appropriate resolution
Page has the HTML doctype
Properly defines charset
No browser errors logged to the console
No issues in the `Issues` panel in Chrome Devtools
Ensure CSP is effective against XSS attacks
Ensure proper origin isolation with COOP
Mitigate clickjacking with XFO or CSP
Mitigate DOM-based XSS with Trusted Types
Detected JavaScript libraries
Redirects HTTP traffic to HTTPS
Use a strong HSTS policy
92

SEO

These checks ensure that your page is following basic search engine optimization advice. There are many additional factors Lighthouse does not score here that may affect your search ranking, including performance on Core Web Vitals. Learn more about Google Search Essentials.

Crawling and Indexing

Search engines may use `href` attributes on links to crawl websites. Ensure that the `href` attribute of anchor elements links to an appropriate destination, so more pages of the site can be discovered. Learn how to make links crawlable

Why this matters

Performance issues directly impact user engagement and conversion rates.

Uncrawlable Link
Learn more div.c-storiesExpertise > div.c-storiesExpertise_headContainer > div.c-storiesExpertise_ctaContainer > a.c-storiesExpertise_cta

To appear in search results, crawlers need access to your app.

Structured data is valid
Page isn’t blocked from indexing
Document has a `<title>` element
Document has a meta description
Page has successful HTTP status code
Links have descriptive text
robots.txt is valid
Image elements have `[alt]` attributes
Document has a valid `hreflang`
Document has a valid `rel=canonical`

Lighthouse Scores

Industry-standard audits powered by Google Lighthouse. — Desktop

40
Performance Overall performance score (0–100) based on Core Web Vitals and other metrics. 90+ is good.
100
Accessibility Measures how accessible the page is for users with disabilities. Checks color contrast, ARIA labels, and semantic HTML.
96
Best Practices Checks for modern web development best practices including HTTPS, no console errors, and secure JavaScript.
92
SEO Measures basic SEO optimizations: meta tags, crawlability, link text, and mobile friendliness.

Core Web Vitals

Key metrics that affect user experience. — Desktop

First Contentful Paint First Contentful Paint — how long until the browser renders the first piece of content. Under 1.8s is good.

1.78 s

Largest Contentful Paint Largest Contentful Paint — how long until the largest visible element loads. Under 2.5s is good.

3.93 s

Total Blocking Time Total Blocking Time — total time the main thread was blocked, preventing user input. Under 200ms is good.

673 ms

Cumulative Layout Shift Cumulative Layout Shift — measures visual stability. How much the page layout shifts during loading. Under 0.1 is good.

0.000

Speed Index Speed Index — how quickly content is visually displayed during load. Under 3.4s is good.

3.53 s

Time to Interactive Time to Interactive — how long until the page is fully interactive and responds to user input. Under 3.8s is good.

6.74 s

Detailed Report

Audit breakdown by category with detailed findings.

40

Performance

Insights

Remove large, duplicate JavaScript modules from bundles to reduce unnecessary bytes consumed by network activity.

Why this matters

Performance issues directly impact user engagement and conversion rates.

Polyfills and transforms enable older browsers to use new JavaScript features. However, many aren't necessary for modern browsers. Consider modifying your JavaScript build process to not transpile Baseline features, unless you know you must support older browsers. Learn why most sites can deploy ES6+ code without transpiling

Why this matters

Shipping ES5 transpiled code to modern browsers wastes bytes — every user with an evergreen browser pays for compatibility you don't need.

Learn more

Most users today run browsers that natively support ES6+, async/await, optional chaining, and the rest of modern JavaScript. Transpiling to ES5 'just in case' adds 20-40% to your bundle for no benefit. Configure your build to target a modern browserslist, or ship a differential bundle pair (modern + legacy) with the module/nomodule pattern.

Source: Google web.dev / Lighthouse

3rd party code can significantly impact load performance. Reduce and defer loading of 3rd party code to prioritize your page's content.

Why this matters

Performance issues directly impact user engagement and conversion rates.

A forced reflow occurs when JavaScript queries geometric properties (such as offsetWidth) after styles have been invalidated by a change to the DOM state. This can result in poor performance. Learn more about forced reflows and possible mitigations.

Why this matters

Performance issues directly impact user engagement and conversion rates.

headings: [map[key:source label:Top function call valueType:source-location] map[granularity:1 key:reflowTime label:Total reflow time valueType:ms]]
items: [map[reflowTime:26.174 source:map[column:23360 line:1 type:source-location url:https://www.cnet.com/a/neutron/708c8bde17c4.modern.js urlProvider:network]]]
headings: [map[key:source label:Source valueType:source-location] map[granularity:1 key:reflowTime label:Total reflow time valueType:ms]]
items: [map[reflowTime:11.21 source:map[column:85 line:160 type:source-location url:https://cdn.ziffstatic.com/pg/cnet.js urlProvider:network]] map[reflowTime:5.405 source:map[column:70745 line:0 type:source-location url:https://www.cnet.com/a/neutron/3d1897abd40d.modern.js urlProvider:network]] map[reflowTime:0.807 source:map[column:253703 line:0 type:source-location url:https://www.cnet.com/a/neutron/3d1897abd40d.modern.js urlProvider:network]] map[reflowTime:4.149 source:map[column:63225 line:0 type:source-location url:https://www.cnet.com/a/neutron/d52d1ea3a562.modern.js urlProvider:network]] map[reflowTime:7.731 source:map[column:6978 line:0 type:source-location url:https://www.cnet.com/a/neutron/a5012ebf0873.modern.js urlProvider:network]] map[reflowTime:0.076 source:map[column:1862 line:0 type:source-location url:https://www.cnet.com/a/neutron/708c8bde17c4.modern.js urlProvider:network]] map[reflowTime:1.112 source:map[column:156831 line:1 type:source-location url:https://www.cnet.com/a/neutron/47d696a75771.modern.js urlProvider:network]] map[reflowTime:26.174 source:map[column:61837 line:0 type:source-location url:https://www.cnet.com/a/neutron/d52d1ea3a562.modern.js urlProvider:network]]]

Optimize LCP by making the LCP image discoverable from the HTML immediately, and avoiding lazy-loading

Why this matters

Performance issues directly impact user engagement and conversion rates.

lhId: page-0-VIDEO
nodeLabel: div.c-storiesNeonHighlightsLead_media > div.c-cmsImage > div.c-cmsImage_video > video
path: 1,HTML,1,BODY,1,DIV,1,DIV,0,DIV,10,MAIN,0,DIV,0,DIV,0,DIV,0,DIV,0,DIV,0,DIV,0,DIV,2,DIV,0,DIV,1,DIV,0,DIV,0,A,0,DIV,0,DIV,0,DIV,0,DIV,0,VIDEO
selector: div.c-storiesNeonHighlightsLead_media > div.c-cmsImage > div.c-cmsImage_video > video
snippet: <video src="https://www.cnet.com/a/img/resize/102c5db689c0443be53c7d05547f1392c3165004…" poster="https://www.cnet.com/a/img/resize/45dc3ed12ffab202ee43fee530a3c7516d9b6e72…" width="1280" height="720" autoplay="autoplay" loop="loop" muted="muted" playsinline="" disableremoteplayback="">

Avoid chaining critical requests by reducing the length of chains, reducing the download size of resources, or deferring the download of unnecessary resources to improve page load.

Why this matters

Performance issues directly impact user engagement and conversion rates.

description: [preconnect](https://developer.chrome.com/docs/lighthouse/performance/uses-rel-preconnect/) hints help the browser establish a connection earlier in the page load, saving time when the first request for that origin is made. The following are the origins that the page preconnected to.
title: Preconnected origins
description: Add [preconnect](https://developer.chrome.com/docs/lighthouse/performance/uses-rel-preconnect/) hints to your most important origins, but try to use no more than 4.
title: Preconnect candidates

Your first network request is the most important. Reduce its latency by avoiding redirects, ensuring a fast server response, and enabling text compression.

Why this matters

Performance issues directly impact user engagement and conversion rates.

Reducing the download time of images can improve the perceived load time of the page and LCP. Learn more about optimizing image size

Why this matters

Performance issues directly impact user engagement and conversion rates.

URLResource SizeEst Savings
div.c-storiesNeonHighlightsLead_media > div.c-cmsImage > div.c-cmsImage_video > video div.c-storiesNeonHighlightsLead_media > div.c-cmsImage > div.c-cmsImage_video > video
/a/img/resize/45dc3ed12ffab202ee43fee530a3c7516d9b6e72/hu...544.3 KiB499.1 KiB
a.c-storiesNeonLatest_story > div.c-cmsImage > picture.c-cmsImage_image > img a.c-storiesNeonLatest_story > div.c-cmsImage > picture.c-cmsImage_image > img
/a/img/resize/54cbb5612b5d7145acf6bf22bd56c9648132f5e9/hu...34.4 KiB28.4 KiB

Requests are blocking the page's initial render, which may delay LCP. Deferring or inlining can move these network requests out of the critical path.

Why this matters

Performance issues directly impact user engagement and conversion rates.

URLTransfer SizeDuration
cdn.ziffstatic.com/pg/cnet.css1001 B206 ms

These insights are also available in the Chrome DevTools Performance Panel - record a trace to view more detailed information.

Redirects introduce additional delays before the page can be loaded. Learn how to avoid page redirects.

Why this matters

Performance issues directly impact user engagement and conversion rates.

Estimated savings: 201 ms
URLTime Spent
cnet.com/201 ms
www.cnet.com/0.0 ms

The maximum potential First Input Delay that your users could experience is the duration of the longest task. Learn more about the Maximum Potential First Input Delay metric.

Why this matters

Performance issues directly impact user engagement and conversion rates.

Time to Interactive is the amount of time it takes for the page to become fully interactive. Learn more about the Time to Interactive metric.

Why this matters

Performance issues directly impact user engagement and conversion rates.

TTI

Diagnostics

Reduce unused JavaScript and defer loading scripts until they are required to decrease bytes consumed by network activity. Learn how to reduce unused JavaScript.

Why this matters

Multi-megabyte JavaScript bundles delay every interactive feature on the page.

Learn more

This is the Lighthouse audit fired when too much JS is shipped relative to what executes. The fix isn't a config flag — it requires bundle analysis (webpack-bundle-analyzer, rollup-plugin-visualizer), splitting routes into chunks, lazy-loading off-screen components, and removing unused dependencies. Fundamentally different from minification: minifying reduces byte count, this reduces what's downloaded at all.

Source: Google web.dev / Lighthouse

Consider reducing the time spent parsing, compiling, and executing JS. You may find delivering smaller JS payloads helps with this. Learn how to reduce Javascript execution time.

Why this matters

Performance issues directly impact user engagement and conversion rates.

Consider reducing the time spent parsing, compiling and executing JS. You may find delivering smaller JS payloads helps with this. Learn how to minimize main-thread work

Why this matters

Performance issues directly impact user engagement and conversion rates.

CategoryTime Spent
Script Evaluation2.2 s
Other423 ms
Style & Layout254 ms
Script Parsing & Compilation238 ms
Garbage Collection101 ms
Parse HTML & CSS89 ms
Rendering37 ms

More information about the performance of your application. These numbers don't directly affect the Performance score.

Layout shift culprits
Optimize DOM size
Font display
LCP breakdown
Modern HTTP
Optimize viewport for mobile
Minify CSS
Minify JavaScript
Reduce unused CSS
User Timing marks and measures 25 user timings
Avoid long main-thread tasks 11 long tasks found
Avoid non-composited animations 6 animated elements found
Image elements have explicit `width` and `height`
Page didn't prevent back/forward cache restoration
Network Requests
Network Round Trip Times 100 ms
Server Backend Latencies 120 ms
Tasks
Diagnostics
Metrics
Screenshot Thumbnails
Final Screenshot
Script Treemap Data
Resources Summary
Initial server response time was short Root document took 110 ms
Avoid large layout shifts 1 layout shift found
INP breakdown
100

Accessibility

These checks highlight opportunities to improve the accessibility of your web app. Automatic detection can only detect a subset of issues and does not guarantee the accessibility of your web app, so manual testing is also encouraged.

Visible text labels that do not match the accessible name can result in a confusing experience for screen reader users. Learn more about accessible names.

Why this matters

Performance issues directly impact user engagement and conversion rates.

Failing Elements
Manage Preferences div.md:flex > div.md:max-w-80 > div.mb-6 > a.primary-link
Our Privacy Policy div#onetrust-group-container > div#onetrust-policy > div#onetrust-policy-text > a.ot-cookie-policy-link
Interactive controls are keyboard focusable
Interactive elements indicate their purpose and state
The page has a logical tab order
Visual order on the page follows DOM order
User focus is not accidentally trapped in a region
The user's focus is directed to new content added to the page
HTML5 landmark elements are used to improve navigation
Offscreen content is hidden from assistive technology
Custom controls have associated labels
Custom controls have ARIA roles
`[aria-*]` attributes match their roles
`[aria-hidden="true"]` is not present on the document `<body>`
`[role]`s have all required `[aria-*]` attributes
`[role]` values are valid
`[aria-*]` attributes have valid values
`[aria-*]` attributes are valid and not misspelled
Buttons have an accessible name
Image elements have `[alt]` attributes
Input buttons have discernible text.
Form elements have associated labels
`[user-scalable="no"]` is not used in the `<meta name="viewport">` element and the `[maximum-scale]` attribute is not less than 5.
ARIA attributes are used as specified for the element's role
Elements with `role="dialog"` or `role="alertdialog"` have accessible names.
`[aria-hidden="true"]` elements do not contain focusable descendents
Elements use only permitted ARIA attributes
Background and foreground colors have a sufficient contrast ratio
Document has a `<title>` element
`<html>` element has a `[lang]` attribute
`<html>` element has a valid value for its `[lang]` attribute
Links are distinguishable without relying on color.
Links have a discernible name
Lists contain only `<li>` elements and script supporting elements (`<script>` and `<template>`).
List items (`<li>`) are contained within `<ul>`, `<ol>` or `<menu>` parent elements
No element has a `[tabindex]` value greater than 0
Touch targets have sufficient size and spacing.
Heading elements appear in a sequentially-descending order
Document has a main landmark.
Deprecated ARIA roles were not used
`<video>` elements contain a `<track>` element with `[kind="captions"]`
`[accesskey]` values are unique
`button`, `link`, and `menuitem` elements have accessible names
ARIA input fields have accessible names
ARIA `meter` elements have accessible names
ARIA `progressbar` elements have accessible names
Elements with an ARIA `[role]` that require children to contain a specific `[role]` have all required children.
`[role]`s are contained by their required parent element
Elements with the `role=text` attribute do not have focusable descendents.
ARIA toggle fields have accessible names
ARIA `tooltip` elements have accessible names
ARIA `treeitem` elements have accessible names
The page contains a heading, skip link, or landmark region
`<dl>`'s contain only properly-ordered `<dt>` and `<dd>` groups, `<script>`, `<template>` or `<div>` elements.
Definition list items are wrapped in `<dl>` elements
ARIA IDs are unique
No form fields have multiple labels
`<frame>` or `<iframe>` elements have a title
`<html>` element has an `[xml:lang]` attribute with the same base language as the `[lang]` attribute.
`<input type="image">` elements have `[alt]` text
The document does not use `<meta http-equiv="refresh">`
`<object>` elements have alternate text
Select elements have associated label elements.
Skip links are focusable.
Cells in a `<table>` element that use the `[headers]` attribute refer to table cells within the same table.
`<th>` elements and elements with `[role="columnheader"/"rowheader"]` have data cells they describe.
`[lang]` attributes have a valid value
Tables have different content in the summary attribute and `<caption>`.
All heading elements contain content.
Uses ARIA roles only on compatible elements
Image elements do not have `[alt]` attributes that are redundant text.
Identical links have the same purpose.
Tables use `<caption>` instead of cells with the `[colspan]` attribute to indicate a caption.
`<td>` elements in a large `<table>` have one or more table headers.
96

Best Practices

User Experience

Image display dimensions should match natural aspect ratio. Learn more about image aspect ratio.

Why this matters

Performance issues directly impact user engagement and conversion rates.

URLAspect Ratio (Displayed)Aspect Ratio (Actual)
a.c-storiesNeonHighlightsCard_link > div.c-cmsImage > picture.c-cmsImage_image > img a.c-storiesNeonHighlightsCard_link > div.c-cmsImage > picture.c-cmsImage_image > img
/a/img/resize/17ee1d5d5a927ae58e249f8a3006b8432c522898/hu...320 x 180 (1.78)416 x 228 (1.82)
a.c-storiesNeonHighlightsCard_link > div.c-cmsImage > picture.c-cmsImage_image > img a.c-storiesNeonHighlightsCard_link > div.c-cmsImage > picture.c-cmsImage_image > img
/a/img/resize/d603adf83b70668622b260f84fdf39c3f8d01ad5/hu...320 x 180 (1.78)416 x 228 (1.82)
a.c-storiesNeonHighlightsCard_link > div.c-cmsImage > picture.c-cmsImage_image > img a.c-storiesNeonHighlightsCard_link > div.c-cmsImage > picture.c-cmsImage_image > img
/a/img/resize/e51db0653de2aa299724761236a77272e1cb31cb/hu...320 x 180 (1.78)416 x 228 (1.82)
a.c-storiesNeonHighlightsCard_link > div.c-cmsImage > picture.c-cmsImage_image > img a.c-storiesNeonHighlightsCard_link > div.c-cmsImage > picture.c-cmsImage_image > img
/a/img/resize/a69066034dedfd36987106969409fcfd355d4e53/hu...320 x 180 (1.78)416 x 228 (1.82)
a.c-storiesNeonHighlightsCard_link > div.c-cmsImage > picture.c-cmsImage_image > img a.c-storiesNeonHighlightsCard_link > div.c-cmsImage > picture.c-cmsImage_image > img
/a/img/resize/3d4ab56d8b55cfaa236550e0edff334b8876fe37/hu...320 x 180 (1.78)416 x 228 (1.82)
a.c-storiesNeonHighlightsCard_link > div.c-cmsImage > picture.c-cmsImage_image > img a.c-storiesNeonHighlightsCard_link > div.c-cmsImage > picture.c-cmsImage_image > img
/a/img/resize/71e03f703ab3adcb58b666d833c16d83b0d838d4/hu...320 x 180 (1.78)416 x 228 (1.82)
a.c-storiesNeonHighlightsCard_link > div.c-cmsImage > picture.c-cmsImage_image > img a.c-storiesNeonHighlightsCard_link > div.c-cmsImage > picture.c-cmsImage_image > img
/a/img/resize/a69066034dedfd36987106969409fcfd355d4e53/hu...320 x 180 (1.78)416 x 228 (1.82)

General

Source maps translate minified code to the original source code. This helps developers debug in production. In addition, Lighthouse is able to provide further insights. Consider deploying source maps to take advantage of these benefits. Learn more about source maps.

Why this matters

Performance issues directly impact user engagement and conversion rates.

Uses HTTPS
Avoids deprecated APIs
Avoids third-party cookies
Allows users to paste into input fields
Avoids requesting the geolocation permission on page load
Avoids requesting the notification permission on page load
Serves images with appropriate resolution
Page has the HTML doctype
Properly defines charset
No browser errors logged to the console
No issues in the `Issues` panel in Chrome Devtools
Ensure CSP is effective against XSS attacks
Ensure proper origin isolation with COOP
Mitigate clickjacking with XFO or CSP
Mitigate DOM-based XSS with Trusted Types
Detected JavaScript libraries
Redirects HTTP traffic to HTTPS
Use a strong HSTS policy
92

SEO

These checks ensure that your page is following basic search engine optimization advice. There are many additional factors Lighthouse does not score here that may affect your search ranking, including performance on Core Web Vitals. Learn more about Google Search Essentials.

Crawling and Indexing

Search engines may use `href` attributes on links to crawl websites. Ensure that the `href` attribute of anchor elements links to an appropriate destination, so more pages of the site can be discovered. Learn how to make links crawlable

Why this matters

Performance issues directly impact user engagement and conversion rates.

Uncrawlable Link
Learn more div.c-storiesExpertise > div.c-storiesExpertise_headContainer > div.c-storiesExpertise_ctaContainer > a.c-storiesExpertise_cta

To appear in search results, crawlers need access to your app.

Structured data is valid
Page isn’t blocked from indexing
Document has a `<title>` element
Document has a meta description
Page has successful HTTP status code
Links have descriptive text
robots.txt is valid
Image elements have `[alt]` attributes
Document has a valid `hreflang`
Document has a valid `rel=canonical`

Send Feedback