United Stated · New York Completed: Apr 21, 2026 18:46 UTC
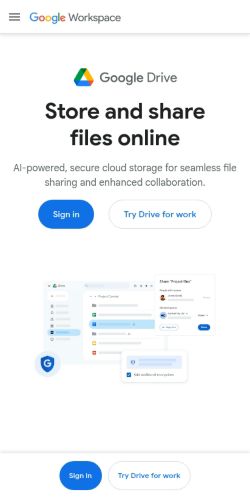
Mobile 375 × 812
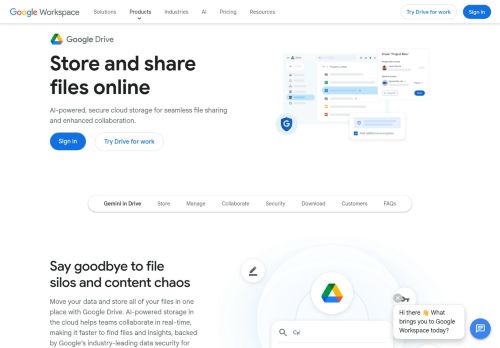
Desktop 1440 × 900
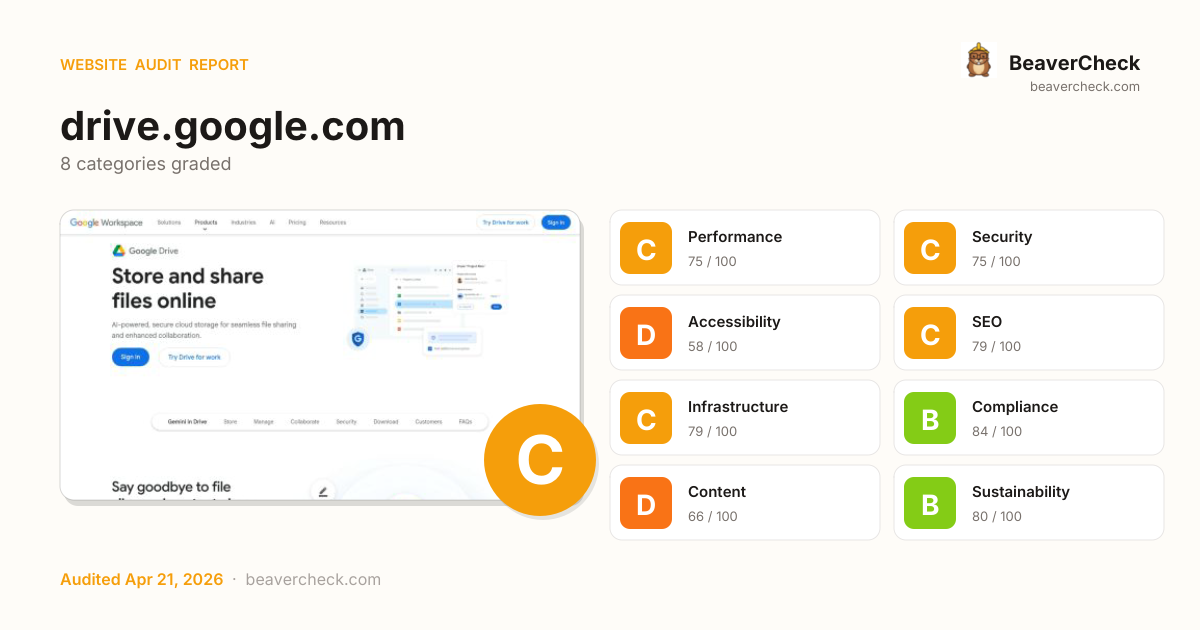
Score: 74 / 100
Based on 8 categories, 0 sections
Decent speed, but optimizing further could improve engagement.
Good foundation, but a few gaps could be exploited.
Several issues make your site difficult for assistive technology users.
Solid SEO basics — a few optimizations could boost rankings.
Good server performance with room for optimization.
Mostly compliant — a few items need attention.
Missing metadata means poor previews on social media and search.
Reasonable footprint with room for optimization.
The overall score is a weighted average of individual category scores. Categories with more impact on user experience and security carry more weight.
Weights reflect general web best practices. Individual needs may differ.
'unsafe-inline' found in script source
Security gaps expose your site and users to attacks, eroding trust.
Cookie 'NID' is missing the Secure flag
Security gaps expose your site and users to attacks, eroding trust.
1 control(s) without accessible label
Accessibility issues exclude users with disabilities — up to 15% of your potential audience.
No <main> landmark found
Accessibility issues exclude users with disabilities — up to 15% of your potential audience.
147 third-party resources (100% of weight)
Performance issues directly impact user engagement and conversion rates.
High impact, low effort — start here.
High impact, requires investment.
Small gains, minimal effort.
Nothing in this quadrant — good news.
Low impact, high effort — do last.
Nothing in this quadrant — good news.
[](https://beavercheck.com/results/40144172-b88d-47d3-b7c3-b9b9cd8fcfa6)<a href="https://beavercheck.com/results/40144172-b88d-47d3-b7c3-b9b9cd8fcfa6"><img src="https://beavercheck.com/badge?url=https%3A%2F%2Fdrive.google.com" alt="BeaverCheck Score"></a>https://beavercheck.com/badge?url=https%3A%2F%2Fdrive.google.comThis badge auto-updates with your latest scan result.
Your site performs reasonably well, but a few targeted fixes could meaningfully improve results. Your LCP of 11.9s exceeds Google's 2.5s 'Good' threshold and the 1 performance issue below directly contributes to it. Accessibility issues exclude users who rely on assistive technology — an estimated 15% of your potential audience. Addressing the critical issues below would have the most immediate impact on your user trust.
11 barrier(s) likely increasing bounce by ~35%.
Page takes 11.9s to load
+12% bounceUsers abandon at ~3s — you're 9.4s over the 2.5s threshold
Fix: Optimize render-blocking resources, preload the hero image, and compress images
Page feels frozen for 2.5s
+5% bounceClicks on the primary CTA are ignored while JavaScript runs
Fix: Break up long tasks; defer non-critical JavaScript to post-hydration
No HSTS header
+1% bounceReturning visitors are briefly exposed to downgrade attacks on first request
Fix: Set Strict-Transport-Security: max-age=31536000; includeSubDomains
No Content-Security-Policy header
+1% bounceHigher XSS blast radius — one compromised script can exfiltrate the checkout form
Fix: Ship a reporting-only CSP first, then enforce once violations are clean
Severe layout shift during page load
+6% bounceUsers mis-click when content jumps — converting intent into frustration
Fix: Reserve space for images, ads, and embeds with explicit width/height
1 form field(s) without a label
+2% bounceScreen readers skip unlabeled fields; autofill can't identify them; checkout abandonment spikes
Fix: Associate every input with a visible <label for="…">; add autocomplete attributes
No Open Graph tags
+2% bounceLinks shared on LinkedIn / Slack / Facebook show bare URLs — referral clicks drop
Fix: Add og:title, og:description, og:image, og:url to the page head
No structured data
+2% bounceNo rich-result eligibility in Google — lower SERP CTR vs competitors with stars and prices
Fix: Add JSON-LD for your page type (Product, Article, FAQPage, LocalBusiness, …)
Thin content
+3% bounceUnder 300 words — visitors bounce looking for substance, search engines rank competitors first
Fix: Add a substantive FAQ, product detail, or case-study section
No skip-to-content link
+1% bounceKeyboard and screen-reader users must tab through the entire header on every page
Fix: Add a visible-on-focus <a href="#main">Skip to content</a> as the first focusable element
1 broken link(s) on the page
+2% bounceClicks land on 404s — trust drops and the session often ends
Fix: Fix or remove the broken destinations surfaced on the Content tab
Preliminary CRO audit — each barrier links to the tab with detailed analysis.
$600 investment → $3,328/month returns + USD 157,500 risk avoided
$600
6h · 5 findings
$3,328 /mo
~$39,938 / year
USD 157,500
if kept compliant
$100 — in quick wins — start here for the fastest payback
Figures combine localized regulatory fine ceilings, search/conversion value priced against local CPC, and bandwidth waste estimates. Results depend on implementation quality and audience composition. Not legal or financial advice.
6.0 developer hours at $100/hr
Based on United States rates ($100/hr)
Start here for the best return on investment
$13,126 / month at risk
~$157,508 / year if left unfixed
$157,500
+2 more
$0.70 /mo
8744.5 MB/mo × 0.080 USD/GB
Compliance figures represent the statutory maximum fine for the most severe triggered category, capped per regulation — not the sum of per-finding penalties. Based on published regulatory fine ranges. This is not legal advice.
Unique monthly visitors from your analytics
Purchases, signups, or key actions
Optional — for revenue estimation
more engaged visitors from reduced bounce
Fix 4 critical issues to capture this value
Based on Google/Deloitte research ("Milliseconds Make Millions") showing a ~7% bounce rate increase per additional second of LCP above the 2.5s "Good" threshold.
Your site's LCP: → estimated after fixes.
These are estimates based on industry research — actual results vary
Your data stays in your browser — nothing is sent to our servers
Thanks for your feedback!
We'll use a cached audit if available, or offer to scan.
Industry-standard audits powered by Google Lighthouse.
Key metrics that affect user experience.
First Contentful Paint First Contentful Paint — how long until the browser renders the first piece of content. Under 1.8s is good.
5.44 s
Largest Contentful Paint Largest Contentful Paint — how long until the largest visible element loads. Under 2.5s is good.
11.94 s
Total Blocking Time Total Blocking Time — total time the main thread was blocked, preventing user input. Under 200ms is good.
2.45 s
Cumulative Layout Shift Cumulative Layout Shift — measures visual stability. How much the page layout shifts during loading. Under 0.1 is good.
0.721
Speed Index Speed Index — how quickly content is visually displayed during load. Under 3.4s is good.
5.44 s
Time to Interactive Time to Interactive — how long until the page is fully interactive and responds to user input. Under 3.8s is good.
19.78 s
Audit breakdown by category with detailed findings.
Remove large, duplicate JavaScript modules from bundles to reduce unnecessary bytes consumed by network activity.
Performance issues directly impact user engagement and conversion rates.
Polyfills and transforms enable older browsers to use new JavaScript features. However, many aren't necessary for modern browsers. Consider modifying your JavaScript build process to not transpile Baseline features, unless you know you must support older browsers. Learn why most sites can deploy ES6+ code without transpiling
Shipping ES5 transpiled code to modern browsers wastes bytes — every user with an evergreen browser pays for compatibility you don't need.
Most users today run browsers that natively support ES6+, async/await, optional chaining, and the rest of modern JavaScript. Transpiling to ES5 'just in case' adds 20-40% to your bundle for no benefit. Configure your build to target a modern browserslist, or ship a differential bundle pair (modern + legacy) with the module/nomodule pattern.
Source: Google web.dev / Lighthouse
3rd party code can significantly impact load performance. Reduce and defer loading of 3rd party code to prioritize your page's content.
Performance issues directly impact user engagement and conversion rates.
Layout shifts occur when elements move absent any user interaction. Investigate the causes of layout shifts, such as elements being added, removed, or their fonts changing as the page loads.
Performance issues directly impact user engagement and conversion rates.
Your first network request is the most important. Reduce its latency by avoiding redirects, ensuring a fast server response, and enabling text compression.
Performance issues directly impact user engagement and conversion rates.
A forced reflow occurs when JavaScript queries geometric properties (such as offsetWidth) after styles have been invalidated by a change to the DOM state. This can result in poor performance. Learn more about forced reflows and possible mitigations.
Performance issues directly impact user engagement and conversion rates.
Reducing the download time of images can improve the perceived load time of the page and LCP. Learn more about optimizing image size
Performance issues directly impact user engagement and conversion rates.
| URL | Resource Size | Est Savings | |
|---|---|---|---|
A user starts typing a file name into the Google Drive search tool, and a list … div.Grid_grid > div.Grid_column > picture > img | /yii01ecysRl3f2TblmxOdGyrw6bVn6RrrSsQ4LuQbvW0YyvfAAgrq3GH... | 444.2 KiB | 391.6 KiB |
Indicating 30 gigabytes of storage used in Google Workspace gws-accordion-item > div.AccordionItem_imageContainer > picture > img | /r5D_bbSaYm9hhy1tcQ9--ySN64I-iKSGlnvv6UWGv6tmvNaRUEgfFT7m... | 78.9 KiB | 29.4 KiB |
video.video video.video | /5lMAXDhPZzGyIPU0HYUjSXgYkRr5FdO03K1i1yrMLTZYBH_G_baeCEfA... | 52.4 KiB | 18.5 KiB |
Avoid chaining critical requests by reducing the length of chains, reducing the download size of resources, or deferring the download of unnecessary resources to improve page load.
Performance issues directly impact user engagement and conversion rates.
Requests are blocking the page's initial render, which may delay LCP. Deferring or inlining can move these network requests out of the critical path.
Performance issues directly impact user engagement and conversion rates.
A long cache lifetime can speed up repeat visits to your page. Learn more about caching.
Performance issues directly impact user engagement and conversion rates.
| Request | Cache TTL | Transfer Size |
|---|---|---|
| ssl.google-analytics.com/ga.js | 7200.0 s | 17.4 KiB |
| /a?v=3&t=l&pid=1606961587&rv=64h1&tag_exp=0~115616986~115... | 0.0 ms | 11 B |
These insights are also available in the Chrome DevTools Performance Panel - record a trace to view more detailed information.
The maximum potential First Input Delay that your users could experience is the duration of the longest task. Learn more about the Maximum Potential First Input Delay metric.
Performance issues directly impact user engagement and conversion rates.
Redirects introduce additional delays before the page can be loaded. Learn how to avoid page redirects.
Performance issues directly impact user engagement and conversion rates.
These are the largest layout shifts observed on the page. Each table item represents a single layout shift, and shows the element that shifted the most. Below each item are possible root causes that led to the layout shift. Some of these layout shifts may not be included in the CLS metric value due to windowing. Learn how to improve CLS
Performance issues directly impact user engagement and conversion rates.
| Element | Layout shift score |
|---|---|
Say goodbye to file silos and content chaos
Move your data and store all of yo… main#main > section#migration > div.TemplateTwoColumn_template > div.Grid_grid | 0.721 |
Time to Interactive is the amount of time it takes for the page to become fully interactive. Learn more about the Time to Interactive metric.
Performance issues directly impact user engagement and conversion rates.
Consider reducing the time spent parsing, compiling, and executing JS. You may find delivering smaller JS payloads helps with this. Learn how to reduce Javascript execution time.
Performance issues directly impact user engagement and conversion rates.
| URL | Total CPU Time | Script Evaluation | Script Parse |
|---|---|---|---|
| workspace.google.com/intl/en-US/products/drive/ | 3.0 s | 30 ms | 12 ms |
| Unattributable | 1.1 s | 65 ms | 0.0 ms |
| workspace.google.com/chunks/C6X1K7VT.min.js | 995 ms | 956 ms | 0.2 ms |
| www.googletagmanager.com/gtm.js?id=GTM-Q4J6 | 667 ms | 565 ms | 70 ms |
| workspace.google.com/chunks/BOtnvvVV.min.js | 415 ms | 341 ms | 0.2 ms |
| www.googletagmanager.com/gtag/js?id=G-FWCBRW1RY8&cx=c>m=4e64h1 | 326 ms | 269 ms | 53 ms |
| www.googletagmanager.com/gtag/destination?id=AW-10836211492&cx=c>m=4e64h1 | 318 ms | 267 ms | 48 ms |
| www.googletagmanager.com/gtag/destination?id=DC-2507573&cx=c>m=4e64h1 | 286 ms | 236 ms | 44 ms |
| workspace.google.com/assets/Dz-Ho5pc.min.js | 250 ms | 16 ms | 0.2 ms |
| workspace.google.com/chunks/DX-UClOw.min.js | 243 ms | 236 ms | 0.1 ms |
| ssl.google-analytics.com/ga.js | 107 ms | 86 ms | 19 ms |
| workspace.google.com/assets/CZtCh9OT.min.js | 102 ms | 0.0 ms | 2.0 ms |
| workspace.google.com/assets/DmMVEAbJ.min.js | 99 ms | 0.0 ms | 0.1 ms |
| workspace.google.com/assets/0DoU6G7H.min.js | 92 ms | 12 ms | 0.2 ms |
| workspace.google.com/chunks/v5v0npB_.min.js | 71 ms | 69 ms | 0.5 ms |
Consider reducing the time spent parsing, compiling and executing JS. You may find delivering smaller JS payloads helps with this. Learn how to minimize main-thread work
Performance issues directly impact user engagement and conversion rates.
| Category | Time Spent |
|---|---|
| Script Evaluation | 3.3 s |
| Style & Layout | 2.9 s |
| Other | 1.4 s |
| Parse HTML & CSS | 303 ms |
| Script Parsing & Compilation | 280 ms |
| Rendering | 264 ms |
| Garbage Collection | 151 ms |
Minifying CSS files can reduce network payload sizes. Learn how to minify CSS.
Performance issues directly impact user engagement and conversion rates.
| URL | Transfer Size | Est Savings |
|---|---|---|
| /css?family=Google+Sans:400|Google+Sans+Text:700|Roboto:7... | 26.2 KiB | 2.8 KiB |
Reduce unused rules from stylesheets and defer CSS not used for above-the-fold content to decrease bytes consumed by network activity. Learn how to reduce unused CSS.
Performance issues directly impact user engagement and conversion rates.
| URL | Transfer Size | Est Savings |
|---|---|---|
| /css?family=Google+Sans:400|Google+Sans+Text:700|Roboto:7... | 26.1 KiB | 26.1 KiB |
| workspace.google.com/assets/Bctcio4i.css | 34.4 KiB | 15.8 KiB |
Reduce unused JavaScript and defer loading scripts until they are required to decrease bytes consumed by network activity. Learn how to reduce unused JavaScript.
Multi-megabyte JavaScript bundles delay every interactive feature on the page.
This is the Lighthouse audit fired when too much JS is shipped relative to what executes. The fix isn't a config flag — it requires bundle analysis (webpack-bundle-analyzer, rollup-plugin-visualizer), splitting routes into chunks, lazy-loading off-screen components, and removing unused dependencies. Fundamentally different from minification: minifying reduces byte count, this reduces what's downloaded at all.
Source: Google web.dev / Lighthouse
| URL | Transfer Size | Est Savings |
|---|---|---|
| www.googletagmanager.com/gtag/destination?id=AW-10836211492&cx=c>m=4e64h1 | 146.1 KiB | 62.8 KiB |
| www.googletagmanager.com/gtag/js?id=G-FWCBRW1RY8&cx=c>m=4e64h1 | 151.3 KiB | 61.7 KiB |
| www.googletagmanager.com/gtag/destination?id=DC-2507573&cx=c>m=4e64h1 | 131.7 KiB | 61.5 KiB |
| www.googletagmanager.com/gtm.js?id=GTM-Q4J6 | 170.3 KiB | 55.3 KiB |
Large network payloads cost users real money and are highly correlated with long load times. Learn how to reduce payload sizes.
Performance issues directly impact user engagement and conversion rates.
More information about the performance of your application. These numbers don't directly affect the Performance score.
These checks highlight opportunities to improve the accessibility of your web app. Automatic detection can only detect a subset of issues and does not guarantee the accessibility of your web app, so manual testing is also encouraged.
When a button doesn't have an accessible name, screen readers announce it as "button", making it unusable for users who rely on screen readers. Learn how to make buttons more accessible.
Performance issues directly impact user engagement and conversion rates.
| Failing Elements |
|---|
div.container > div.carousel__pagination > button.controls__dots__dot div.container > div.carousel__pagination > button.controls__dots__dot |
div.container > div.carousel__pagination > button.controls__dots__dot div.container > div.carousel__pagination > button.controls__dots__dot |
div.container > div.carousel__pagination > button.controls__dots__dot div.container > div.carousel__pagination > button.controls__dots__dot |
These are opportunities to improve the semantics of the controls in your application. This may enhance the experience for users of assistive technology, like a screen reader.
Visible text labels that do not match the accessible name can result in a confusing experience for screen reader users. Learn more about accessible names.
Performance issues directly impact user engagement and conversion rates.
| Failing Elements |
|---|
Try Drive for work gws-header > gws-action-bar > span.gws-button > a.button |
Try Drive for work div.Text_container > div.ButtonGroup_buttonGroup > span.gws-button > a.button |
Open Tooltip: This feature is available on some Google Workspace Business and E… aside.container > button.trigger |
Open Tooltip: This feature is available on some Google Workspace Business and E… aside.container > button.trigger |
Try Drive for work div.Text_container > div.ButtonGroup_buttonGroup > span.gws-button > a.button |
Change Language div.footer__nav__help > div.footer__nav__language__selector > div.language-selector > button.language-selector__toggle |
These checks ensure that your page is following basic search engine optimization advice. There are many additional factors Lighthouse does not score here that may affect your search ranking, including performance on Core Web Vitals. Learn more about Google Search Essentials.
Descriptive link text helps search engines understand your content. Learn how to make links more accessible.
Performance issues directly impact user engagement and conversion rates.
| Link destination | Link Text |
|---|---|
| workspace.google.com/resources/ | See more |
| workspace.google.com/resources/ | See more |
| workspace.google.com/resources/ | See more |
| workspace.google.com/resources/ | See more |
| workspace.google.com/resources/ | See more |
| workspace.google.com/resources/ | See more |
| workspace.google.com/solutions/migration/drive-migration/ | Learn more |
| workspace.google.com/customers/blueoxfilms/ | Learn more |
| /blog/customer-stories/roche-protects-files-ai-classifica... | Learn more |
| workspace.google.com/customers/mmp/ | Learn more |
Format your HTML in a way that enables crawlers to better understand your app’s content.
Industry-standard audits powered by Google Lighthouse. — Desktop
Key metrics that affect user experience. — Desktop
First Contentful Paint First Contentful Paint — how long until the browser renders the first piece of content. Under 1.8s is good.
1.49 s
Largest Contentful Paint Largest Contentful Paint — how long until the largest visible element loads. Under 2.5s is good.
2.55 s
Total Blocking Time Total Blocking Time — total time the main thread was blocked, preventing user input. Under 200ms is good.
416 ms
Cumulative Layout Shift Cumulative Layout Shift — measures visual stability. How much the page layout shifts during loading. Under 0.1 is good.
1.261
Speed Index Speed Index — how quickly content is visually displayed during load. Under 3.4s is good.
1.65 s
Time to Interactive Time to Interactive — how long until the page is fully interactive and responds to user input. Under 3.8s is good.
4.23 s
Audit breakdown by category with detailed findings.
Remove large, duplicate JavaScript modules from bundles to reduce unnecessary bytes consumed by network activity.
Performance issues directly impact user engagement and conversion rates.
Polyfills and transforms enable older browsers to use new JavaScript features. However, many aren't necessary for modern browsers. Consider modifying your JavaScript build process to not transpile Baseline features, unless you know you must support older browsers. Learn why most sites can deploy ES6+ code without transpiling
Shipping ES5 transpiled code to modern browsers wastes bytes — every user with an evergreen browser pays for compatibility you don't need.
Most users today run browsers that natively support ES6+, async/await, optional chaining, and the rest of modern JavaScript. Transpiling to ES5 'just in case' adds 20-40% to your bundle for no benefit. Configure your build to target a modern browserslist, or ship a differential bundle pair (modern + legacy) with the module/nomodule pattern.
Source: Google web.dev / Lighthouse
3rd party code can significantly impact load performance. Reduce and defer loading of 3rd party code to prioritize your page's content.
Performance issues directly impact user engagement and conversion rates.
Layout shifts occur when elements move absent any user interaction. Investigate the causes of layout shifts, such as elements being added, removed, or their fonts changing as the page loads.
Performance issues directly impact user engagement and conversion rates.
Your first network request is the most important. Reduce its latency by avoiding redirects, ensuring a fast server response, and enabling text compression.
Performance issues directly impact user engagement and conversion rates.
A forced reflow occurs when JavaScript queries geometric properties (such as offsetWidth) after styles have been invalidated by a change to the DOM state. This can result in poor performance. Learn more about forced reflows and possible mitigations.
Performance issues directly impact user engagement and conversion rates.
Reducing the download time of images can improve the perceived load time of the page and LCP. Learn more about optimizing image size
Performance issues directly impact user engagement and conversion rates.
| URL | Resource Size | Est Savings | |
|---|---|---|---|
A user starts typing a file name into the Google Drive search tool, and a list … div.Grid_grid > div.Grid_column > picture > img | /RXWK2_qSKjSclzxy44kcOLqjzMe84F4h7fPxkuUMg8-g-n7ELc7u5TNk... | 444.2 KiB | 395.6 KiB |
video.video video.video | /o4wxafHy28RsP2VVOv2ZnCJPmZe22lRRv57Eay90LpKawkKZ-S6vsRoh... | 297.8 KiB | 259.2 KiB |
Indicating 30 gigabytes of storage used in Google Workspace div.Template5050Accordion_column > div > picture > img.Template5050Accordion_laptopImage | /Y8GJzDqsy5HVJ39EnNZWyn3NLqG9Q2fXXUZenaapj7MNjKdBm1YbbElz... | 92.6 KiB | 36.9 KiB |
Avoid chaining critical requests by reducing the length of chains, reducing the download size of resources, or deferring the download of unnecessary resources to improve page load.
Performance issues directly impact user engagement and conversion rates.
Requests are blocking the page's initial render, which may delay LCP. Deferring or inlining can move these network requests out of the critical path.
Performance issues directly impact user engagement and conversion rates.
A long cache lifetime can speed up repeat visits to your page. Learn more about caching.
Performance issues directly impact user engagement and conversion rates.
| Request | Cache TTL | Transfer Size |
|---|---|---|
| ssl.google-analytics.com/ga.js | 7200.0 s | 17.4 KiB |
These insights are also available in the Chrome DevTools Performance Panel - record a trace to view more detailed information.
Redirects introduce additional delays before the page can be loaded. Learn how to avoid page redirects.
Performance issues directly impact user engagement and conversion rates.
These are the largest layout shifts observed on the page. Each table item represents a single layout shift, and shows the element that shifted the most. Below each item are possible root causes that led to the layout shift. Some of these layout shifts may not be included in the CLS metric value due to windowing. Learn how to improve CLS
Performance issues directly impact user engagement and conversion rates.
| Element | Layout shift score |
|---|---|
Store and share files online
AI-powered, secure cloud storage for seamless fil… body.page--scroll-tracked > div#root > main#main | 0.932 |
Say goodbye to file silos and content chaos
Move your data and store all of yo… main#main > section#migration > div.TemplateTwoColumn_template > div.Grid_grid | 0.325 |
Make smarter decisions with Gemini in Drive
Gain valuable insights by summariz… div.TemplateTwoColumn_template > div.Grid_grid > div.Grid_column > div | 0.001 |
Hi there 👋 What brings you to Google Workspace today? body.page--scroll-tracked > div#container > div.message-container | 0.001 |
Hi there 👋 What brings you to Google Workspace today? body.page--scroll-tracked > div#container > div.message-container | 0.000 |
Hi there 👋 What brings you to Google Workspace today? body.page--scroll-tracked > div#container > div.message-container | 0.000 |
Hi there 👋 What brings you to Google Workspace today? body.page--scroll-tracked > div#container > div.message-container | 0.000 |
Hi there 👋 What brings you to Google Workspace today? body.page--scroll-tracked > div#container > div.message-container | 0.000 |
Hi there 👋 What brings you to Google Workspace today? body.page--scroll-tracked > div#container > div.message-container | 0.000 |
Hi there 👋 What brings you to Google Workspace today? body.page--scroll-tracked > div#container > div.message-container | 0.000 |
Hi there 👋 What brings you to Google Workspace today? body.page--scroll-tracked > div#container > div.message-container | 0.000 |
Hi there 👋 What brings you to Google Workspace today? body.page--scroll-tracked > div#container > div.message-container | 0.000 |
The maximum potential First Input Delay that your users could experience is the duration of the longest task. Learn more about the Maximum Potential First Input Delay metric.
Performance issues directly impact user engagement and conversion rates.
Time to Interactive is the amount of time it takes for the page to become fully interactive. Learn more about the Time to Interactive metric.
Performance issues directly impact user engagement and conversion rates.
Consider reducing the time spent parsing, compiling and executing JS. You may find delivering smaller JS payloads helps with this. Learn how to minimize main-thread work
Performance issues directly impact user engagement and conversion rates.
| Category | Time Spent |
|---|---|
| Script Evaluation | 826 ms |
| Style & Layout | 759 ms |
| Other | 378 ms |
| Parse HTML & CSS | 79 ms |
| Rendering | 71 ms |
| Script Parsing & Compilation | 70 ms |
| Garbage Collection | 33 ms |
Minifying CSS files can reduce network payload sizes. Learn how to minify CSS.
Performance issues directly impact user engagement and conversion rates.
| URL | Transfer Size | Est Savings |
|---|---|---|
| /css?family=Google+Sans:400|Google+Sans+Text:700|Roboto:7... | 26.1 KiB | 2.8 KiB |
Reduce unused rules from stylesheets and defer CSS not used for above-the-fold content to decrease bytes consumed by network activity. Learn how to reduce unused CSS.
Performance issues directly impact user engagement and conversion rates.
| URL | Transfer Size | Est Savings |
|---|---|---|
| /css?family=Google+Sans:400|Google+Sans+Text:700|Roboto:7... | 26.1 KiB | 26.1 KiB |
Reduce unused JavaScript and defer loading scripts until they are required to decrease bytes consumed by network activity. Learn how to reduce unused JavaScript.
Multi-megabyte JavaScript bundles delay every interactive feature on the page.
This is the Lighthouse audit fired when too much JS is shipped relative to what executes. The fix isn't a config flag — it requires bundle analysis (webpack-bundle-analyzer, rollup-plugin-visualizer), splitting routes into chunks, lazy-loading off-screen components, and removing unused dependencies. Fundamentally different from minification: minifying reduces byte count, this reduces what's downloaded at all.
Source: Google web.dev / Lighthouse
| URL | Transfer Size | Est Savings |
|---|---|---|
| www.googletagmanager.com/gtag/destination?id=AW-10836211492&cx=c>m=4e64h1h1 | 146.1 KiB | 62.6 KiB |
| www.googletagmanager.com/gtag/destination?id=DC-2507573&cx=c>m=4e64h1h1 | 131.7 KiB | 61.5 KiB |
| www.googletagmanager.com/gtag/js?id=G-FWCBRW1RY8&cx=c>m=4e64h1h1 | 151.3 KiB | 61.3 KiB |
| www.googletagmanager.com/gtm.js?id=GTM-Q4J6 | 123.9 KiB | 41.2 KiB |
Large network payloads cost users real money and are highly correlated with long load times. Learn how to reduce payload sizes.
Performance issues directly impact user engagement and conversion rates.
More information about the performance of your application. These numbers don't directly affect the Performance score.
These checks highlight opportunities to improve the accessibility of your web app. Automatic detection can only detect a subset of issues and does not guarantee the accessibility of your web app, so manual testing is also encouraged.
Some ARIA child roles must be contained by specific parent roles to properly perform their intended accessibility functions. Learn more about ARIA roles and required parent element.
Performance issues directly impact user engagement and conversion rates.
| Failing Elements |
|---|
Gemini in Drive gws-jumplinks.TemplateJumplinks_jumplinks > div.TemplateJumplinks_links > div.Text_container > a.TemplateJumplinks_link |
Store gws-jumplinks.TemplateJumplinks_jumplinks > div.TemplateJumplinks_links > div.Text_container > a.TemplateJumplinks_link |
Manage gws-jumplinks.TemplateJumplinks_jumplinks > div.TemplateJumplinks_links > div.Text_container > a.TemplateJumplinks_link |
Collaborate gws-jumplinks.TemplateJumplinks_jumplinks > div.TemplateJumplinks_links > div.Text_container > a.TemplateJumplinks_link |
Security gws-jumplinks.TemplateJumplinks_jumplinks > div.TemplateJumplinks_links > div.Text_container > a.TemplateJumplinks_link |
Download gws-jumplinks.TemplateJumplinks_jumplinks > div.TemplateJumplinks_links > div.Text_container > a.TemplateJumplinks_link |
Customers gws-jumplinks.TemplateJumplinks_jumplinks > div.TemplateJumplinks_links > div.Text_container > a.TemplateJumplinks_link |
FAQs gws-jumplinks.TemplateJumplinks_jumplinks > div.TemplateJumplinks_links > div.Text_container > a.TemplateJumplinks_link |
These are opportunities to improve the usage of ARIA in your application which may enhance the experience for users of assistive technology, like a screen reader.
When a button doesn't have an accessible name, screen readers announce it as "button", making it unusable for users who rely on screen readers. Learn how to make buttons more accessible.
Performance issues directly impact user engagement and conversion rates.
| Failing Elements |
|---|
div.container > div.carousel__pagination > button.controls__dots__dot div.container > div.carousel__pagination > button.controls__dots__dot |
div.container > div.carousel__pagination > button.controls__dots__dot div.container > div.carousel__pagination > button.controls__dots__dot |
div.container > div.carousel__pagination > button.controls__dots__dot div.container > div.carousel__pagination > button.controls__dots__dot |
body.page--scroll-tracked > div#container > div#cloud-chatbot-container > button#cloud-chatbot-chat-activate-bar-desktop body.page--scroll-tracked > div#container > div#cloud-chatbot-container > button#cloud-chatbot-chat-activate-bar-desktop |
These are opportunities to improve the semantics of the controls in your application. This may enhance the experience for users of assistive technology, like a screen reader.
Screen readers have a specific way of announcing lists. Ensuring proper list structure aids screen reader output. Learn more about proper list structure.
Performance issues directly impact user engagement and conversion rates.
| Failing Elements |
|---|
Included applications
Gmail
Meet
Chat
Calendar
Drive
Docs
Sheets
Slides
Forms
S… div.TemplateFooter_footer > div.TemplateFooter_footer__content > div.TemplateFooter_footer__sitemap > ul.TemplateFooter_footer__sitemap__column |
Included applications
Gmail
Meet
Chat
Calendar
Drive
Docs
Sheets
Slides
Forms
S… div.TemplateFooter_footer__content > div.TemplateFooter_footer__sitemap > ul.TemplateFooter_footer__sitemap__column > ul.TemplateFooter_footer__sitemap__column |
Security and management
Admin
Endpoint
Vault
Work Insights
Solutions
New Busine… div.TemplateFooter_footer > div.TemplateFooter_footer__content > div.TemplateFooter_footer__sitemap > ul.TemplateFooter_footer__sitemap__column |
Security and management
Admin
Endpoint
Vault
Work Insights div.TemplateFooter_footer__content > div.TemplateFooter_footer__sitemap > ul.TemplateFooter_footer__sitemap__column > ul.TemplateFooter_footer__sitemap__column |
Solutions
New Business
Small Business
Enterprise
Retail
Manufacturing
Professio… div.TemplateFooter_footer__content > div.TemplateFooter_footer__sitemap > ul.TemplateFooter_footer__sitemap__column > ul.TemplateFooter_footer__sitemap__column |
Pricing
Compare pricing plans
Add-ons
Meet hardware
Google Voice
AppSheet div.TemplateFooter_footer > div.TemplateFooter_footer__content > div.TemplateFooter_footer__sitemap > ul.TemplateFooter_footer__sitemap__column |
Pricing
Compare pricing plans div.TemplateFooter_footer__content > div.TemplateFooter_footer__sitemap > ul.TemplateFooter_footer__sitemap__column > ul.TemplateFooter_footer__sitemap__column |
Add-ons
Meet hardware
Google Voice
AppSheet div.TemplateFooter_footer__content > div.TemplateFooter_footer__sitemap > ul.TemplateFooter_footer__sitemap__column > ul.TemplateFooter_footer__sitemap__column |
Resources
Working remotely
Security
Customer Stories
FAQs
Partners
Marketplace
… div.TemplateFooter_footer > div.TemplateFooter_footer__content > div.TemplateFooter_footer__sitemap > ul.TemplateFooter_footer__sitemap__column |
Resources
Working remotely
Security
Customer Stories
FAQs
Partners
Marketplace
… div.TemplateFooter_footer__content > div.TemplateFooter_footer__sitemap > ul.TemplateFooter_footer__sitemap__column > ul.TemplateFooter_footer__sitemap__column |
Learning and support
Admin Help
Setup and Deployment Center
Learning Center for… div.TemplateFooter_footer > div.TemplateFooter_footer__content > div.TemplateFooter_footer__sitemap > ul.TemplateFooter_footer__sitemap__column |
Learning and support
Admin Help
Setup and Deployment Center
Learning Center for… div.TemplateFooter_footer__content > div.TemplateFooter_footer__sitemap > ul.TemplateFooter_footer__sitemap__column > ul.TemplateFooter_footer__sitemap__column |
More from Google
Google Cloud
Google Domains
Chrome Enterprise
Google Business … div.TemplateFooter_footer__content > div.TemplateFooter_footer__sitemap > ul.TemplateFooter_footer__sitemap__column > ul.TemplateFooter_footer__sitemap__column |
These are opportunities to improve the experience of reading tabular or list data using assistive technology, like a screen reader.
Visible text labels that do not match the accessible name can result in a confusing experience for screen reader users. Learn more about accessible names.
Performance issues directly impact user engagement and conversion rates.
| Failing Elements |
|---|
Try Drive for work div.TemplateHeader_headerContent > div.TemplateHeader_headerAside > span.gws-button > a.button |
Try Drive for work div.Text_container > div.ButtonGroup_buttonGroup > span.gws-button > a.button |
Open Tooltip: This feature is available on some Google Workspace Business and E… aside.container > button.trigger |
Open Tooltip: This feature is available on some Google Workspace Business and E… aside.container > button.trigger |
Try Drive for work div.Text_container > div.ButtonGroup_buttonGroup > span.gws-button > a.button |
Change Language div.footer__nav__help > div.footer__nav__language__selector > div.language-selector > button.language-selector__toggle |
Image display dimensions should match natural aspect ratio. Learn more about image aspect ratio.
Performance issues directly impact user engagement and conversion rates.
| URL | Aspect Ratio (Displayed) | Aspect Ratio (Actual) | |
|---|---|---|---|
Indicating 30 gigabytes of storage used in Google Workspace gws-accordion-item > div.AccordionItem_imageContainer > picture > img | /Y8GJzDqsy5HVJ39EnNZWyn3NLqG9Q2fXXUZenaapj7MNjKdBm1YbbElz... | 608 x 500 (1.22) | 684 x 500 (1.37) |
Attaching a pdf invoice from Drive directly to an email in Gmail gws-accordion-item > div.AccordionItem_imageContainer > picture > img | /yaeFI4_QssNg_y1mJBNSYykolRzqvAsy-bUy5nSJ57YJZNJMssOMEML0... | 608 x 500 (1.22) | 684 x 500 (1.37) |
Scanning a pdf grocery bill with a phone into Drive gws-accordion-item > div.AccordionItem_imageContainer > picture > img | /Dy2FGFkccm77gzVvrnl2wl8mDJ2T1MadpzdgRLhiXcX0nYgsriVe4mbd... | 608 x 500 (1.22) | 684 x 500 (1.37) |
Errors logged to the console indicate unresolved problems. They can come from network request failures and other browser concerns. Learn more about this errors in console diagnostic audit
Performance issues directly impact user engagement and conversion rates.
| Source | Description |
|---|---|
AbortError: The play() request was interrupted by a call to pause(). https://goo.gl/LdLk22 |
These checks ensure that your page is following basic search engine optimization advice. There are many additional factors Lighthouse does not score here that may affect your search ranking, including performance on Core Web Vitals. Learn more about Google Search Essentials.
Descriptive link text helps search engines understand your content. Learn how to make links more accessible.
Performance issues directly impact user engagement and conversion rates.
| Link destination | Link Text |
|---|---|
| workspace.google.com/resources/ | See more |
| workspace.google.com/resources/ | See more |
| workspace.google.com/resources/ | See more |
| workspace.google.com/resources/ | See more |
| workspace.google.com/resources/ | See more |
| workspace.google.com/solutions/migration/drive-migration/ | Learn more |
| workspace.google.com/customers/blueoxfilms/ | Learn more |
| /blog/customer-stories/roche-protects-files-ai-classifica... | Learn more |
| workspace.google.com/customers/mmp/ | Learn more |
Format your HTML in a way that enables crawlers to better understand your app’s content.
Send Feedback