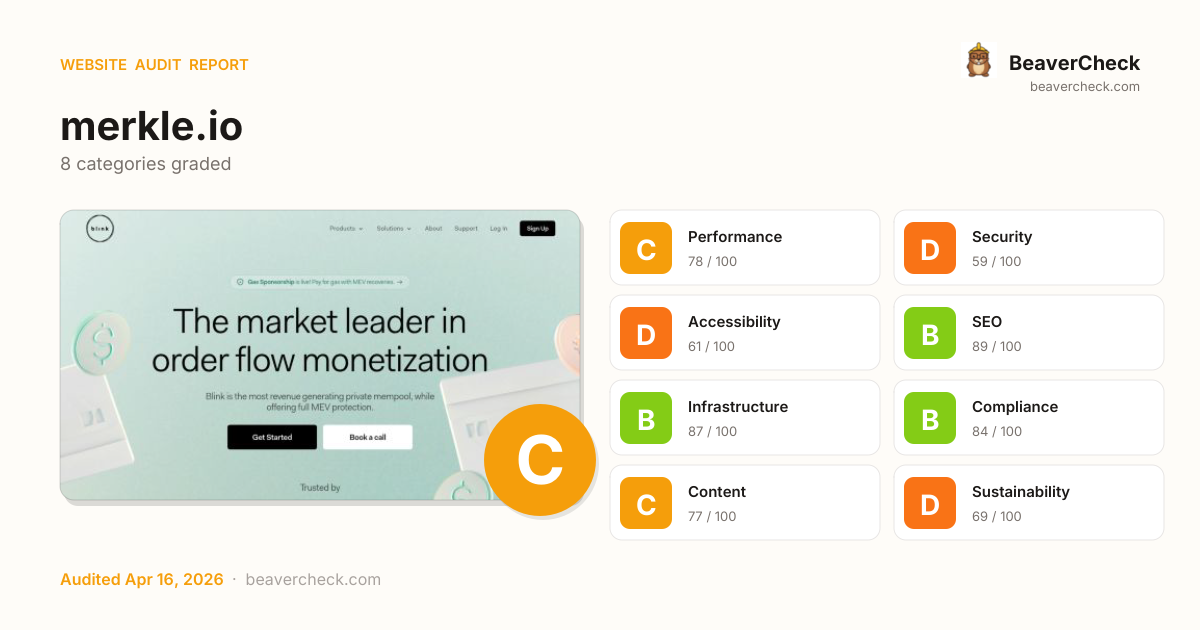
Skip to content
Audit Complete

Results for https://merkle.io

Visit site
Spain Spain · Madrid Completed: Apr 16, 2026 17:33 UTC
Download JSON Download Markdown Report

Mobile 375 × 812

Screenshot of the audited page (Mobile 375×812)

Desktop 1440 × 900

Screenshot of the audited page (Desktop 1440×900)
C73

Site Health

Score: 73 / 100

Based on 8 categories, 0 sections

Decent speed, but optimizing further could improve engagement.

Several missing protections leave your users and data exposed.

Several issues make your site difficult for assistive technology users.

Well-optimized for search — your content is discoverable.

Solid infrastructure — fast server responses across the board.

Mostly compliant — a few items need attention.

Good content signals with minor gaps.

Heavier than average — reducing page weight saves energy and bandwidth.

How is this calculated?

The overall score is a weighted average of individual category scores. Categories with more impact on user experience and security carry more weight.

Performance 25%Security 25%Accessibility 15%SEO 10%Infrastructure 10%Compliance 8%Content 5%Sustainability 2%

Weights reflect general web best practices. Individual needs may differ.

How the composite score is calculated

How you compare

Framer Motion sites average 74
At average
Better than 27% of Framer Motion sites See full Framer Motion benchmark →
Google Search Console sites average 73
At average
Better than 43% of Google Search Console sites See full Google Search Console benchmark →

Top Priorities (5)

1

Content-Security-Policy header is missing

Security gaps expose your site and users to attacks, eroding trust.

Security › Security Headers
2

HSTS header is missing

Security gaps expose your site and users to attacks, eroding trust.

Security › Security Headers
3

No Content-Security-Policy header found

Security gaps expose your site and users to attacks, eroding trust.

Security › Content Security Policy
4

Page weighs 13.2 MB (12.2 MB transferred)

Performance issues directly impact user engagement and conversion rates.

Performance › Page Weight Budget
5

Soft 404: server returns HTTP 200 for non-existent pages

Accessibility issues exclude users with disabilities — up to 15% of your potential audience.

Accessibility › 404 Error Page
View fix priority matrix

Fix Priority Matrix

5 findings

Quick Wins

3

High impact, low effort — start here.

Strategic

2

High impact, requires investment.

Easy Improvements

0

Small gains, minimal effort.

Nothing in this quadrant — good news.

Deprioritize

0

Low impact, high effort — do last.

Nothing in this quadrant — good news.

← Low effort High effort →
BeaverCheck badge
Embed this badge
[![BeaverCheck](https://beavercheck.com/badge?url=https%3A%2F%2Fmerkle.io)](https://beavercheck.com/results/40dab32f-a779-4fb5-b0ea-42166913c8da)
<a href="https://beavercheck.com/results/40dab32f-a779-4fb5-b0ea-42166913c8da"><img src="https://beavercheck.com/badge?url=https%3A%2F%2Fmerkle.io" alt="BeaverCheck Score"></a>
https://beavercheck.com/badge?url=https%3A%2F%2Fmerkle.io

This badge auto-updates with your latest scan result.

What fixing these means

Your site performs reasonably well, but a few targeted fixes could meaningfully improve results. Your LCP of 9.8s exceeds Google's 2.5s 'Good' threshold and the 1 performance issue below directly contributes to it. The 3 security gaps leave your users exposed — modern browsers increasingly warn visitors about insecure sites. Addressing the critical issues below would have the most immediate impact on your user trust.

3 security gaps detected — browsers may warn visitors about your site.
Your LCP is 9.8s — fixing the 1 performance critical could bring it under Google's 2.5s 'Good' threshold.
1 accessibility issue excludes users who rely on assistive technology.

Conversion Barriers

2 critical 4 warning

6 barrier(s) likely increasing bounce by ~26%.

Speed (1)

Page takes 9.8s to load

+12% bounce

Users abandon at ~3s — you're 7.3s over the 2.5s threshold

Fix: Optimize render-blocking resources, preload the hero image, and compress images

Trust (2)

No HSTS header

+1% bounce

Returning visitors are briefly exposed to downgrade attacks on first request

Fix: Set Strict-Transport-Security: max-age=31536000; includeSubDomains

No Content-Security-Policy header

+1% bounce

Higher XSS blast radius — one compromised script can exfiltrate the checkout form

Fix: Ship a reporting-only CSP first, then enforce once violations are clean

Content (1)

No structured data

+2% bounce

No rich-result eligibility in Google — lower SERP CTR vs competitors with stars and prices

Fix: Add JSON-LD for your page type (Product, Article, FAQPage, LocalBusiness, …)

Navigation (2)

No skip-to-content link

+1% bounce

Keyboard and screen-reader users must tab through the entire header on every page

Fix: Add a visible-on-focus <a href="#main">Skip to content</a> as the first focusable element

9 broken link(s) on the page

+5% bounce

Clicks land on 404s — trust drops and the session often ends

Fix: Fix or remove the broken destinations surfaced on the Content tab

Preliminary CRO audit — each barrier links to the tab with detailed analysis.

Return on Investment

€425 investment → €4,739/month returns + EUR 500,000 risk avoided

Payback period: < 1 month First-year ROI: +13280%

Investment

€425

5h · 5 findings

Monthly returns

€4,739 /mo

~€56,864 / year

  • Conversions recovered €4,736
  • Bandwidth savings €2.84

Regulatory risk avoided

EUR 500,000

if kept compliant

  • EAA EUR 500,000

Payback period

0 12mo 24mo

€128 — in quick wins — start here for the fastest payback

Figures combine localized regulatory fine ceilings, search/conversion value priced against local CPC, and bandwidth waste estimates. Results depend on implementation quality and audience composition. Not legal or financial advice.

Full methodology & sources

Estimated Remediation Cost

€425

5.0 developer hours at €85/hr

Based on European Union rates (€85/hr)

Quick wins
€128 3 fixes in ~90 minutes

Start here for the best return on investment

Cost by category

Cost by effort level

Adjust assumptions
/hr

Rates reflect fully-loaded developer cost including overhead

How developer rates are sourced

What Inaction Is Costing You

€41,670 / month at risk

~€500,034 / year if left unfixed

Compliance Risk

€500,000

EAA
  • 1 of 2 <nav> elements are unlabeled
    EAA: EUR 1,000 – EUR 500,000
  • Skip navigation link is missing (WCAG 2.4.1)
    EAA: EUR 1,000 – EUR 500,000

Bandwidth Waste

€2.84 /mo

38305.7 MB/mo × 0.074 EUR/GB

  • Optimize transfer: save ~3.8 MB per page load
    Saves €2.84/mo

Compliance figures represent the statutory maximum fine for the most severe triggered category, capped per regulation — not the sum of per-finding penalties. Based on published regulatory fine ranges. This is not legal advice.

Compliance methodology · SEO assumptions · Bandwidth model

Your performance is already good — improvements may show diminishing returns

Unique monthly visitors from your analytics

Purchases, signups, or key actions

Optional — for revenue estimation

additional conversions/month

more engaged visitors from reduced bounce

potential monthly revenue
Current bounce (est.)
After fixes (est.)
Estimated bounce reduction

Fix 5 critical issues to capture this value

How this is calculated

Based on Google/Deloitte research ("Milliseconds Make Millions") showing a ~7% bounce rate increase per additional second of LCP above the 2.5s "Good" threshold.

Your site's LCP: → estimated after fixes.

These are estimates based on industry research — actual results vary

Bounce-rate model & assumptions

Your data stays in your browser — nothing is sent to our servers

Was this report useful?

Thanks for your feedback!

We'll use a cached audit if available, or offer to scan.

Checking for existing audit...

Lighthouse Scores

Industry-standard audits powered by Google Lighthouse.

67
Performance Overall performance score (0–100) based on Core Web Vitals and other metrics. 90+ is good.
95
Accessibility Measures how accessible the page is for users with disabilities. Checks color contrast, ARIA labels, and semantic HTML.
100
Best Practices Checks for modern web development best practices including HTTPS, no console errors, and secure JavaScript.
100
SEO Measures basic SEO optimizations: meta tags, crawlability, link text, and mobile friendliness.

Core Web Vitals

Key metrics that affect user experience.

First Contentful Paint First Contentful Paint — how long until the browser renders the first piece of content. Under 1.8s is good.

3.36 s

Largest Contentful Paint Largest Contentful Paint — how long until the largest visible element loads. Under 2.5s is good.

9.76 s

Total Blocking Time Total Blocking Time — total time the main thread was blocked, preventing user input. Under 200ms is good.

74 ms

Cumulative Layout Shift Cumulative Layout Shift — measures visual stability. How much the page layout shifts during loading. Under 0.1 is good.

0.041

Speed Index Speed Index — how quickly content is visually displayed during load. Under 3.4s is good.

3.36 s

Time to Interactive Time to Interactive — how long until the page is fully interactive and responds to user input. Under 3.8s is good.

10.28 s

Detailed Report

Audit breakdown by category with detailed findings.

67

Performance

Insights

Remove large, duplicate JavaScript modules from bundles to reduce unnecessary bytes consumed by network activity.

Why this matters

Performance issues directly impact user engagement and conversion rates.

Polyfills and transforms enable older browsers to use new JavaScript features. However, many aren't necessary for modern browsers. Consider modifying your JavaScript build process to not transpile Baseline features, unless you know you must support older browsers. Learn why most sites can deploy ES6+ code without transpiling

Why this matters

Shipping ES5 transpiled code to modern browsers wastes bytes — every user with an evergreen browser pays for compatibility you don't need.

Learn more

Most users today run browsers that natively support ES6+, async/await, optional chaining, and the rest of modern JavaScript. Transpiling to ES5 'just in case' adds 20-40% to your bundle for no benefit. Configure your build to target a modern browserslist, or ship a differential bundle pair (modern + legacy) with the module/nomodule pattern.

Source: Google web.dev / Lighthouse

3rd party code can significantly impact load performance. Reduce and defer loading of 3rd party code to prioritize your page's content.

Why this matters

Performance issues directly impact user engagement and conversion rates.

Your first network request is the most important. Reduce its latency by avoiding redirects, ensuring a fast server response, and enabling text compression.

Why this matters

Performance issues directly impact user engagement and conversion rates.

Consider setting font-display to swap or optional to ensure text is consistently visible. swap can be further optimized to mitigate layout shifts with font metric overrides.

Why this matters

Performance issues directly impact user engagement and conversion rates.

A forced reflow occurs when JavaScript queries geometric properties (such as offsetWidth) after styles have been invalidated by a change to the DOM state. This can result in poor performance. Learn more about forced reflows and possible mitigations.

Why this matters

Performance issues directly impact user engagement and conversion rates.

headings: [map[key:source label:Source valueType:source-location] map[granularity:1 key:reflowTime label:Total reflow time valueType:ms]]
items: [map[reflowTime:42.8 source:map[type:text value:[unattributed]]]]

Avoid chaining critical requests by reducing the length of chains, reducing the download size of resources, or deferring the download of unnecessary resources to improve page load.

Why this matters

Performance issues directly impact user engagement and conversion rates.

description: [preconnect](https://developer.chrome.com/docs/lighthouse/performance/uses-rel-preconnect/) hints help the browser establish a connection earlier in the page load, saving time when the first request for that origin is made. The following are the origins that the page preconnected to.
title: Preconnected origins
value: no origins were preconnected
description: Add [preconnect](https://developer.chrome.com/docs/lighthouse/performance/uses-rel-preconnect/) hints to your most important origins, but try to use no more than 4.
title: Preconnect candidates
value: No additional origins are good candidates for preconnecting

Reducing the download time of images can improve the perceived load time of the page and LCP. Learn more about optimizing image size

Why this matters

Performance issues directly impact user engagement and conversion rates.

URLResource SizeEst Savings
body.font-sans > main.relative > section.relative > div.absolute body.font-sans > main.relative > section.relative > div.absolute
blinklabs.xyz/images/peach-gradient.png2.0 MiB1.8 MiB
body.font-sans > main.relative > div.relative > div.absolute body.font-sans > main.relative > div.relative > div.absolute
blinklabs.xyz/images/lake-gradient.png1.7 MiB1.5 MiB

Requests are blocking the page's initial render, which may delay LCP. Deferring or inlining can move these network requests out of the critical path.

Why this matters

Performance issues directly impact user engagement and conversion rates.

These insights are also available in the Chrome DevTools Performance Panel - record a trace to view more detailed information.

Redirects introduce additional delays before the page can be loaded. Learn how to avoid page redirects.

Why this matters

Performance issues directly impact user engagement and conversion rates.

Estimated savings: 1.6 s
URLTime Spent
merkle.io/780 ms
www.merkle.io/805 ms
blinklabs.xyz/0.0 ms

Time to Interactive is the amount of time it takes for the page to become fully interactive. Learn more about the Time to Interactive metric.

Why this matters

Performance issues directly impact user engagement and conversion rates.

TTI

The maximum potential First Input Delay that your users could experience is the duration of the longest task. Learn more about the Maximum Potential First Input Delay metric.

Why this matters

Performance issues directly impact user engagement and conversion rates.

Diagnostics

Reduce unused JavaScript and defer loading scripts until they are required to decrease bytes consumed by network activity. Learn how to reduce unused JavaScript.

Why this matters

Multi-megabyte JavaScript bundles delay every interactive feature on the page.

Learn more

This is the Lighthouse audit fired when too much JS is shipped relative to what executes. The fix isn't a config flag — it requires bundle analysis (webpack-bundle-analyzer, rollup-plugin-visualizer), splitting routes into chunks, lazy-loading off-screen components, and removing unused dependencies. Fundamentally different from minification: minifying reduces byte count, this reduces what's downloaded at all.

Source: Google web.dev / Lighthouse

Estimated savings: 210 ms 50.5 KiB

Large network payloads cost users real money and are highly correlated with long load times. Learn how to reduce payload sizes.

Why this matters

Performance issues directly impact user engagement and conversion rates.

More information about the performance of your application. These numbers don't directly affect the Performance score.

Use efficient cache lifetimes
Layout shift culprits
Optimize DOM size
LCP breakdown
Modern HTTP
Optimize viewport for mobile
Minify CSS
Minify JavaScript
Reduce unused CSS
JavaScript execution time 0.6 s
Minimizes main-thread work 1.7 s
Avoid long main-thread tasks 7 long tasks found
Image elements have explicit `width` and `height`
Page didn't prevent back/forward cache restoration
Network Requests
Network Round Trip Times 30 ms
Server Backend Latencies 50 ms
Tasks
Diagnostics
Metrics
Screenshot Thumbnails
Final Screenshot
Script Treemap Data
Resources Summary
Initial server response time was short Root document took 50 ms
Avoid large layout shifts 2 layout shifts found
INP breakdown
LCP request discovery
User Timing marks and measures
Avoid non-composited animations
95

Accessibility

These checks highlight opportunities to improve the accessibility of your web app. Automatic detection can only detect a subset of issues and does not guarantee the accessibility of your web app, so manual testing is also encouraged.

Best practices

Touch targets with sufficient size and spacing help users who may have difficulty targeting small controls to activate the targets. Learn more about touch targets.

Why this matters

Performance issues directly impact user engagement and conversion rates.

Failing Elements
Sign Up nav.absolute > div.flex > div.flex > button.group
Sign Up div.flex > button.group > span.text-[16px] > a

These items highlight common accessibility best practices.

Interactive controls are keyboard focusable
Interactive elements indicate their purpose and state
The page has a logical tab order
Visual order on the page follows DOM order
User focus is not accidentally trapped in a region
The user's focus is directed to new content added to the page
HTML5 landmark elements are used to improve navigation
Offscreen content is hidden from assistive technology
Custom controls have associated labels
Custom controls have ARIA roles
`[aria-*]` attributes match their roles
`[aria-hidden="true"]` is not present on the document `<body>`
`[role]`s have all required `[aria-*]` attributes
`[role]` values are valid
`[aria-*]` attributes have valid values
`[aria-*]` attributes are valid and not misspelled
Buttons have an accessible name
Image elements have `[alt]` attributes
`[user-scalable="no"]` is not used in the `<meta name="viewport">` element and the `[maximum-scale]` attribute is not less than 5.
ARIA attributes are used as specified for the element's role
Elements use only permitted ARIA attributes
Background and foreground colors have a sufficient contrast ratio
Document has a `<title>` element
`<html>` element has a `[lang]` attribute
`<html>` element has a valid value for its `[lang]` attribute
Links have a discernible name
Heading elements appear in a sequentially-descending order
Document has a main landmark.
Deprecated ARIA roles were not used
`<video>` elements contain a `<track>` element with `[kind="captions"]`
`[accesskey]` values are unique
`button`, `link`, and `menuitem` elements have accessible names
Elements with `role="dialog"` or `role="alertdialog"` have accessible names.
`[aria-hidden="true"]` elements do not contain focusable descendents
ARIA input fields have accessible names
ARIA `meter` elements have accessible names
ARIA `progressbar` elements have accessible names
Elements with an ARIA `[role]` that require children to contain a specific `[role]` have all required children.
`[role]`s are contained by their required parent element
Elements with the `role=text` attribute do not have focusable descendents.
ARIA toggle fields have accessible names
ARIA `tooltip` elements have accessible names
ARIA `treeitem` elements have accessible names
The page contains a heading, skip link, or landmark region
`<dl>`'s contain only properly-ordered `<dt>` and `<dd>` groups, `<script>`, `<template>` or `<div>` elements.
Definition list items are wrapped in `<dl>` elements
ARIA IDs are unique
No form fields have multiple labels
`<frame>` or `<iframe>` elements have a title
`<html>` element has an `[xml:lang]` attribute with the same base language as the `[lang]` attribute.
Input buttons have discernible text.
`<input type="image">` elements have `[alt]` text
Form elements have associated labels
Links are distinguishable without relying on color.
Lists contain only `<li>` elements and script supporting elements (`<script>` and `<template>`).
List items (`<li>`) are contained within `<ul>`, `<ol>` or `<menu>` parent elements
The document does not use `<meta http-equiv="refresh">`
`<object>` elements have alternate text
Select elements have associated label elements.
Skip links are focusable.
No element has a `[tabindex]` value greater than 0
Cells in a `<table>` element that use the `[headers]` attribute refer to table cells within the same table.
`<th>` elements and elements with `[role="columnheader"/"rowheader"]` have data cells they describe.
`[lang]` attributes have a valid value
Tables have different content in the summary attribute and `<caption>`.
All heading elements contain content.
Uses ARIA roles only on compatible elements
Image elements do not have `[alt]` attributes that are redundant text.
Identical links have the same purpose.
Elements with visible text labels have matching accessible names.
Tables use `<caption>` instead of cells with the `[colspan]` attribute to indicate a caption.
`<td>` elements in a large `<table>` have one or more table headers.
100

Best Practices

Uses HTTPS
Avoids deprecated APIs
Avoids third-party cookies
Allows users to paste into input fields
Avoids requesting the geolocation permission on page load
Avoids requesting the notification permission on page load
Displays images with correct aspect ratio
Serves images with appropriate resolution
Page has the HTML doctype
Properly defines charset
No browser errors logged to the console
No issues in the `Issues` panel in Chrome Devtools
Ensure CSP is effective against XSS attacks
Ensure proper origin isolation with COOP
Mitigate clickjacking with XFO or CSP
Mitigate DOM-based XSS with Trusted Types
Page has valid source maps
Redirects HTTP traffic to HTTPS
Use a strong HSTS policy
Detected JavaScript libraries
100

SEO

These checks ensure that your page is following basic search engine optimization advice. There are many additional factors Lighthouse does not score here that may affect your search ranking, including performance on Core Web Vitals. Learn more about Google Search Essentials.

Structured data is valid
Page isn’t blocked from indexing
Document has a `<title>` element
Document has a meta description
Page has successful HTTP status code
Links have descriptive text
Links are crawlable
Image elements have `[alt]` attributes
Document has a valid `hreflang`
Document has a valid `rel=canonical`
robots.txt is valid

Lighthouse Scores

Industry-standard audits powered by Google Lighthouse. — Desktop

75
Performance Overall performance score (0–100) based on Core Web Vitals and other metrics. 90+ is good.
100
Accessibility Measures how accessible the page is for users with disabilities. Checks color contrast, ARIA labels, and semantic HTML.
100
Best Practices Checks for modern web development best practices including HTTPS, no console errors, and secure JavaScript.
100
SEO Measures basic SEO optimizations: meta tags, crawlability, link text, and mobile friendliness.

Core Web Vitals

Key metrics that affect user experience. — Desktop

First Contentful Paint First Contentful Paint — how long until the browser renders the first piece of content. Under 1.8s is good.

1.04 s

Largest Contentful Paint Largest Contentful Paint — how long until the largest visible element loads. Under 2.5s is good.

5.39 s

Total Blocking Time Total Blocking Time — total time the main thread was blocked, preventing user input. Under 200ms is good.

0 ms

Cumulative Layout Shift Cumulative Layout Shift — measures visual stability. How much the page layout shifts during loading. Under 0.1 is good.

0.005

Speed Index Speed Index — how quickly content is visually displayed during load. Under 3.4s is good.

1.04 s

Time to Interactive Time to Interactive — how long until the page is fully interactive and responds to user input. Under 3.8s is good.

5.52 s

Detailed Report

Audit breakdown by category with detailed findings.

75

Performance

Insights

Remove large, duplicate JavaScript modules from bundles to reduce unnecessary bytes consumed by network activity.

Why this matters

Performance issues directly impact user engagement and conversion rates.

Polyfills and transforms enable older browsers to use new JavaScript features. However, many aren't necessary for modern browsers. Consider modifying your JavaScript build process to not transpile Baseline features, unless you know you must support older browsers. Learn why most sites can deploy ES6+ code without transpiling

Why this matters

Shipping ES5 transpiled code to modern browsers wastes bytes — every user with an evergreen browser pays for compatibility you don't need.

Learn more

Most users today run browsers that natively support ES6+, async/await, optional chaining, and the rest of modern JavaScript. Transpiling to ES5 'just in case' adds 20-40% to your bundle for no benefit. Configure your build to target a modern browserslist, or ship a differential bundle pair (modern + legacy) with the module/nomodule pattern.

Source: Google web.dev / Lighthouse

3rd party code can significantly impact load performance. Reduce and defer loading of 3rd party code to prioritize your page's content.

Why this matters

Performance issues directly impact user engagement and conversion rates.

Your first network request is the most important. Reduce its latency by avoiding redirects, ensuring a fast server response, and enabling text compression.

Why this matters

Performance issues directly impact user engagement and conversion rates.

Consider setting font-display to swap or optional to ensure text is consistently visible. swap can be further optimized to mitigate layout shifts with font metric overrides.

Why this matters

Performance issues directly impact user engagement and conversion rates.

A forced reflow occurs when JavaScript queries geometric properties (such as offsetWidth) after styles have been invalidated by a change to the DOM state. This can result in poor performance. Learn more about forced reflows and possible mitigations.

Why this matters

Performance issues directly impact user engagement and conversion rates.

headings: [map[key:source label:Source valueType:source-location] map[granularity:1 key:reflowTime label:Total reflow time valueType:ms]]
items: [map[reflowTime:47.52 source:map[type:text value:[unattributed]]]]

Reducing the download time of images can improve the perceived load time of the page and LCP. Learn more about optimizing image size

Why this matters

Performance issues directly impact user engagement and conversion rates.

URLResource SizeEst Savings
body.font-sans > main.relative > section.relative > div.absolute body.font-sans > main.relative > section.relative > div.absolute
blinklabs.xyz/images/peach-gradient.png2.0 MiB1.8 MiB
body.font-sans > main.relative > div.relative > div.absolute body.font-sans > main.relative > div.relative > div.absolute
blinklabs.xyz/images/lake-gradient.png1.7 MiB1.5 MiB
Decorative orb div.grid > div.group > div.absolute > img.object-cover
blinklabs.xyz/_next/image?url=%2Fimages%2Friver-still.png&w=1920&q=751000.7 KiB900.0 KiB

Optimize LCP by making the LCP image discoverable from the HTML immediately, and avoiding lazy-loading

Why this matters

Performance issues directly impact user engagement and conversion rates.

lhId: page-3-IMG
nodeLabel: Decorative card
path: 1,HTML,1,BODY,2,MAIN,0,DIV,1,IMG
selector: body.font-sans > main.relative > div.relative > img.absolute
snippet: <img alt="Decorative card" loading="lazy" width="400" height="400" decoding="async" data-nimg="1" class="absolute top-[252px] right-0 hidden lg:block" style="color:transparent" src="/images/card.svg">

Avoid chaining critical requests by reducing the length of chains, reducing the download size of resources, or deferring the download of unnecessary resources to improve page load.

Why this matters

Performance issues directly impact user engagement and conversion rates.

description: [preconnect](https://developer.chrome.com/docs/lighthouse/performance/uses-rel-preconnect/) hints help the browser establish a connection earlier in the page load, saving time when the first request for that origin is made. The following are the origins that the page preconnected to.
title: Preconnected origins
value: no origins were preconnected
description: Add [preconnect](https://developer.chrome.com/docs/lighthouse/performance/uses-rel-preconnect/) hints to your most important origins, but try to use no more than 4.
title: Preconnect candidates

Requests are blocking the page's initial render, which may delay LCP. Deferring or inlining can move these network requests out of the critical path.

Why this matters

Performance issues directly impact user engagement and conversion rates.

These insights are also available in the Chrome DevTools Performance Panel - record a trace to view more detailed information.

Redirects introduce additional delays before the page can be loaded. Learn how to avoid page redirects.

Why this matters

Performance issues directly impact user engagement and conversion rates.

Estimated savings: 506 ms
URLTime Spent
merkle.io/246 ms
www.merkle.io/260 ms
blinklabs.xyz/0.0 ms

Time to Interactive is the amount of time it takes for the page to become fully interactive. Learn more about the Time to Interactive metric.

Why this matters

Performance issues directly impact user engagement and conversion rates.

TTI

Diagnostics

Reduce unused JavaScript and defer loading scripts until they are required to decrease bytes consumed by network activity. Learn how to reduce unused JavaScript.

Why this matters

Multi-megabyte JavaScript bundles delay every interactive feature on the page.

Learn more

This is the Lighthouse audit fired when too much JS is shipped relative to what executes. The fix isn't a config flag — it requires bundle analysis (webpack-bundle-analyzer, rollup-plugin-visualizer), splitting routes into chunks, lazy-loading off-screen components, and removing unused dependencies. Fundamentally different from minification: minifying reduces byte count, this reduces what's downloaded at all.

Source: Google web.dev / Lighthouse

Estimated savings: 80 ms 50.6 KiB

More information about the performance of your application. These numbers don't directly affect the Performance score.

Use efficient cache lifetimes
Layout shift culprits
Optimize DOM size
LCP breakdown
Modern HTTP
Optimize viewport for mobile
Max Potential First Input Delay 40 ms
Minify CSS
Minify JavaScript
Reduce unused CSS
JavaScript execution time 0.1 s
Minimizes main-thread work 0.5 s
Image elements have explicit `width` and `height`
Page didn't prevent back/forward cache restoration
Network Requests
Network Round Trip Times 30 ms
Server Backend Latencies 60 ms
Tasks
Diagnostics
Metrics
Screenshot Thumbnails
Final Screenshot
Script Treemap Data
Resources Summary
Initial server response time was short Root document took 50 ms
Avoid large layout shifts 6 layout shifts found
INP breakdown
User Timing marks and measures
Avoid long main-thread tasks
Avoid non-composited animations
100

Accessibility

These checks highlight opportunities to improve the accessibility of your web app. Automatic detection can only detect a subset of issues and does not guarantee the accessibility of your web app, so manual testing is also encouraged.

Interactive controls are keyboard focusable
Interactive elements indicate their purpose and state
The page has a logical tab order
Visual order on the page follows DOM order
User focus is not accidentally trapped in a region
The user's focus is directed to new content added to the page
HTML5 landmark elements are used to improve navigation
Offscreen content is hidden from assistive technology
Custom controls have associated labels
Custom controls have ARIA roles
`[aria-*]` attributes match their roles
`[aria-hidden="true"]` is not present on the document `<body>`
`[role]`s have all required `[aria-*]` attributes
`[role]` values are valid
`[aria-*]` attributes have valid values
`[aria-*]` attributes are valid and not misspelled
Buttons have an accessible name
Image elements have `[alt]` attributes
`[user-scalable="no"]` is not used in the `<meta name="viewport">` element and the `[maximum-scale]` attribute is not less than 5.
ARIA attributes are used as specified for the element's role
Elements use only permitted ARIA attributes
Background and foreground colors have a sufficient contrast ratio
Document has a `<title>` element
`<html>` element has a `[lang]` attribute
`<html>` element has a valid value for its `[lang]` attribute
Links have a discernible name
Lists contain only `<li>` elements and script supporting elements (`<script>` and `<template>`).
List items (`<li>`) are contained within `<ul>`, `<ol>` or `<menu>` parent elements
Touch targets have sufficient size and spacing.
Heading elements appear in a sequentially-descending order
Document has a main landmark.
Deprecated ARIA roles were not used
`<video>` elements contain a `<track>` element with `[kind="captions"]`
`[accesskey]` values are unique
`button`, `link`, and `menuitem` elements have accessible names
Elements with `role="dialog"` or `role="alertdialog"` have accessible names.
`[aria-hidden="true"]` elements do not contain focusable descendents
ARIA input fields have accessible names
ARIA `meter` elements have accessible names
ARIA `progressbar` elements have accessible names
Elements with an ARIA `[role]` that require children to contain a specific `[role]` have all required children.
`[role]`s are contained by their required parent element
Elements with the `role=text` attribute do not have focusable descendents.
ARIA toggle fields have accessible names
ARIA `tooltip` elements have accessible names
ARIA `treeitem` elements have accessible names
The page contains a heading, skip link, or landmark region
`<dl>`'s contain only properly-ordered `<dt>` and `<dd>` groups, `<script>`, `<template>` or `<div>` elements.
Definition list items are wrapped in `<dl>` elements
ARIA IDs are unique
No form fields have multiple labels
`<frame>` or `<iframe>` elements have a title
`<html>` element has an `[xml:lang]` attribute with the same base language as the `[lang]` attribute.
Input buttons have discernible text.
`<input type="image">` elements have `[alt]` text
Form elements have associated labels
Links are distinguishable without relying on color.
The document does not use `<meta http-equiv="refresh">`
`<object>` elements have alternate text
Select elements have associated label elements.
Skip links are focusable.
No element has a `[tabindex]` value greater than 0
Cells in a `<table>` element that use the `[headers]` attribute refer to table cells within the same table.
`<th>` elements and elements with `[role="columnheader"/"rowheader"]` have data cells they describe.
`[lang]` attributes have a valid value
Tables have different content in the summary attribute and `<caption>`.
All heading elements contain content.
Uses ARIA roles only on compatible elements
Image elements do not have `[alt]` attributes that are redundant text.
Identical links have the same purpose.
Elements with visible text labels have matching accessible names.
Tables use `<caption>` instead of cells with the `[colspan]` attribute to indicate a caption.
`<td>` elements in a large `<table>` have one or more table headers.
100

Best Practices

Uses HTTPS
Avoids deprecated APIs
Avoids third-party cookies
Allows users to paste into input fields
Avoids requesting the geolocation permission on page load
Avoids requesting the notification permission on page load
Displays images with correct aspect ratio
Serves images with appropriate resolution
Page has the HTML doctype
Properly defines charset
No browser errors logged to the console
No issues in the `Issues` panel in Chrome Devtools
Ensure CSP is effective against XSS attacks
Ensure proper origin isolation with COOP
Mitigate clickjacking with XFO or CSP
Mitigate DOM-based XSS with Trusted Types
Page has valid source maps
Redirects HTTP traffic to HTTPS
Use a strong HSTS policy
Detected JavaScript libraries
100

SEO

These checks ensure that your page is following basic search engine optimization advice. There are many additional factors Lighthouse does not score here that may affect your search ranking, including performance on Core Web Vitals. Learn more about Google Search Essentials.

Structured data is valid
Page isn’t blocked from indexing
Document has a `<title>` element
Document has a meta description
Page has successful HTTP status code
Links have descriptive text
Links are crawlable
Image elements have `[alt]` attributes
Document has a valid `hreflang`
Document has a valid `rel=canonical`
robots.txt is valid

Send Feedback