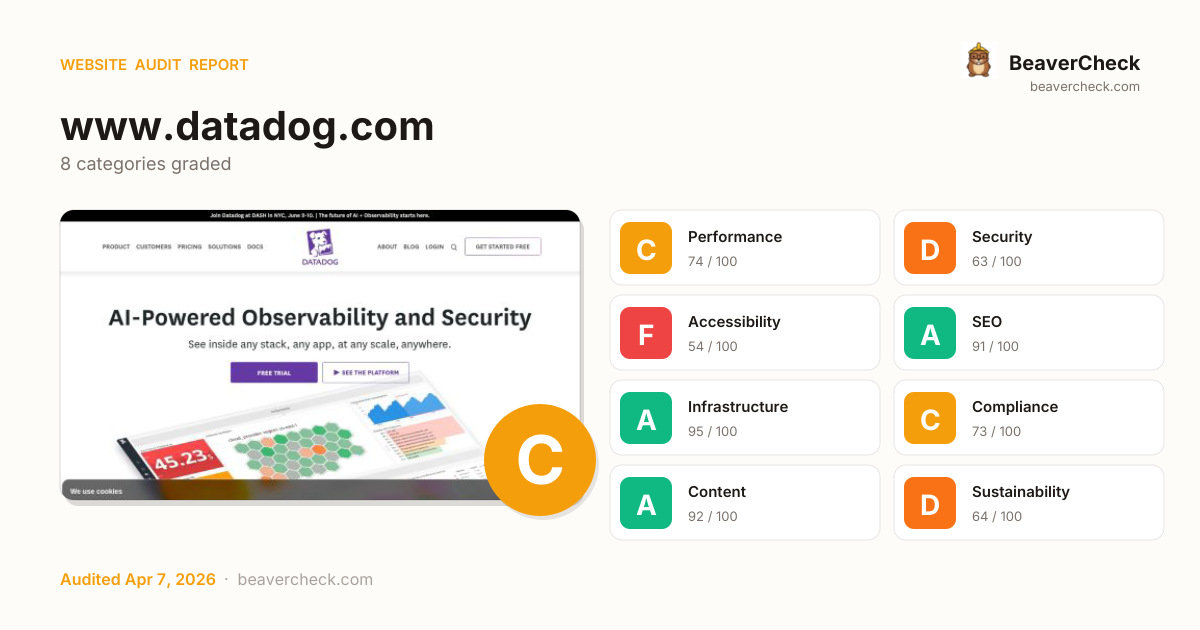
Mobile 375 × 812

Desktop 1440 × 900

Score: 73 / 100
Based on 8 categories, 0 sections
The overall score is a weighted average of individual category scores. Categories with more impact on user experience and security carry more weight.
Weights reflect general web best practices. Individual needs may differ.
Content-Security-Policy header is missing
HSTS header is missing
No Content-Security-Policy header found
1 image-only link(s) without alt text
2 button(s) with no accessible text
[](https://beavercheck.com/results/4510165c-3254-5b4a-4d78-703bfdb84994)<a href="https://beavercheck.com/results/4510165c-3254-5b4a-4d78-703bfdb84994"><img src="https://beavercheck.com/badge?url=https%3A%2F%2Fwww.datadog.com" alt="BeaverCheck Score"></a>https://beavercheck.com/badge?url=https%3A%2F%2Fwww.datadog.comThis badge auto-updates with your latest scan result.
Thanks for your feedback!
Industry-standard audits powered by Google Lighthouse.
Key metrics that affect user experience.
First Contentful Paint First Contentful Paint — how long until the browser renders the first piece of content. Under 1.8s is good.
9.28 s
Largest Contentful Paint Largest Contentful Paint — how long until the largest visible element loads. Under 2.5s is good.
24.26 s
Total Blocking Time Total Blocking Time — total time the main thread was blocked, preventing user input. Under 200ms is good.
954 ms
Cumulative Layout Shift Cumulative Layout Shift — measures visual stability. How much the page layout shifts during loading. Under 0.1 is good.
0.000
Speed Index Speed Index — how quickly content is visually displayed during load. Under 3.4s is good.
10.16 s
Time to Interactive Time to Interactive — how long until the page is fully interactive and responds to user input. Under 3.8s is good.
24.63 s
Audit breakdown by category with detailed findings.
Remove large, duplicate JavaScript modules from bundles to reduce unnecessary bytes consumed by network activity.
Polyfills and transforms enable older browsers to use new JavaScript features. However, many aren't necessary for modern browsers. Consider modifying your JavaScript build process to not transpile Baseline features, unless you know you must support older browsers. Learn why most sites can deploy ES6+ code without transpiling
3rd party code can significantly impact load performance. Reduce and defer loading of 3rd party code to prioritize your page's content.
A long cache lifetime can speed up repeat visits to your page. Learn more about caching.
Your first network request is the most important. Reduce its latency by avoiding redirects, ensuring a fast server response, and enabling text compression.
Consider setting font-display to swap or optional to ensure text is consistently visible. swap can be further optimized to mitigate layout shifts with font metric overrides.
| URL | Est Savings |
|---|---|
| www.datadoghq.com/fonts/iconfont.woff2?11122a160a6ede4e25b35a906dfe790c | 40 ms |
A forced reflow occurs when JavaScript queries geometric properties (such as offsetWidth) after styles have been invalidated by a change to the DOM state. This can result in poor performance. Learn more about forced reflows and possible mitigations.
Reducing the download time of images can improve the perceived load time of the page and LCP. Learn more about optimizing image size
| URL | Resource Size | Est Savings | |
|---|---|---|---|
join our team div.desktop:tw-col-span-6 > figure.mb-0 > picture > img.tw-w-full | /img/home/careers_desktop.png?ch=Width%2cDPR%2cSave-Data&... | 110.5 KiB | 92.6 KiB |
header.intro-header > div.tw-flex > div.section-video > video#datadog-video header.intro-header > div.tw-flex > div.section-video > video#datadog-video | /img/dd-homepage.jpg?w=1700&h=956&fit=crop&q=40&fm=png&au... | 47.1 KiB | 44.7 KiB |
DASH 2025 div.desktop:tw-col-span-6 > figure.mb-0 > picture > img.tw-w-full | /img/home/post_dash_module_mobile_image.jpeg?ch=Width%2cD... | 47.8 KiB | 33.7 KiB |
Infrastructure figure.mb-0 > a > picture > img.tw-w-full | /img/home-hostmap-static.png?ch=Width%2cDPR%2cSave-Data&f... | 43.3 KiB | 30.2 KiB |
Datadog Logo div.container > div.d-flex > a > img.bits-logo-mobile | imgix.datadoghq.com/img/datadog_rbg_n_2x.png?fm=png&auto=format&lossless=1 | 6.7 KiB | 5.7 KiB |
Each subpart has specific improvement strategies. Ideally, most of the LCP time should be spent on loading the resources, not within delays.
Optimize LCP by making the LCP image discoverable from the HTML immediately, and avoiding lazy-loading
Avoid chaining critical requests by reducing the length of chains, reducing the download size of resources, or deferring the download of unnecessary resources to improve page load.
Requests are blocking the page's initial render, which may delay LCP. Deferring or inlining can move these network requests out of the critical path.
| URL | Transfer Size | Duration |
|---|---|---|
| consent.trustarc.com/v2/autoblockasset/core.min.js?cmId= | 0 B | 780 ms |
| consent.trustarc.com/v2/autoblock?cmId= | 0 B | 780 ms |
| /static/dd-libs.cfc0fc7c8131c38b026e93f283148dccf754cd8d3... | 77.7 KiB | 366 ms |
| /styles/datadog-home.min.1d880d137264007fe3ccf9766b0fd90e... | 98.5 KiB | 1.3 s |
| /css/styles.min.a7473c1f594ec019b0009ab96b2f5474ec203c767... | 65.1 KiB | 183 ms |
| /assets/utm-handler.min.94d79fa3fc8f8c1ba1b075710e46a95a0... | 2.7 KiB | |
| cdn.zeroclick.ai/scripts/zc-global-min.js | 739 B | 802 ms |
| /styles/tw-iconfont.min.9c34576202e92e395c966b12961639773... | 6.8 KiB | 183 ms |
| /assets/dd-browser-logs-rum.min.21306b867b795939bcec583e5... | 30.4 KiB | 183 ms |
These insights are also available in the Chrome DevTools Performance Panel - record a trace to view more detailed information.
Time to Interactive is the amount of time it takes for the page to become fully interactive. Learn more about the Time to Interactive metric.
Redirects introduce additional delays before the page can be loaded. Learn how to avoid page redirects.
| URL | Time Spent |
|---|---|
| www.datadog.com/ | 857 ms |
| www.datadoghq.com/ | 0.0 ms |
The maximum potential First Input Delay that your users could experience is the duration of the longest task. Learn more about the Maximum Potential First Input Delay metric.
Reduce unused rules from stylesheets and defer CSS not used for above-the-fold content to decrease bytes consumed by network activity. Learn how to reduce unused CSS.
| URL | Transfer Size | Est Savings |
|---|---|---|
| /styles/datadog-home.min.1d880d137264007fe3ccf9766b0fd90e... | 97.7 KiB | 93.4 KiB |
| /css/styles.min.a7473c1f594ec019b0009ab96b2f5474ec203c767... | 64.3 KiB | 62.5 KiB |
Reduce unused JavaScript and defer loading scripts until they are required to decrease bytes consumed by network activity. Learn how to reduce unused JavaScript.
| URL | Transfer Size | Est Savings |
|---|---|---|
| /assets/search-bar.min.44a96559baa6da2809e90007237d788004... | 96.5 KiB | 63.6 KiB |
| www.googletagmanager.com/gtm.js?id=GTM-WDC8G6 | 184.3 KiB | 62.2 KiB |
| www.googletagmanager.com/gtag/js?id=G-KN80RDFSQK&cx=c>m=4e6460 | 173.7 KiB | 61.9 KiB |
| www.googletagmanager.com/gtag/js?id=AW-827913433&cx=c>m=4e6460 | 145.7 KiB | 60.5 KiB |
| lp.datadoghq.com/js/forms2/js/forms2.min.js | 67.0 KiB | 51.6 KiB |
| transcend-cdn.com/cm/dc241cd4-6477-4f2b-86c0-6bcb51869e28/ui.js | 98.1 KiB | 37.6 KiB |
| cdn.calibermind.com/a.js | 58.6 KiB | 36.4 KiB |
| lp.datadoghq.com/js/forms2/js/forms2.min.js | 67.0 KiB | 35.5 KiB |
| connect.facebook.net/en_US/fbevents.js | 94.8 KiB | 31.7 KiB |
| /static/dd-libs.cfc0fc7c8131c38b026e93f283148dccf754cd8d3... | 77.0 KiB | 30.4 KiB |
| d-code.liadm.com/did-006l.min.js | 45.6 KiB | 21.0 KiB |
Consider reducing the time spent parsing, compiling, and executing JS. You may find delivering smaller JS payloads helps with this. Learn how to reduce Javascript execution time.
Consider reducing the time spent parsing, compiling and executing JS. You may find delivering smaller JS payloads helps with this. Learn how to minimize main-thread work
| Category | Time Spent |
|---|---|
| Script Evaluation | 6.9 s |
| Other | 1.3 s |
| Style & Layout | 472 ms |
| Script Parsing & Compilation | 407 ms |
| Garbage Collection | 229 ms |
| Parse HTML & CSS | 155 ms |
| Rendering | 31 ms |
Large network payloads cost users real money and are highly correlated with long load times. Learn how to reduce payload sizes.
Set an explicit width and height on image elements to reduce layout shifts and improve CLS. Learn how to set image dimensions
| URL | |
|---|---|
join our team div.desktop:tw-col-span-6 > figure.mb-0 > picture > img.tw-w-full | /img/home/careers_desktop.png?ch=Width%2cDPR%2cSave-Data&... |
Infrastructure figure.mb-0 > a > picture > img.tw-w-full | /img/home-hostmap-static.png?ch=Width%2cDPR%2cSave-Data&f... |
div.tw-flex > div.desktop:tw-col-span-6 > picture.bg > img.w-100 div.tw-flex > div.desktop:tw-col-span-6 > picture.bg > img.w-100 | /img/blog/state-of-devsecops/state-of-devsecops-2026/hero... |
div.footer-menu > span.d-flex > a#transcend-footer-link > img div.footer-menu > span.d-flex > a#transcend-footer-link > img | imgix.datadoghq.com/img/icons/privacyoptions.svg?w=24&dpr=2 |
Log Management figure.mb-0 > a > picture > img.tw-w-full | |
APM figure.mb-0 > a > picture > img.tw-w-full | |
Security Monitoring figure.mb-0 > a > picture > img.tw-w-full | |
Network Monitoring figure.mb-0 > a > picture > img.tw-w-full | |
Synthetic Monitoring figure.mb-0 > a > picture > img.tw-w-full | |
Real User Monitoring figure.mb-0 > a > picture > img.tw-w-full | |
Serverless figure.mb-0 > a > picture > img.tw-w-full |
More information about the performance of your application. These numbers don't directly affect the Performance score.
These checks highlight opportunities to improve the accessibility of your web app. Automatic detection can only detect a subset of issues and does not guarantee the accessibility of your web app, so manual testing is also encouraged.
Properly ordered headings that do not skip levels convey the semantic structure of the page, making it easier to navigate and understand when using assistive technologies. Learn more about heading order.
| Failing Elements |
|---|
2025 GARTNER® MAGIC QUADRANT™ div.container > div.row > div.text-container > h5 |
These are opportunities to improve keyboard navigation in your application.
Visible text labels that do not match the accessible name can result in a confusing experience for screen reader users. Learn more about accessible names.
| Failing Elements |
|---|
REGISTER NOW div.tw-flex > div.tw-relative > div.tw-relative > a.tw-flex |
LEARN MORE div.container > div.row > div.text-container > a.rotating-banner-btn |
LEARN MORE div.tw-flex > div.home-blog-bg > div.tw-container > a.tw-flex |
LEARN MORE section > div.bg-gray-lightest > div.tw-container > a.tw-flex |
Image display dimensions should match natural aspect ratio. Learn more about image aspect ratio.
| URL | Aspect Ratio (Displayed) | Aspect Ratio (Actual) | |
|---|---|---|---|
DASH Gradient Background div.tw-absolute > figure.mb-0 > picture > img.tw-w-full | /img/home/dash-gradient.jpg?ch=Width%2cDPR%2cSave-Data&fm... | 412 x 823 (0.50) | 850 x 547 (1.55) |
Infrastructure div.desktop:tw-absolute > figure.mb-0 > picture > img.tw-w-full | /img/home-hostmap-static.png?ch=Width%2cDPR%2cSave-Data&f... | 804 x 416 (1.93) | 694 x 416 (1.67) |
DataDog div.d-none > div > a.js-logo-download > img.bits-logo-lg | /img/dd_logo_n_70x75.png?ch=Width,DPR&fit=max&auto=format... | 140 x 75 (1.87) | 140 x 150 (0.93) |
DataDog div.d-none > div > a.js-logo-download > img.datadog-text-logo-lg | /img/dd-logo-n-200.png?ch=Width,DPR&fit=max&auto=format&h... | 187 x 14 (13.36) | 187 x 28 (6.68) |
Deprecated APIs will eventually be removed from the browser. Learn more about deprecated APIs.
| Deprecation / Warning | Source |
|---|---|
| AttributionReporting |
Errors logged to the console indicate unresolved problems. They can come from network request failures and other browser concerns. Learn more about this errors in console diagnostic audit
| Source | Description |
|---|---|
Failed to load resource: the server responded with a status of 451 () | |
ZeroClick Error: No ZeroClick ID found |
These checks ensure that your page is following basic search engine optimization advice. There are many additional factors Lighthouse does not score here that may affect your search ranking, including performance on Core Web Vitals. Learn more about Google Search Essentials.
Descriptive link text helps search engines understand your content. Learn how to make links more accessible.
| Link destination | Link Text |
|---|---|
| /resources/forrester-wave-aiops-2025/?utm_source=inbound&... | Learn More |
| /resources/gartner-magic-quadrant-observability-platforms... | LEARN MORE |
| /resources/gartner-magic-quadrant-digital-experience-moni... | Learn More |
| www.datadoghq.com/product/infrastructure-monitoring/ | Learn more |
| www.datadoghq.com/state-of-devsecops/ | LEARN MORE |
| careers.datadoghq.com/ | LEARN MORE |
| www.datadoghq.com/events-webinars/ | LEARN MORE |
Format your HTML in a way that enables crawlers to better understand your app’s content.
Industry-standard audits powered by Google Lighthouse. — Desktop
Key metrics that affect user experience. — Desktop
First Contentful Paint First Contentful Paint — how long until the browser renders the first piece of content. Under 1.8s is good.
1.39 s
Largest Contentful Paint Largest Contentful Paint — how long until the largest visible element loads. Under 2.5s is good.
2.17 s
Total Blocking Time Total Blocking Time — total time the main thread was blocked, preventing user input. Under 200ms is good.
59 ms
Cumulative Layout Shift Cumulative Layout Shift — measures visual stability. How much the page layout shifts during loading. Under 0.1 is good.
0.001
Speed Index Speed Index — how quickly content is visually displayed during load. Under 3.4s is good.
3.29 s
Time to Interactive Time to Interactive — how long until the page is fully interactive and responds to user input. Under 3.8s is good.
5.30 s
Audit breakdown by category with detailed findings.
Remove large, duplicate JavaScript modules from bundles to reduce unnecessary bytes consumed by network activity.
Polyfills and transforms enable older browsers to use new JavaScript features. However, many aren't necessary for modern browsers. Consider modifying your JavaScript build process to not transpile Baseline features, unless you know you must support older browsers. Learn why most sites can deploy ES6+ code without transpiling
3rd party code can significantly impact load performance. Reduce and defer loading of 3rd party code to prioritize your page's content.
Your first network request is the most important. Reduce its latency by avoiding redirects, ensuring a fast server response, and enabling text compression.
Consider setting font-display to swap or optional to ensure text is consistently visible. swap can be further optimized to mitigate layout shifts with font metric overrides.
| URL | Est Savings |
|---|---|
| www.datadoghq.com/fonts/iconfont.woff2?11122a160a6ede4e25b35a906dfe790c | 40 ms |
A forced reflow occurs when JavaScript queries geometric properties (such as offsetWidth) after styles have been invalidated by a change to the DOM state. This can result in poor performance. Learn more about forced reflows and possible mitigations.
Reducing the download time of images can improve the perceived load time of the page and LCP. Learn more about optimizing image size
| URL | Resource Size | Est Savings | |
|---|---|---|---|
join our team div.desktop:tw-col-span-6 > figure.mb-0 > picture > img.tw-w-full | /img/home/careers_desktop.png?ch=Width%2cDPR%2cSave-Data&... | 345.1 KiB | 297.0 KiB |
DASH 2025 div.desktop:tw-col-span-6 > figure.mb-0 > picture > img.tw-w-full | /img/home/post_dash_module_desktop_image.jpg?ch=Width%2cD... | 227.4 KiB | 182.1 KiB |
div.tw-flex > div.desktop:tw-col-span-6 > picture.bg > img.w-100 div.tw-flex > div.desktop:tw-col-span-6 > picture.bg > img.w-100 | /img/blog/state-of-devsecops/state-of-devsecops-2026/hero... | 55.1 KiB | 37.7 KiB |
From overview to deep details, fast details.last-of-type:[&_.long-button]:tw-mb-0 > div.desktop:tw-absolute > a.tw-hidden > video.home-product-video | /img/home-hostmap-static.png?w=804&fit=crop&fm=jpg&auto=f... | 42.3 KiB | 32.0 KiB |
header.intro-header > div.tw-flex > div.section-video > video#datadog-video header.intro-header > div.tw-flex > div.section-video > video#datadog-video | /img/dd-homepage.jpg?w=1700&h=956&fit=crop&q=40&fm=png&au... | 47.1 KiB | 25.7 KiB |
DASH Gradient Background div.tw-absolute > figure.mb-0 > picture > img.tw-w-full | /img/home/dash-gradient.jpg?ch=Width%2cDPR%2cSave-Data&fm... | 21.4 KiB | 12.2 KiB |
Optimize LCP by making the LCP image discoverable from the HTML immediately, and avoiding lazy-loading
Avoid chaining critical requests by reducing the length of chains, reducing the download size of resources, or deferring the download of unnecessary resources to improve page load.
Requests are blocking the page's initial render, which may delay LCP. Deferring or inlining can move these network requests out of the critical path.
A long cache lifetime can speed up repeat visits to your page. Learn more about caching.
These insights are also available in the Chrome DevTools Performance Panel - record a trace to view more detailed information.
Redirects introduce additional delays before the page can be loaded. Learn how to avoid page redirects.
| URL | Time Spent |
|---|---|
| www.datadog.com/ | 302 ms |
| www.datadoghq.com/ | 0.0 ms |
Time to Interactive is the amount of time it takes for the page to become fully interactive. Learn more about the Time to Interactive metric.
Reduce unused rules from stylesheets and defer CSS not used for above-the-fold content to decrease bytes consumed by network activity. Learn how to reduce unused CSS.
| URL | Transfer Size | Est Savings |
|---|---|---|
| /styles/datadog-home.min.1d880d137264007fe3ccf9766b0fd90e... | 97.7 KiB | 93.0 KiB |
| /css/styles.min.a7473c1f594ec019b0009ab96b2f5474ec203c767... | 64.3 KiB | 61.4 KiB |
Reduce unused JavaScript and defer loading scripts until they are required to decrease bytes consumed by network activity. Learn how to reduce unused JavaScript.
| URL | Transfer Size | Est Savings |
|---|---|---|
| /assets/search-bar.min.44a96559baa6da2809e90007237d788004... | 96.5 KiB | 63.3 KiB |
| www.googletagmanager.com/gtm.js?id=GTM-WDC8G6 | 184.4 KiB | 62.2 KiB |
| www.googletagmanager.com/gtag/js?id=G-KN80RDFSQK&cx=c>m=4e6461h2 | 173.7 KiB | 61.8 KiB |
| www.googletagmanager.com/gtag/js?id=AW-827913433&cx=c>m=4e6461h2 | 145.7 KiB | 59.9 KiB |
| lp.datadoghq.com/js/forms2/js/forms2.min.js | 67.1 KiB | 51.6 KiB |
| transcend-cdn.com/cm/dc241cd4-6477-4f2b-86c0-6bcb51869e28/ui.js | 98.3 KiB | 37.7 KiB |
| cdn.calibermind.com/a.js | 58.5 KiB | 36.4 KiB |
| lp.datadoghq.com/js/forms2/js/forms2.min.js | 67.1 KiB | 35.7 KiB |
| connect.facebook.net/en_US/fbevents.js | 94.8 KiB | 31.9 KiB |
| /static/dd-libs.cfc0fc7c8131c38b026e93f283148dccf754cd8d3... | 77.0 KiB | 30.0 KiB |
| d-code.liadm.com/did-006l.min.js | 45.6 KiB | 21.0 KiB |
Consider reducing the time spent parsing, compiling, and executing JS. You may find delivering smaller JS payloads helps with this. Learn how to reduce Javascript execution time.
| URL | Total CPU Time | Script Evaluation | Script Parse |
|---|---|---|---|
| www.redditstatic.com/ads/pixel.js | 1.0 s | 961 ms | 1.6 ms |
| Unattributable | 448 ms | 48 ms | 0.0 ms |
| www.datadoghq.com/ | 178 ms | 28 ms | 2.1 ms |
| lp.datadoghq.com/js/forms2/js/forms2.min.js | 129 ms | 64 ms | 15 ms |
| www.googletagmanager.com/gtm.js?id=GTM-WDC8G6 | 108 ms | 92 ms | 12 ms |
| www.googletagmanager.com/gtag/js?id=G-KN80RDFSQK&cx=c>m=4e6461h2 | 102 ms | 78 ms | 14 ms |
| /static/dd-libs.cfc0fc7c8131c38b026e93f283148dccf754cd8d3... | 80 ms | 43 ms | 6.5 ms |
| www.googletagmanager.com/gtag/js?id=AW-827913433&cx=c>m=4e6461h2 | 61 ms | 46 ms | 15 ms |
| /assets/dd-browser-logs-rum.min.21306b867b795939bcec583e5... | 61 ms | 55 ms | 2.9 ms |
Consider reducing the time spent parsing, compiling and executing JS. You may find delivering smaller JS payloads helps with this. Learn how to minimize main-thread work
| Category | Time Spent |
|---|---|
| Script Evaluation | 1.8 s |
| Other | 453 ms |
| Style & Layout | 135 ms |
| Script Parsing & Compilation | 126 ms |
| Garbage Collection | 62 ms |
| Parse HTML & CSS | 53 ms |
| Rendering | 22 ms |
Large network payloads cost users real money and are highly correlated with long load times. Learn how to reduce payload sizes.
Set an explicit width and height on image elements to reduce layout shifts and improve CLS. Learn how to set image dimensions
| URL | |
|---|---|
div.tw-flex > div.desktop:tw-col-span-6 > picture.bg > img.w-100 div.tw-flex > div.desktop:tw-col-span-6 > picture.bg > img.w-100 | /img/blog/state-of-devsecops/state-of-devsecops-2026/hero... |
join our team div.desktop:tw-col-span-6 > figure.mb-0 > picture > img.tw-w-full | /img/home/careers_desktop.png?ch=Width%2cDPR%2cSave-Data&... |
div.footer-menu > span.d-flex > a#transcend-footer-link > img div.footer-menu > span.d-flex > a#transcend-footer-link > img | imgix.datadoghq.com/img/icons/privacyoptions.svg?w=24&dpr=2 |
DataDog div.d-none > div > a.js-logo-download > img.bits-logo-lg | /img/dd_logo_n_70x75.png?ch=Width,DPR&fit=max&auto=format... |
More information about the performance of your application. These numbers don't directly affect the Performance score.
These checks highlight opportunities to improve the accessibility of your web app. Automatic detection can only detect a subset of issues and does not guarantee the accessibility of your web app, so manual testing is also encouraged.
Properly ordered headings that do not skip levels convey the semantic structure of the page, making it easier to navigate and understand when using assistive technologies. Learn more about heading order.
| Failing Elements |
|---|
2025 GARTNER® MAGIC QUADRANT™ div.container > div.row > div.text-container > h5 |
These are opportunities to improve keyboard navigation in your application.
Link text (and alternate text for images, when used as links) that is discernible, unique, and focusable improves the navigation experience for screen reader users. Learn how to make links accessible.
| Failing Elements |
|---|
Infrastructure details.last-of-type:[&_.long-button]:tw-mb-0 > div.desktop:tw-absolute > figure.mb-0 > a |
These are opportunities to improve the semantics of the controls in your application. This may enhance the experience for users of assistive technology, like a screen reader.
Touch targets with sufficient size and spacing help users who may have difficulty targeting small controls to activate the targets. Learn more about touch targets.
| Failing Elements |
|---|
Search toggle div.d-none > ul.d-flex > li#search-toggle > a.js-search-toggle |
Open search bar. ul.d-flex > li#search-toggle > a.js-search-toggle > button |
Infrastructure Monitoring div.d-flex > div.footer-menu > span.d-inline-flex > a.d-inline-block |
Pricing div.d-flex > div.footer-menu > span.d-inline-flex > a.d-inline-block |
Contact Us div.d-flex > div.footer-menu > span.d-inline-flex > a.d-inline-block |
The Monitor div.d-flex > div.footer-menu > span.d-inline-flex > a.d-inline-block |
These items highlight common accessibility best practices.
Visible text labels that do not match the accessible name can result in a confusing experience for screen reader users. Learn more about accessible names.
| Failing Elements |
|---|
REGISTER NOW div.tw-flex > div.tw-relative > div.tw-relative > a.tw-flex |
LEARN MORE div.container > div.row > div.text-container > a.rotating-banner-btn |
LEARN MORE div.tw-flex > div.home-blog-bg > div.tw-container > a.tw-flex |
LEARN MORE section > div.bg-gray-lightest > div.tw-container > a.tw-flex |
Image display dimensions should match natural aspect ratio. Learn more about image aspect ratio.
| URL | Aspect Ratio (Displayed) | Aspect Ratio (Actual) | |
|---|---|---|---|
DASH Gradient Background div.tw-absolute > figure.mb-0 > picture > img.tw-w-full | /img/home/dash-gradient.jpg?ch=Width%2cDPR%2cSave-Data&fm... | 675 x 940 (0.72) | 1512 x 973 (1.55) |
Deprecated APIs will eventually be removed from the browser. Learn more about deprecated APIs.
| Deprecation / Warning | Source |
|---|---|
| AttributionReporting |
Errors logged to the console indicate unresolved problems. They can come from network request failures and other browser concerns. Learn more about this errors in console diagnostic audit
| Source | Description |
|---|---|
Failed to load resource: the server responded with a status of 451 () | |
ZeroClick Error: No ZeroClick ID found |
These checks ensure that your page is following basic search engine optimization advice. There are many additional factors Lighthouse does not score here that may affect your search ranking, including performance on Core Web Vitals. Learn more about Google Search Essentials.
Descriptive link text helps search engines understand your content. Learn how to make links more accessible.
| Link destination | Link Text |
|---|---|
| /resources/forrester-wave-aiops-2025/?utm_source=inbound&... | Learn More |
| /resources/gartner-magic-quadrant-observability-platforms... | Learn More |
| /resources/gartner-magic-quadrant-digital-experience-moni... | LEARN MORE |
| www.datadoghq.com/product/infrastructure-monitoring/ | Learn more |
| www.datadoghq.com/state-of-devsecops/ | LEARN MORE |
| careers.datadoghq.com/ | LEARN MORE |
| www.datadoghq.com/events-webinars/ | LEARN MORE |
Format your HTML in a way that enables crawlers to better understand your app’s content.
Send Feedback