Global Performance
6/6 locations ✓Acceptable global latency — average 453ms across 6 locations, fastest from Santa Clara (61ms), slowest from Singapore (958ms). Cloudflare edge cache (HIT). 3 locations above the 500ms target.
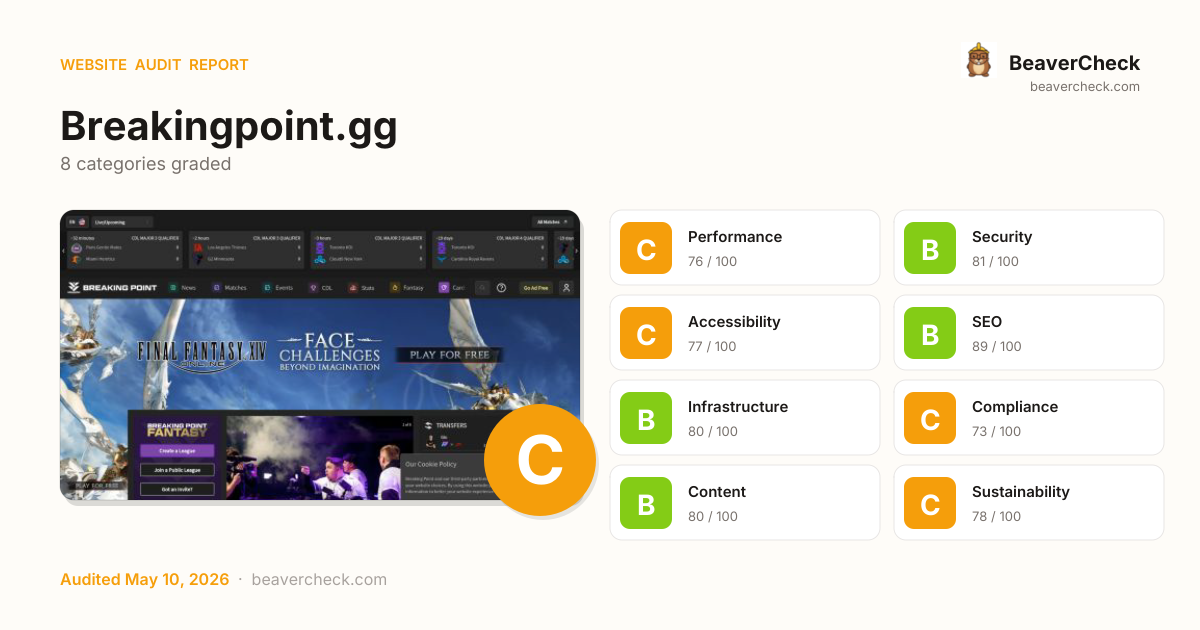
Audit overview
All categories sit comfortably above the 70 threshold; this is a clean audit.
Fix Priority Matrix
5 findingsQuick Wins
2High impact, low effort — start here.
Strategic
3High impact, requires investment.
Easy Improvements
0Small gains, minimal effort.
Nothing in this quadrant — good news.
Deprioritize
0Low impact, high effort — do last.
Nothing in this quadrant — good news.
Screenshots

Top Priorities (5)
Content-Security-Policy header is missing
Without a CSP, a single XSS bug can exfiltrate everything your users type — including credentials.
HSTS header is missing
Without HSTS, a network attacker can downgrade the very first connection to HTTP and steal the user's session.
No Content-Security-Policy header found
Without a CSP, a single XSS bug can exfiltrate everything users type — credentials, payment data, session tokens.
Page weighs 14.4 MB (4.7 MB transferred)
Informational: total page weight (uncompressed) and bytes actually transferred over the wire.
1 control(s) without accessible label
Form controls without labels — assistive tech announces 'edit text' with no context; users can't complete forms.
Business case
What fixing the audit's findings is worth -- and what ignoring them keeps costing.
Return on investment
€616 investment → €9,736/month returns + EUR 500,000 risk avoided
Figures combine localized regulatory fine ceilings, search/conversion value priced against local CPC, and bandwidth waste estimates. Results depend on implementation quality and audience composition. Not legal or financial advice.
Conversion barriers
12 barrier(s) likely increasing bounce by ~36%.
- Page takes 12.9s to loadUsers abandon at ~3s — you're 10.4s over the 2.5s threshold→ Optimize render-blocking resources, preload the hero image, and compress images
- Page feels frozen for 12.6sClicks on the primary CTA are ignored while JavaScript runs→ Break up long tasks; defer non-critical JavaScript to post-hydration
- Severe layout shift during page loadUsers mis-click when content jumps — converting intent into frustration→ Reserve space for images, ads, and embeds with explicit width/height
- No HSTS headerReturning visitors are briefly exposed to downgrade attacks on first request→ Set Strict-Transport-Security: max-age=31536000; includeSubDomains
- No Content-Security-Policy headerHigher XSS blast radius — one compromised script can exfiltrate the checkout form→ Ship a reporting-only CSP first, then enforce once violations are clean
Preliminary CRO audit — each barrier links to the tab with detailed analysis.
Remediation cost
Start here for the best return on investment
Cost by category
Cost by effort level
Adjust assumptions
Team composition
Multiplier applied to dev hours to reflect QA, design, and PM overhead. Use Dev only for solo work; Full team for projects with formal review processes.
Rates reflect fully-loaded developer cost including overhead
Warning:Cost of inaction
Compliance Risk
€500.000
- No <main> landmark foundEAA: EUR 1.000 – EUR 500.000
- No <nav> landmark foundEAA: EUR 1.000 – EUR 500.000
- Skip navigation link is missing (WCAG 2.4.1)EAA: EUR 1.000 – EUR 500.000
Bounce-Rate Cost
€7.935 /mo
+36.1pp bounce · ~3,607 lost visitors/mo
CPC: EUR 2.20
Bandwidth Waste
€1,09 /mo
14758.7 MB/mo × 0.074 EUR/GB
- Optimize transfer: save ~1.5 MB per page loadSaves €1,09/mo
Compliance figures represent the statutory maximum fine for the most severe triggered category, capped per regulation — not the sum of per-finding penalties. Based on published regulatory fine ranges. This is not legal advice.
Unique monthly visitors from your analytics
Purchases, signups, or key actions
Optional — for revenue estimation
more engaged visitors from reduced bounce
Fix 5 critical issues to capture this value
How this is calculated
Based on Google/Deloitte research ("Milliseconds Make Millions") showing a ~7% bounce rate increase per additional second of LCP above the 2.5s "Good" threshold.
Your site's LCP: → estimated after fixes.
These are estimates based on industry research — actual results vary
Your data stays in your browser — nothing is sent to our servers
Lighthouse
Mobile
First Contentful Paint First Contentful Paint — how long until the browser renders the first piece of content. Under 1.8s is good.
1.61 s
Largest Contentful Paint Largest Contentful Paint — how long until the largest visible element loads. Under 2.5s is good.
12.93 s
Total Blocking Time Total Blocking Time — total time the main thread was blocked, preventing user input. Under 200ms is good.
12.62 s
Cumulative Layout Shift Cumulative Layout Shift — measures visual stability. How much the page layout shifts during loading. Under 0.1 is good.
0.734
Speed Index Speed Index — how quickly content is visually displayed during load. Under 3.4s is good.
14.17 s
Time to Interactive Time to Interactive — how long until the page is fully interactive and responds to user input. Under 3.8s is good.
51.23 s
Desktop
First Contentful Paint First Contentful Paint — how long until the browser renders the first piece of content. Under 1.8s is good.
635 ms
Largest Contentful Paint Largest Contentful Paint — how long until the largest visible element loads. Under 2.5s is good.
10.21 s
Total Blocking Time Total Blocking Time — total time the main thread was blocked, preventing user input. Under 200ms is good.
1.54 s
Cumulative Layout Shift Cumulative Layout Shift — measures visual stability. How much the page layout shifts during loading. Under 0.1 is good.
0.100
Speed Index Speed Index — how quickly content is visually displayed during load. Under 3.4s is good.
14.28 s
Time to Interactive Time to Interactive — how long until the page is fully interactive and responds to user input. Under 3.8s is good.
10.34 s
Categories
8Performance
Page weighs 14.4 MB (4.7 MB transferred)
Security
Content-Security-Policy header is missing
Accessibility
1 control(s) without accessible label
SEO
All checks pass
Infrastructure
All checks pass
Compliance
All checks pass
Content
All checks pass
Sustainability
All checks pass
How you compare
Where this site stands against peers running the same stack.
Top 10% of Google Search Console sites score 95+ on Infrastructure; you're at 80 — closing this gap is the highest-leverage improvement.
Technology stack
Google Search Console, on Turbopack, hosted on Next.js, with Cloudflare CDN
Stack Architecture
 Mantine
  Open Graph
  React
React  Sentry
  Webpack
  dc.js
dc.js  Turbopack
  TypeScript
  Cloudflare
  Next.js 16.1.6
All Detected Technologies (12)
Cloudflare is a web-infrastructure and website-security company, providing content-delivery-network services, DDoS mitigation, Internet security, and distributed domain-name-server services.
Next.js is a React framework for developing single page Javascript applications.
Turbopack is an incremental bundler for JavaScript and TypeScript, written in Rust and integrated into the Next.js framework for optimized build performance.
TypeScript is an open-source language which builds on JavaScript by adding static type definitions.
Mantine is an open-source UI framework and component library for React.
Open Graph is a protocol that is used to integrate any web page into the social graph.
React is an open-source JavaScript library for building user interfaces or UI components.
Sentry is an open-source platform for workflow productivity, aggregating errors from across the stack in real time.
Webpack is an open-source JavaScript module bundler.
A multi-dimensional charting library built to work natively with crossfilter and rendered using d3.js
Observations (2)
No build tool detected
A framework (Google Search Console) was detected but no bundler was identified. The build tool may not be detectable from output patterns, or the site may use the framework's built-in bundler.
Complex technology stack detected
12 technologies identified. A complex stack increases maintenance burden and attack surface. Consider whether all components are actively needed.
Show your score
Drop this badge on your README, marketing site, or status page. It auto-updates every time the audit re-runs and links back to this report.
This badge auto-updates with your latest scan result.
[](https://beavercheck.com/results/484449dd-eb85-4d2b-ace1-a4e21244337d)<a href="https://beavercheck.com/results/484449dd-eb85-4d2b-ace1-a4e21244337d"><img src="https://beavercheck.com/badge?url=https%3A%2F%2FBreakingpoint.gg" alt="BeaverCheck Score"></a>https://beavercheck.com/badge?url=https%3A%2F%2FBreakingpoint.ggExport & share
Download the audit, share with your team, or grab a fix plan ready to copy into your tracker.
Copies markdown to clipboard
Fix Plan
Three-week roadmap to ship the audit's findings, with one-click copy targets for your tracker.
Three-week fix plan
2 sprints · 7h total → projected B (88)
Sprint 1: Quick Wins
+5Highest ROI — low effort, high impact
- · Page weighs 14.4 MB (4.7 MB transferred)
- · HSTS header is missing
Sprint 2: Core Fixes
+4Medium effort, high structural impact
- · 1 control(s) without accessible label
- · Content-Security-Policy header is missing
- · No Content-Security-Policy header found