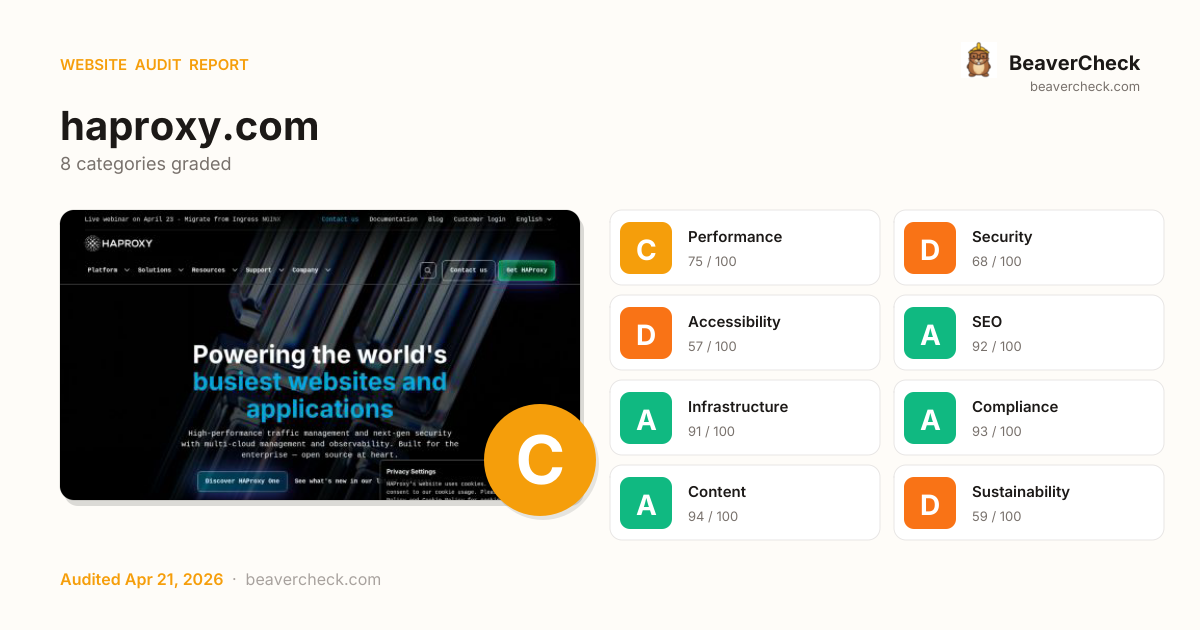
Audit overview
3 categories need attention: Security, and 2 others.
Fix Priority Matrix
5 findingsQuick Wins
4High impact, low effort — start here.
Strategic
1High impact, requires investment.
Easy Improvements
0Small gains, minimal effort.
Nothing in this quadrant — good news.
Deprioritize
0Low impact, high effort — do last.
Nothing in this quadrant — good news.
Screenshots


Top Priorities (5)
HSTS header is missing
Without HSTS, a network attacker can downgrade the very first connection to HTTP and steal the user's session.
Page weighs 10.6 MB (8.5 MB transferred)
Informational: total page weight (uncompressed) and bytes actually transferred over the wire.
2 link(s) with no accessible text
Links with no accessible text (empty <a></a>, image-only no alt, icon-only no aria-label) are unidentifiable to screen readers.
No <main> landmark found
Without a <main> landmark, screen-reader users can't skip past the navigation to the page content — every page starts with re-reading the menu.
is missing width/height — may cause layout shift
Performance issues directly impact user engagement and conversion rates.
Business case
What fixing the audit's findings is worth -- and what ignoring them keeps costing.
Return on investment
€248 investment → €3,795/month returns + EUR 500,000 risk avoided
Figures combine localized regulatory fine ceilings, search/conversion value priced against local CPC, and bandwidth waste estimates. Results depend on implementation quality and audience composition. Not legal or financial advice.
Conversion barriers
6 barrier(s) likely increasing bounce by ~12%.
- High main-thread blocking timePage is non-interactive for 540ms after first paint→ Defer third-party scripts and split large bundles
- No HSTS headerReturning visitors are briefly exposed to downgrade attacks on first request→ Set Strict-Transport-Security: max-age=31536000; includeSubDomains
- No Content-Security-Policy headerHigher XSS blast radius — one compromised script can exfiltrate the checkout form→ Ship a reporting-only CSP first, then enforce once violations are clean
- Content is hard to readGraduate-level reading difficulty — limits the addressable audience for product or blog pages→ Shorten sentences; replace jargon with plain language; target Flesch ease ≥60
- 8 link(s) with generic text ("click here", "read more")Screen-reader users navigating by link list see no context — and search engines can't infer relevance→ Rewrite with descriptive phrases that identify the destination
Preliminary CRO audit — each barrier links to the tab with detailed analysis.
Remediation cost
Start here for the best return on investment
Cost by category
Cost by effort level
Adjust assumptions
Team composition
Multiplier applied to dev hours to reflect QA, design, and PM overhead. Use Dev only for solo work; Full team for projects with formal review processes.
Rates reflect fully-loaded developer cost including overhead
Warning:Cost of inaction
Compliance Risk
€500.000
- No <main> landmark foundEAA: EUR 1.000 – EUR 500.000
- 1 of 3 <nav> elements are unlabeledEAA: EUR 1.000 – EUR 500.000
- Skip navigation link is missing (WCAG 2.4.1)EAA: EUR 1.000 – EUR 500.000
Bounce-Rate Cost
€3.793 /mo
+11.7pp bounce · ~1,170 lost visitors/mo
CPC: EUR 3.24
Bandwidth Waste
€1,98 /mo
26784.8 MB/mo × 0.074 EUR/GB
- Optimize transfer: save ~2.7 MB per page loadSaves €1,98/mo
Compliance figures represent the statutory maximum fine for the most severe triggered category, capped per regulation — not the sum of per-finding penalties. Based on published regulatory fine ranges. This is not legal advice.
Unique monthly visitors from your analytics
Purchases, signups, or key actions
Optional — for revenue estimation
more engaged visitors from reduced bounce
Fix 4 critical issues to capture this value
How this is calculated
Based on Google/Deloitte research ("Milliseconds Make Millions") showing a ~7% bounce rate increase per additional second of LCP above the 2.5s "Good" threshold.
Your site's LCP: → estimated after fixes.
These are estimates based on industry research — actual results vary
Your data stays in your browser — nothing is sent to our servers
Lighthouse
Mobile
First Contentful Paint First Contentful Paint — how long until the browser renders the first piece of content. Under 1.8s is good.
2.20 s
Largest Contentful Paint Largest Contentful Paint — how long until the largest visible element loads. Under 2.5s is good.
2.23 s
Total Blocking Time Total Blocking Time — total time the main thread was blocked, preventing user input. Under 200ms is good.
540 ms
Cumulative Layout Shift Cumulative Layout Shift — measures visual stability. How much the page layout shifts during loading. Under 0.1 is good.
0.000
Speed Index Speed Index — how quickly content is visually displayed during load. Under 3.4s is good.
2.20 s
Time to Interactive Time to Interactive — how long until the page is fully interactive and responds to user input. Under 3.8s is good.
7.95 s
Desktop
First Contentful Paint First Contentful Paint — how long until the browser renders the first piece of content. Under 1.8s is good.
931 ms
Largest Contentful Paint Largest Contentful Paint — how long until the largest visible element loads. Under 2.5s is good.
999 ms
Total Blocking Time Total Blocking Time — total time the main thread was blocked, preventing user input. Under 200ms is good.
22 ms
Cumulative Layout Shift Cumulative Layout Shift — measures visual stability. How much the page layout shifts during loading. Under 0.1 is good.
0.034
Speed Index Speed Index — how quickly content is visually displayed during load. Under 3.4s is good.
957 ms
Time to Interactive Time to Interactive — how long until the page is fully interactive and responds to user input. Under 3.8s is good.
1.91 s
Categories
8Performance
Page weighs 10.6 MB (8.5 MB transferred)
Security
HSTS header is missing
Accessibility
2 link(s) with no accessible text
SEO
All checks pass
Infrastructure
All checks pass
Compliance
All checks pass
Content
All checks pass
Sustainability
All checks pass
How you compare
Where this site stands against peers running the same stack.
Top 10% of Apple sites score 86+ on Sustainability; you're at 59 — closing this gap is the highest-leverage improvement.
Technology stack
Alpine.js 3.15.3
Stack Architecture
 Google Analytics
  Google Tag Manager
  Pingdom RUM
  Plausible
  VWO
VWO  Alpine.js 3.15.3Apple
  Boomerang
  HTTP/3 Microsoft
  Open Graph Plausible Analytics
  RSS
RSS All Detected Technologies (13)
Alpine.js is a minimal framework for composing behavior directly in your markup.
boomerang is a JavaScript library that measures the page load time experienced by real users, commonly called RUM (Real User Measurement).
HTTP/3 is the third major version of the Hypertext Transfer Protocol used to exchange information on the World Wide Web.
Open Graph is a protocol that is used to integrate any web page into the social graph.
RSS is a family of web feed formats used to publish frequently updated works—such as blog entries, news headlines, audio, and video—in a standardized format.
Google Analytics is a free web analytics service that tracks and reports website traffic.
Google Tag Manager is a tag management system (TMS) that allows you to quickly and easily update measurement codes and related code fragments collectively known as tags on your website or mobile app.
Pingdom RUM(Real User Monitoring) is a feature of the Pingdom website monitoring and performance testing service. RUM enables you to collect and analyse data on how real users are experiencing your website.
Plausible is an open-source alternative to Google Analytics.
VWO is a website testing and conversion optimisation platform.
Observations (2)
No build tool detected
A framework (Alpine.js) was detected but no bundler was identified. The build tool may not be detectable from output patterns, or the site may use the framework's built-in bundler.
Complex technology stack detected
13 technologies identified. A complex stack increases maintenance burden and attack surface. Consider whether all components are actively needed.
Show your score
Drop this badge on your README, marketing site, or status page. It auto-updates every time the audit re-runs and links back to this report.
This badge auto-updates with your latest scan result.
[](https://beavercheck.com/results/4ac11767-991f-4d42-b1ee-a84728edad84)<a href="https://beavercheck.com/results/4ac11767-991f-4d42-b1ee-a84728edad84"><img src="https://beavercheck.com/badge?url=https%3A%2F%2Fhaproxy.com" alt="BeaverCheck Score"></a>https://beavercheck.com/badge?url=https%3A%2F%2Fhaproxy.comExport & share
Download the audit, share with your team, or grab a fix plan ready to copy into your tracker.
Copies markdown to clipboard
Fix Plan
Three-week roadmap to ship the audit's findings, with one-click copy targets for your tracker.
Three-week fix plan
2 sprints · 3h total → projected B (85)
Sprint 1: Quick Wins
+8Highest ROI — low effort, high impact
- · Page weighs 10.6 MB (8.5 MB transferred)
- · No <main> landmark found
- · HSTS header is missing
- · 2 link(s) with no accessible text
Sprint 2: Core Fixes
+1Medium effort, high structural impact
- · is missing width/height — may cause layout shift