Audit overview
4 categories need attention: Security, and 3 others.
Fix Priority Matrix
5 findingsQuick Wins
3High impact, low effort — start here.
Strategic
2High impact, requires investment.
Easy Improvements
0Small gains, minimal effort.
Nothing in this quadrant — good news.
Deprioritize
0Low impact, high effort — do last.
Nothing in this quadrant — good news.
Screenshots


Top Priorities (5)
Content-Security-Policy header is missing
Without a CSP, a single XSS bug can exfiltrate everything your users type — including credentials.
HSTS header is missing
Without HSTS, a network attacker can downgrade the very first connection to HTTP and steal the user's session.
No Content-Security-Policy header found
Without a CSP, a single XSS bug can exfiltrate everything users type — credentials, payment data, session tokens.
Page weighs 11.1 MB (6.8 MB transferred)
Informational: total page weight (uncompressed) and bytes actually transferred over the wire.
114 third-party resources (100% of weight)
Informational: third-party resource count and their share of page weight. High share caps perf gains from frontend optimization.
Business case
What fixing the audit's findings is worth -- and what ignoring them keeps costing.
Return on investment
$625 investment → $14,307/month returns + USD 7,500 risk avoided
Figures combine localized regulatory fine ceilings, search/conversion value priced against local CPC, and bandwidth waste estimates. Results depend on implementation quality and audience composition. Not legal or financial advice.
Conversion barriers
7 barrier(s) likely increasing bounce by ~30%.
- Page takes 8.2s to loadUsers abandon at ~3s — you're 5.7s over the 2.5s threshold→ Optimize render-blocking resources, preload the hero image, and compress images
- Page feels frozen for 1.0sClicks on the primary CTA are ignored while JavaScript runs→ Break up long tasks; defer non-critical JavaScript to post-hydration
- 9 broken link(s) on the pageClicks land on 404s — trust drops and the session often ends→ Fix or remove the broken destinations surfaced on the Content tab
- No HSTS headerReturning visitors are briefly exposed to downgrade attacks on first request→ Set Strict-Transport-Security: max-age=31536000; includeSubDomains
- No Content-Security-Policy headerHigher XSS blast radius — one compromised script can exfiltrate the checkout form→ Ship a reporting-only CSP first, then enforce once violations are clean
Preliminary CRO audit — each barrier links to the tab with detailed analysis.
Remediation cost
Start here for the best return on investment
Cost by category
Cost by effort level
Adjust assumptions
Team composition
Multiplier applied to dev hours to reflect QA, design, and PM overhead. Use Dev only for solo work; Full team for projects with formal review processes.
Rates reflect fully-loaded developer cost including overhead
Warning:Cost of inaction
Compliance Risk
$7,500
- No privacy policy link detectedCCPA/CPRA: USD 2,500 – USD 7,500
- 1 advertising/retargeting trackers detectedCCPA/CPRA: USD 2,500 – USD 7,500
- Trackers detected but no cookie policy foundCCPA/CPRA: USD 2,500 – USD 7,500
Bounce-Rate Cost
$8,161 /mo
+30.3pp bounce · ~3,034 lost visitors/mo
CPC: USD 2.69
Bandwidth Waste
$1.72 /mo
21494.0 MB/mo × 0.080 USD/GB
- Optimize transfer: save ~2.1 MB per page loadSaves $1.72/mo
Compliance figures represent the statutory maximum fine for the most severe triggered category, capped per regulation — not the sum of per-finding penalties. Based on published regulatory fine ranges. This is not legal advice.
Unique monthly visitors from your analytics
Purchases, signups, or key actions
Optional — for revenue estimation
more engaged visitors from reduced bounce
Fix 4 critical issues to capture this value
How this is calculated
Based on Google/Deloitte research ("Milliseconds Make Millions") showing a ~7% bounce rate increase per additional second of LCP above the 2.5s "Good" threshold.
Your site's LCP: → estimated after fixes.
These are estimates based on industry research — actual results vary
Your data stays in your browser — nothing is sent to our servers
Lighthouse
Mobile
First Contentful Paint First Contentful Paint — how long until the browser renders the first piece of content. Under 1.8s is good.
4.48 s
Largest Contentful Paint Largest Contentful Paint — how long until the largest visible element loads. Under 2.5s is good.
8.16 s
Total Blocking Time Total Blocking Time — total time the main thread was blocked, preventing user input. Under 200ms is good.
1.03 s
Cumulative Layout Shift Cumulative Layout Shift — measures visual stability. How much the page layout shifts during loading. Under 0.1 is good.
0.048
Speed Index Speed Index — how quickly content is visually displayed during load. Under 3.4s is good.
4.48 s
Time to Interactive Time to Interactive — how long until the page is fully interactive and responds to user input. Under 3.8s is good.
19.41 s
Desktop
First Contentful Paint First Contentful Paint — how long until the browser renders the first piece of content. Under 1.8s is good.
1.65 s
Largest Contentful Paint Largest Contentful Paint — how long until the largest visible element loads. Under 2.5s is good.
2.41 s
Total Blocking Time Total Blocking Time — total time the main thread was blocked, preventing user input. Under 200ms is good.
32 ms
Cumulative Layout Shift Cumulative Layout Shift — measures visual stability. How much the page layout shifts during loading. Under 0.1 is good.
0.007
Speed Index Speed Index — how quickly content is visually displayed during load. Under 3.4s is good.
1.71 s
Time to Interactive Time to Interactive — how long until the page is fully interactive and responds to user input. Under 3.8s is good.
4.38 s
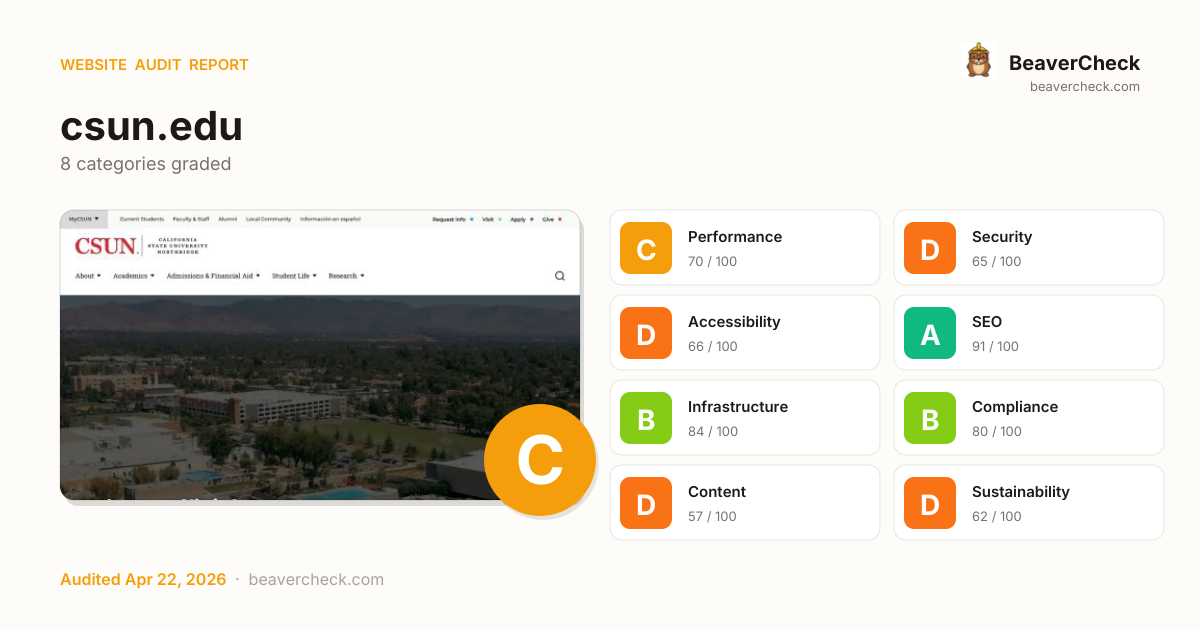
Categories
8Performance
Page weighs 11.1 MB (6.8 MB transferred)
Security
Content-Security-Policy header is missing
Accessibility
All checks pass
SEO
All checks pass
Infrastructure
All checks pass
Compliance
All checks pass
Content
All checks pass
Sustainability
All checks pass
How you compare
Where this site stands against peers running the same stack.
Top 10% of Drupal sites score 92+ on Content; you're at 57 — closing this gap is the highest-leverage improvement.
Top 10% of Amazon Route 53 sites score 96+ on Content; you're at 57 — closing this gap is the highest-leverage improvement.
Technology stack
Drupal 9, on PHP, with F5 BigIP CDN
Stack Architecture
 Crazy Egg
  Facebook Pixel 2.9.303
 Google Analytics
  Google Tag Manager
  Mautic
  Microsoft Clarity
  New Relic
  StackAdapt
  Drupal 9
 Google Font API Google Search Console Microsoft Microsoft 365 Proofpoint
  core-js 3.8.3
 jQuery 3.6.3
 PHP
PHP  F5 BigIP
 All Detected Technologies (23)
F5's BIG-IP is a family of products covering software and hardware designed around application availability, access control, and security solutions.
PHP is a general-purpose scripting language used for web development.
Drupal is a free and open-source web content management framework.
Flickity is a JavaScript slider library, built by David DeSandro of Metafizzy fame.
Google Font API is a web service that supports open-source font files that can be used on your web designs.
core-js is a modular standard library for JavaScript, with polyfills for cutting-edge ECMAScript features.
jQuery is a JavaScript library which is a free, open-source software designed to simplify HTML DOM tree traversal and manipulation, as well as event handling, CSS animation, and Ajax.
Facebook pixel is an analytics tool that allows you to measure the effectiveness of your advertising.
Google Analytics is a free web analytics service that tracks and reports website traffic.
Google Tag Manager is a tag management system (TMS) that allows you to quickly and easily update measurement codes and related code fragments collectively known as tags on your website or mobile app.
Mautic is a free and open-source marketing automation tool for Content Management, Social Media, Email Marketing, and can be used for the integration of social networks, campaign management, forms, questionnaires, reports, etc.
Microsoft's Clarity is a analytics tool which provides website usage statistics, session recording, and heatmaps.
New Relic is a SaaS offering that focuses on performance and availability monitoring.
StackAdapt is a platform that provides a content advertising strategy solution for planning, executing, and optimizing digital campaigns.
Observations (3)
No build tool detected
A framework (Amazon Route 53) was detected but no bundler was identified. The build tool may not be detectable from output patterns, or the site may use the framework's built-in bundler.
Drupal version may be outdated
Detected Drupal 9. The current major version is 10. Consider updating for security patches and new features.
Complex technology stack detected
23 technologies identified. A complex stack increases maintenance burden and attack surface. Consider whether all components are actively needed.
Show your score
Drop this badge on your README, marketing site, or status page. It auto-updates every time the audit re-runs and links back to this report.
This badge auto-updates with your latest scan result.
[](https://beavercheck.com/results/4bb70c57-e278-42fe-8b77-888316aa4d91)<a href="https://beavercheck.com/results/4bb70c57-e278-42fe-8b77-888316aa4d91"><img src="https://beavercheck.com/badge?url=https%3A%2F%2Fcsun.edu" alt="BeaverCheck Score"></a>https://beavercheck.com/badge?url=https%3A%2F%2Fcsun.eduExport & share
Download the audit, share with your team, or grab a fix plan ready to copy into your tracker.
Copies markdown to clipboard
Fix Plan
Three-week roadmap to ship the audit's findings, with one-click copy targets for your tracker.
Three-week fix plan
2 sprints · 6h total → projected B (81)
Sprint 1: Quick Wins
+6Highest ROI — low effort, high impact
- · Page weighs 11.1 MB (6.8 MB transferred)
- · HSTS header is missing
- · 114 third-party resources (100% of weight)
Sprint 2: Core Fixes
+3Medium effort, high structural impact
- · Content-Security-Policy header is missing
- · No Content-Security-Policy header found