United Stated · New York Completed: Apr 4, 2026 16:51 UTC
Mobile 375 × 812

Desktop 1440 × 900
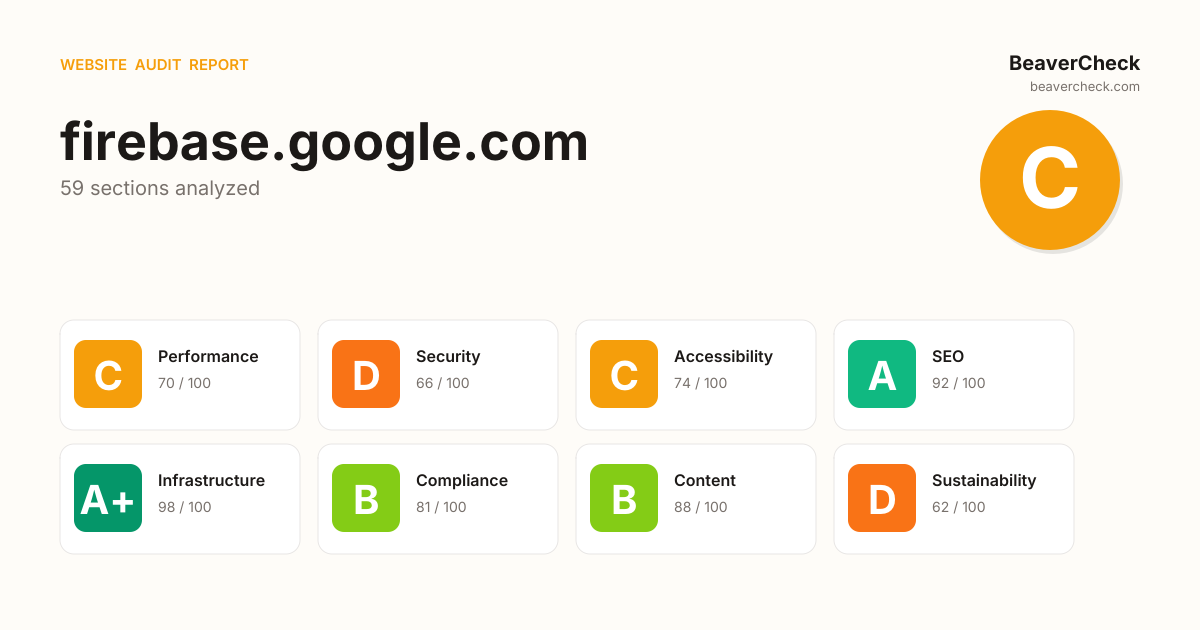
Score: 76 / 100
Based on 8 categories, 0 sections
The overall score is a weighted average of individual category scores. Categories with more impact on user experience and security carry more weight.
Weights reflect general web best practices. Individual needs may differ.
'unsafe-eval' found in script source
'unsafe-inline' found in script source
Page weighs 25.4 MB (17.4 MB transferred)
3 link(s) with no accessible text
is missing width/height — may cause layout shift
[](https://beavercheck.com/results/4d1b5e70-26db-445d-9935-09344c36ac5e)<a href="https://beavercheck.com/results/4d1b5e70-26db-445d-9935-09344c36ac5e"><img src="https://beavercheck.com/badge?url=https%3A%2F%2Ffirebase.google.com" alt="BeaverCheck Score"></a>https://beavercheck.com/badge?url=https%3A%2F%2Ffirebase.google.comThis badge auto-updates with your latest scan result.
Thanks for your feedback!
Industry-standard audits powered by Google Lighthouse.
Key metrics that affect user experience.
First Contentful Paint First Contentful Paint — how long until the browser renders the first piece of content. Under 1.8s is good.
6.30 s
Largest Contentful Paint Largest Contentful Paint — how long until the largest visible element loads. Under 2.5s is good.
55.60 s
Total Blocking Time Total Blocking Time — total time the main thread was blocked, preventing user input. Under 200ms is good.
1.21 s
Cumulative Layout Shift Cumulative Layout Shift — measures visual stability. How much the page layout shifts during loading. Under 0.1 is good.
0.000
Speed Index Speed Index — how quickly content is visually displayed during load. Under 3.4s is good.
6.30 s
Time to Interactive Time to Interactive — how long until the page is fully interactive and responds to user input. Under 3.8s is good.
74.98 s
Audit breakdown by category with detailed findings.
Remove large, duplicate JavaScript modules from bundles to reduce unnecessary bytes consumed by network activity.
Polyfills and transforms enable older browsers to use new JavaScript features. However, many aren't necessary for modern browsers. Consider modifying your JavaScript build process to not transpile Baseline features, unless you know you must support older browsers. Learn why most sites can deploy ES6+ code without transpiling
3rd party code can significantly impact load performance. Reduce and defer loading of 3rd party code to prioritize your page's content.
Consider setting font-display to swap or optional to ensure text is consistently visible. swap can be further optimized to mitigate layout shifts with font metric overrides.
A forced reflow occurs when JavaScript queries geometric properties (such as offsetWidth) after styles have been invalidated by a change to the DOM state. This can result in poor performance. Learn more about forced reflows and possible mitigations.
Reducing the download time of images can improve the perceived load time of the page and LCP. Learn more about optimizing image size
| URL | Resource Size | Est Savings | |
|---|---|---|---|
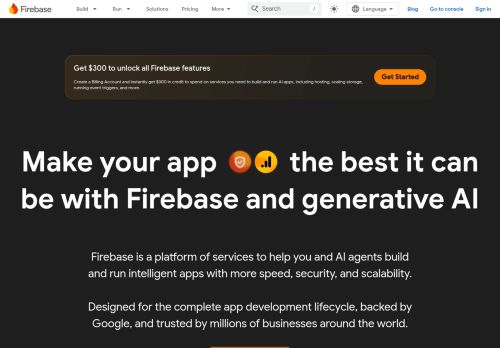
div.homepage-hero__content > div.homepage-hero__body > h1#make-your-app-the-best-it-can-be-with-firebase-and-generative-ai > video div.homepage-hero__content > div.homepage-hero__body > h1#make-your-app-the-best-it-can-be-with-firebase-and-generative-ai > video | firebase.google.com/images/homepage/Google_Firebase_LogotoIcon_Black_V01.gif | 8.7 MiB | 8.7 MiB |
Android Studiologo div.logo-row__container > div.logo-row__logo > a.gc-analytics-event > img | firebase.google.com/static/images/integrations/android-studio.png | 13.6 KiB | 13.6 KiB |
Slacklogo div.logo-row__container > div.logo-row__logo > a.gc-analytics-event > img | firebase.google.com/static/images/integrations/slack.png | 6.7 KiB | 6.7 KiB |
Avoid chaining critical requests by reducing the length of chains, reducing the download size of resources, or deferring the download of unnecessary resources to improve page load.
Requests are blocking the page's initial render, which may delay LCP. Deferring or inlining can move these network requests out of the critical path.
| URL | Transfer Size | Duration |
|---|---|---|
| fonts.googleapis.com/css?family=Google+Sans:400,500,600,700 | 2.5 KiB | |
| /devrel-devsite/prod/vb4124e0eb36966d1f5cf3a7ca116e70a424... | 154.4 KiB | 3.9 s |
| /css?family=Google+Sans:400,500|Roboto:400,400italic,500,... | 3.3 KiB | 792 ms |
| /css2?family=Material+Icons&family=Material+Symbols+Outli... | 588 B | 157 ms |
| /css2?family=JetBrains+Mono:ital,wght@0,100..800;1,100..8... | 1.1 KiB |
These insights are also available in the Chrome DevTools Performance Panel - record a trace to view more detailed information.
Time to Interactive is the amount of time it takes for the page to become fully interactive. Learn more about the Time to Interactive metric.
The maximum potential First Input Delay that your users could experience is the duration of the longest task. Learn more about the Maximum Potential First Input Delay metric.
Reduce unused rules from stylesheets and defer CSS not used for above-the-fold content to decrease bytes consumed by network activity. Learn how to reduce unused CSS.
| URL | Transfer Size | Est Savings |
|---|---|---|
| /devrel-devsite/prod/vb4124e0eb36966d1f5cf3a7ca116e70a424... | 153.9 KiB | 134.7 KiB |
| /* Styles inlined from /styles/main.css */ @font-face{font-family:'GMP Icons'; … } … | 64.9 KiB | 61.8 KiB |
Reduce unused JavaScript and defer loading scripts until they are required to decrease bytes consumed by network activity. Learn how to reduce unused JavaScript.
| URL | Transfer Size | Est Savings |
|---|---|---|
| /devrel-devsite/prod/vb4124e0eb36966d1f5cf3a7ca116e70a424... | 302.4 KiB | 157.2 KiB |
| www.googletagmanager.com/gtm.js?id=GTM-KFPLMHC | 154.0 KiB | 85.2 KiB |
| www.googletagmanager.com/gtm.js?id=GTM-N84485 | 138.9 KiB | 61.6 KiB |
| www.googletagmanager.com/gtag/js?id=G-64EQFFKSHW&l=atDataLayer&cx=c>m=4e6411 | 141.9 KiB | 60.3 KiB |
| www.googletagmanager.com/gtm.js?id=GTM-NDV7K7V5&l=atDataLayer | 128.9 KiB | 60.0 KiB |
| www.googletagmanager.com/gtag/js?id=G-CW55HF8NVT&cx=c>m=4e6411 | 146.7 KiB | 59.3 KiB |
| /devrel-devsite/prod/vb4124e0eb36966d1f5cf3a7ca116e70a424... | 58.3 KiB | 27.5 KiB |
Consider reducing the time spent parsing, compiling, and executing JS. You may find delivering smaller JS payloads helps with this. Learn how to reduce Javascript execution time.
| URL | Total CPU Time | Script Evaluation | Script Parse |
|---|---|---|---|
| Unattributable | 1.9 s | 154 ms | 0.0 ms |
| firebase.google.com/ | 1.6 s | 34 ms | 2.6 ms |
| /devrel-devsite/prod/vb4124e0eb36966d1f5cf3a7ca116e70a424... | 602 ms | 310 ms | 37 ms |
| /devrel-devsite/prod/vb4124e0eb36966d1f5cf3a7ca116e70a424... | 419 ms | 200 ms | 162 ms |
| www.googletagmanager.com/gtm.js?id=GTM-N84485 | 397 ms | 337 ms | 54 ms |
| www.googletagmanager.com/gtag/js?id=G-CW55HF8NVT&cx=c>m=4e6411 | 321 ms | 267 ms | 51 ms |
| www.googletagmanager.com/gtm.js?id=GTM-KFPLMHC | 315 ms | 243 ms | 56 ms |
| www.googletagmanager.com/gtag/js?id=G-64EQFFKSHW&l=atDataLayer&cx=c>m=4e6411 | 305 ms | 247 ms | 55 ms |
| www.googletagmanager.com/gtm.js?id=GTM-NDV7K7V5&l=atDataLayer | 256 ms | 204 ms | 49 ms |
| /devrel-devsite/prod/vb4124e0eb36966d1f5cf3a7ca116e70a424... | 117 ms | 42 ms | 1.2 ms |
| /devrel-devsite/prod/vb4124e0eb36966d1f5cf3a7ca116e70a424... | 99 ms | 40 ms | 2.0 ms |
| /devrel-devsite/prod/vb4124e0eb36966d1f5cf3a7ca116e70a424... | 80 ms | 0.0 ms | 0.0 ms |
Consider reducing the time spent parsing, compiling and executing JS. You may find delivering smaller JS payloads helps with this. Learn how to minimize main-thread work
| Category | Time Spent |
|---|---|
| Script Evaluation | 2.5 s |
| Other | 2.2 s |
| Style & Layout | 1.2 s |
| Script Parsing & Compilation | 515 ms |
| Rendering | 206 ms |
| Parse HTML & CSS | 191 ms |
| Garbage Collection | 81 ms |
Large network payloads cost users real money and are highly correlated with long load times. Learn how to reduce payload sizes.
Set an explicit width and height on image elements to reduce layout shifts and improve CLS. Learn how to set image dimensions
| URL | |
|---|---|
Android Studiologo div.logo-row__container > div.logo-row__logo > a.gc-analytics-event > img | firebase.google.com/static/images/integrations/android-studio.png |
Slacklogo div.logo-row__container > div.logo-row__logo > a.gc-analytics-event > img | firebase.google.com/static/images/integrations/slack.png |
Google Playlogo div.logo-row__container > div.logo-row__logo > a.gc-analytics-event > img | firebase.google.com/static/images/integrations/playstore.png |
Flutterlogo div.logo-row__container > div.logo-row__logo > a.gc-analytics-event > img | firebase.google.com/static/images/integrations/flutter.png |
Firebase AI Logic icon a > div.highlights-row__card > div.highlights-row__image-wrapper > img.highlights-row__image | firebase.google.com/static/images/icons/firebase-ai-logic.svg |
Google Adslogo div.logo-row__container > div.logo-row__logo > a.gc-analytics-event > img | firebase.google.com/static/images/integrations/google-ads.svg |
AdMoblogo div.logo-row__container > div.logo-row__logo > a.gc-analytics-event > img | firebase.google.com/static/images/integrations/ad-mob.svg |
Google Marketing Platformlogo div.logo-row__container > div.logo-row__logo > a.gc-analytics-event > img | firebase.google.com/static/images/integrations/google-marketing-platform.svg |
BigQuerylogo div.logo-row__container > div.logo-row__logo > a.gc-analytics-event > img | firebase.google.com/static/images/integrations/bigquery.svg |
Agent Skills icon a > div.highlights-row__card > div.highlights-row__image-wrapper > img.highlights-row__image | firebase.google.com/static/images/icons/firebase-agent-skills.svg |
Genkit icon a > div.highlights-row__card > div.highlights-row__image-wrapper > img.highlights-row__image | firebase.google.com/static/images/products/icons/build_genkit_white.svg |
Jiralogo div.logo-row__container > div.logo-row__logo > a.gc-analytics-event > img | firebase.google.com/static/images/integrations/jira.svg |
Looker Studiologo div.logo-row__container > div.logo-row__logo > a.gc-analytics-event > img | firebase.google.com/static/images/integrations/lookerstudio.svg |
Stream to BigQuery icon a > div.highlights-row__card > div.highlights-row__image-wrapper > img.highlights-row__image | |
Search with Algolia icon a > div.highlights-row__card > div.highlights-row__image-wrapper > img.highlights-row__image | |
Run Payments with Stripe icon a > div.highlights-row__card > div.highlights-row__image-wrapper > img.highlights-row__image |
More information about the performance of your application. These numbers don't directly affect the Performance score.
These checks highlight opportunities to improve the accessibility of your web app. Automatic detection can only detect a subset of issues and does not guarantee the accessibility of your web app, so manual testing is also encouraged.
Screen reader users rely on frame titles to describe the contents of frames. Learn more about frame titles.
| Failing Elements |
|---|
div > div.code-picker > devsite-iframe > iframe div > div.code-picker > devsite-iframe > iframe |
These are opportunities to improve the semantics of the controls in your application. This may enhance the experience for users of assistive technology, like a screen reader.
Properly ordered headings that do not skip levels convey the semantic structure of the page, making it easier to navigate and understand when using assistive technologies. Learn more about heading order.
| Failing Elements |
|---|
Easily integrate Firebase with Gemini and the latest AI technology from Google div.highlights-row-wrapper > div.highlights-row__content > div.content > h3#easily-integrate-firebase-with-gemini-and-the-latest-ai-technology-from-google |
These are opportunities to improve keyboard navigation in your application.
Errors logged to the console indicate unresolved problems. They can come from network request failures and other browser concerns. Learn more about this errors in console diagnostic audit
| Source | Description |
|---|---|
Failed to load resource: the server responded with a status of 503 (Service Unavailable) |
These checks ensure that your page is following basic search engine optimization advice. There are many additional factors Lighthouse does not score here that may affect your search ranking, including performance on Core Web Vitals. Learn more about Google Search Essentials.
Descriptive link text helps search engines understand your content. Learn how to make links more accessible.
| Link destination | Link Text |
|---|---|
| firebase.google.com/integrations | Learn more |
| firebase.blog/posts/2026/03/nextjs-adapters | Read more |
| /firebase-developers/streaming-made-easy-with-genkit-a6f9... | Read more |
Format your HTML in a way that enables crawlers to better understand your app’s content.
Industry-standard audits powered by Google Lighthouse. — Desktop
Key metrics that affect user experience. — Desktop
First Contentful Paint First Contentful Paint — how long until the browser renders the first piece of content. Under 1.8s is good.
779 ms
Largest Contentful Paint Largest Contentful Paint — how long until the largest visible element loads. Under 2.5s is good.
1.13 s
Total Blocking Time Total Blocking Time — total time the main thread was blocked, preventing user input. Under 200ms is good.
63 ms
Cumulative Layout Shift Cumulative Layout Shift — measures visual stability. How much the page layout shifts during loading. Under 0.1 is good.
0.001
Speed Index Speed Index — how quickly content is visually displayed during load. Under 3.4s is good.
1.18 s
Time to Interactive Time to Interactive — how long until the page is fully interactive and responds to user input. Under 3.8s is good.
3.61 s
Audit breakdown by category with detailed findings.
Remove large, duplicate JavaScript modules from bundles to reduce unnecessary bytes consumed by network activity.
Polyfills and transforms enable older browsers to use new JavaScript features. However, many aren't necessary for modern browsers. Consider modifying your JavaScript build process to not transpile Baseline features, unless you know you must support older browsers. Learn why most sites can deploy ES6+ code without transpiling
3rd party code can significantly impact load performance. Reduce and defer loading of 3rd party code to prioritize your page's content.
Consider setting font-display to swap or optional to ensure text is consistently visible. swap can be further optimized to mitigate layout shifts with font metric overrides.
A forced reflow occurs when JavaScript queries geometric properties (such as offsetWidth) after styles have been invalidated by a change to the DOM state. This can result in poor performance. Learn more about forced reflows and possible mitigations.
Avoid chaining critical requests by reducing the length of chains, reducing the download size of resources, or deferring the download of unnecessary resources to improve page load.
Requests are blocking the page's initial render, which may delay LCP. Deferring or inlining can move these network requests out of the critical path.
Reducing the download time of images can improve the perceived load time of the page and LCP. Learn more about optimizing image size
| URL | Resource Size | Est Savings | |
|---|---|---|---|
div.homepage-hero__content > div.homepage-hero__body > h1#make-your-app-the-best-it-can-be-with-firebase-and-generative-ai > video div.homepage-hero__content > div.homepage-hero__body > h1#make-your-app-the-best-it-can-be-with-firebase-and-generative-ai > video | firebase.google.com/images/homepage/Google_Firebase_LogotoIcon_Black_V01.gif | 8.7 MiB | 8.8 MiB |
Stream to BigQuery
Search with Algolia
Run Payments with Stripe div.content-wrapper > section.highlights-row > div.highlights-row-wrapper > div.highlights-row__highlights | firebase.google.com/images/backgrounds/firebase-gradient.png | 3.2 MiB | 3.0 MiB |
Android Studiologo div.logo-row__container > div.logo-row__logo > a.gc-analytics-event > img | firebase.google.com/static/images/integrations/android-studio.png | 13.6 KiB | 13.6 KiB |
Slacklogo div.logo-row__container > div.logo-row__logo > a.gc-analytics-event > img | firebase.google.com/static/images/integrations/slack.png | 6.7 KiB | 6.7 KiB |
These insights are also available in the Chrome DevTools Performance Panel - record a trace to view more detailed information.
Time to Interactive is the amount of time it takes for the page to become fully interactive. Learn more about the Time to Interactive metric.
Reduce unused rules from stylesheets and defer CSS not used for above-the-fold content to decrease bytes consumed by network activity. Learn how to reduce unused CSS.
| URL | Transfer Size | Est Savings |
|---|---|---|
| /devrel-devsite/prod/vb4124e0eb36966d1f5cf3a7ca116e70a424... | 153.9 KiB | 135.7 KiB |
| /* Styles inlined from /styles/main.css */ @font-face{font-family:'GMP Icons'; … } … | 65.0 KiB | 60.5 KiB |
Reduce unused JavaScript and defer loading scripts until they are required to decrease bytes consumed by network activity. Learn how to reduce unused JavaScript.
| URL | Transfer Size | Est Savings |
|---|---|---|
| /devrel-devsite/prod/vb4124e0eb36966d1f5cf3a7ca116e70a424... | 302.4 KiB | 156.3 KiB |
| www.googletagmanager.com/gtm.js?id=GTM-KFPLMHC | 153.5 KiB | 84.8 KiB |
| www.googletagmanager.com/gtm.js?id=GTM-N84485 | 139.3 KiB | 62.3 KiB |
| www.googletagmanager.com/gtag/js?id=G-64EQFFKSHW&l=atDataLayer&cx=c>m=4e6411 | 142.0 KiB | 60.8 KiB |
| www.googletagmanager.com/gtm.js?id=GTM-NDV7K7V5&l=atDataLayer | 128.9 KiB | 60.0 KiB |
| www.googletagmanager.com/gtag/js?id=G-CW55HF8NVT&cx=c>m=4e6420h2 | 147.3 KiB | 59.5 KiB |
| /devrel-devsite/prod/vb4124e0eb36966d1f5cf3a7ca116e70a424... | 58.3 KiB | 27.1 KiB |
Large network payloads cost users real money and are highly correlated with long load times. Learn how to reduce payload sizes.
Set an explicit width and height on image elements to reduce layout shifts and improve CLS. Learn how to set image dimensions
| URL | |
|---|---|
Android Studiologo div.logo-row__container > div.logo-row__logo > a.gc-analytics-event > img | firebase.google.com/static/images/integrations/android-studio.png |
Slacklogo div.logo-row__container > div.logo-row__logo > a.gc-analytics-event > img | firebase.google.com/static/images/integrations/slack.png |
Google Playlogo div.logo-row__container > div.logo-row__logo > a.gc-analytics-event > img | firebase.google.com/static/images/integrations/playstore.png |
Flutterlogo div.logo-row__container > div.logo-row__logo > a.gc-analytics-event > img | firebase.google.com/static/images/integrations/flutter.png |
Run Payments with Stripe icon a > div.highlights-row__card > div.highlights-row__image-wrapper > img.highlights-row__image | www.gstatic.com/mobilesdk/200629_mobilesdk/stripe_subscriptions_120@2x.png |
Firebase AI Logic icon a > div.highlights-row__card > div.highlights-row__image-wrapper > img.highlights-row__image | firebase.google.com/static/images/icons/firebase-ai-logic.svg |
Google Adslogo div.logo-row__container > div.logo-row__logo > a.gc-analytics-event > img | firebase.google.com/static/images/integrations/google-ads.svg |
AdMoblogo div.logo-row__container > div.logo-row__logo > a.gc-analytics-event > img | firebase.google.com/static/images/integrations/ad-mob.svg |
Google Marketing Platformlogo div.logo-row__container > div.logo-row__logo > a.gc-analytics-event > img | firebase.google.com/static/images/integrations/google-marketing-platform.svg |
BigQuerylogo div.logo-row__container > div.logo-row__logo > a.gc-analytics-event > img | firebase.google.com/static/images/integrations/bigquery.svg |
Agent Skills icon a > div.highlights-row__card > div.highlights-row__image-wrapper > img.highlights-row__image | firebase.google.com/static/images/icons/firebase-agent-skills.svg |
Genkit icon a > div.highlights-row__card > div.highlights-row__image-wrapper > img.highlights-row__image | firebase.google.com/static/images/products/icons/build_genkit_white.svg |
Jiralogo div.logo-row__container > div.logo-row__logo > a.gc-analytics-event > img | firebase.google.com/static/images/integrations/jira.svg |
Search with Algolia icon a > div.highlights-row__card > div.highlights-row__image-wrapper > img.highlights-row__image | firebase.google.com/static/images/products/mods/algolia-search.svg |
Stream to BigQuery icon a > div.highlights-row__card > div.highlights-row__image-wrapper > img.highlights-row__image | firebase.google.com/static/images/products/mods/bigquery-export.svg |
Looker Studiologo div.logo-row__container > div.logo-row__logo > a.gc-analytics-event > img | firebase.google.com/static/images/integrations/lookerstudio.svg |
More information about the performance of your application. These numbers don't directly affect the Performance score.
These checks highlight opportunities to improve the accessibility of your web app. Automatic detection can only detect a subset of issues and does not guarantee the accessibility of your web app, so manual testing is also encouraged.
Screen reader users rely on frame titles to describe the contents of frames. Learn more about frame titles.
| Failing Elements |
|---|
div > div.code-picker > devsite-iframe > iframe div > div.code-picker > devsite-iframe > iframe |
These are opportunities to improve the semantics of the controls in your application. This may enhance the experience for users of assistive technology, like a screen reader.
Properly ordered headings that do not skip levels convey the semantic structure of the page, making it easier to navigate and understand when using assistive technologies. Learn more about heading order.
| Failing Elements |
|---|
Easily integrate Firebase with Gemini and the latest AI technology from Google div.highlights-row-wrapper > div.highlights-row__content > div.content > h3#easily-integrate-firebase-with-gemini-and-the-latest-ai-technology-from-google |
These are opportunities to improve keyboard navigation in your application.
Visible text labels that do not match the accessible name can result in a confusing experience for screen reader users. Learn more about accessible names.
| Failing Elements |
|---|
More devsite-tabs.upper-tabs > nav.devsite-tabs-wrapper > tab.devsite-overflow-tab > button#tab-overflow-button-gUoG |
Image display dimensions should match natural aspect ratio. Learn more about image aspect ratio.
| URL | Aspect Ratio (Displayed) | Aspect Ratio (Actual) | |
|---|---|---|---|
Run Payments with Stripe icon a > div.highlights-row__card > div.highlights-row__image-wrapper > img.highlights-row__image | www.gstatic.com/mobilesdk/200629_mobilesdk/stripe_subscriptions_120@2x.png | 120 x 240 (0.50) | 240 x 240 (1.00) |
Errors logged to the console indicate unresolved problems. They can come from network request failures and other browser concerns. Learn more about this errors in console diagnostic audit
| Source | Description |
|---|---|
Access to fetch at 'https://cgc-ui-boq-autopush.corp.google.com/__/pingz?platform=devsite&page=%2F&ifgr=true' from origin 'https://firebase.google.com' has been blocked by CORS policy: No 'Access-Control-Allow-Origin' header is present on the requested resource. | |
Failed to load resource: net::ERR_FAILED |
These checks ensure that your page is following basic search engine optimization advice. There are many additional factors Lighthouse does not score here that may affect your search ranking, including performance on Core Web Vitals. Learn more about Google Search Essentials.
Descriptive link text helps search engines understand your content. Learn how to make links more accessible.
| Link destination | Link Text |
|---|---|
| firebase.google.com/integrations | Learn more |
| firebase.blog/posts/2026/03/nextjs-adapters | Read more |
| /firebase-developers/streaming-made-easy-with-genkit-a6f9... | Read more |
Format your HTML in a way that enables crawlers to better understand your app’s content.
Send Feedback