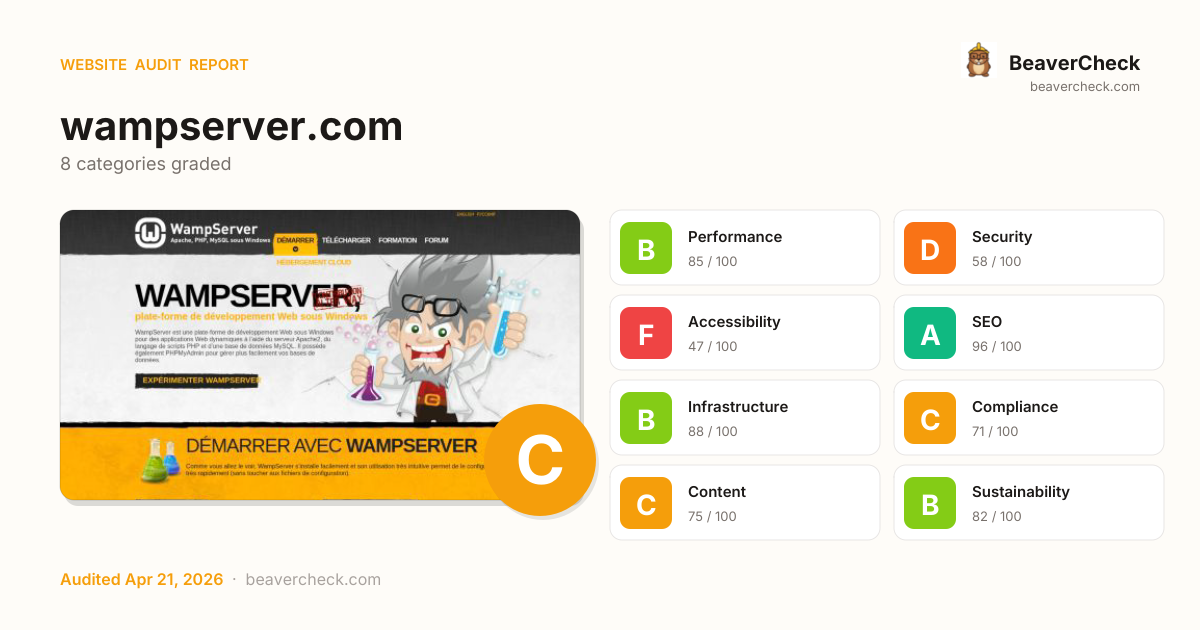
URL substituted: You submitted https://wampserver.com but we scanned https://www.wampserver.com instead — the HTTPS certificate on the submitted hostname didn't cover that name, so we retried on the www. variant
Mobile 375 × 812

Desktop 1440 × 900

Score: 72 / 100
Based on 8 categories, 0 sections
Fast site — your users get a smooth experience.
Several missing protections leave your users and data exposed.
Major barriers for users with disabilities — up to 15% of your audience.
Well-optimized for search — your content is discoverable.
Solid infrastructure — fast server responses across the board.
Mostly compliant — a few items need attention.
Good content signals with minor gaps.
Reasonable footprint with room for optimization.
The overall score is a weighted average of individual category scores. Categories with more impact on user experience and security carry more weight.
Weights reflect general web best practices. Individual needs may differ.
Content-Security-Policy header is missing
Security gaps expose your site and users to attacks, eroding trust.
Cookie '_icl_current_language' is missing the Secure flag
Security gaps expose your site and users to attacks, eroding trust.
No Content-Security-Policy header found
Security gaps expose your site and users to attacks, eroding trust.
1 image(s) missing alt attribute
Accessibility issues exclude users with disabilities — up to 15% of your potential audience.
13 control(s) without accessible label
Accessibility issues exclude users with disabilities — up to 15% of your potential audience.
High impact, low effort — start here.
High impact, requires investment.
Small gains, minimal effort.
Nothing in this quadrant — good news.
Low impact, high effort — do last.
Nothing in this quadrant — good news.
[](https://beavercheck.com/results/4dd4b986-9461-40e6-b3b0-4dc86a37dc64)<a href="https://beavercheck.com/results/4dd4b986-9461-40e6-b3b0-4dc86a37dc64"><img src="https://beavercheck.com/badge?url=https%3A%2F%2Fwampserver.com" alt="BeaverCheck Score"></a>https://beavercheck.com/badge?url=https%3A%2F%2Fwampserver.comThis badge auto-updates with your latest scan result.
Your site performs reasonably well, but a few targeted fixes could meaningfully improve results. Accessibility issues exclude users who rely on assistive technology — an estimated 15% of your potential audience. Addressing the critical issues below would have the most immediate impact on your user trust.
7 barrier(s) likely increasing bounce by ~30%.
Page loads in 3.3s
+5% bounceEvery additional 100ms above 2.5s costs conversions — you're 816ms over
Fix: Target <2.5s LCP: defer non-critical scripts and optimize the hero image
Mixed content on HTTPS page
+8% bounceBrowsers block insecure subresources — broken images, missing scripts, warning badge
Fix: Change http:// URLs inside the page to https:// (or protocol-relative)
No Content-Security-Policy header
+1% bounceHigher XSS blast radius — one compromised script can exfiltrate the checkout form
Fix: Ship a reporting-only CSP first, then enforce once violations are clean
13 form field(s) without a label
+6% bounceScreen readers skip unlabeled fields; autofill can't identify them; checkout abandonment spikes
Fix: Associate every input with a visible <label for="…">; add autocomplete attributes
8 link(s) with generic text ("click here", "read more")
+1% bounceScreen-reader users navigating by link list see no context — and search engines can't infer relevance
Fix: Rewrite with descriptive phrases that identify the destination
No skip-to-content link
+1% bounceKeyboard and screen-reader users must tab through the entire header on every page
Fix: Add a visible-on-focus <a href="#main">Skip to content</a> as the first focusable element
5 broken link(s) on the page
+5% bounceClicks land on 404s — trust drops and the session often ends
Fix: Fix or remove the broken destinations surfaced on the Content tab
Preliminary CRO audit — each barrier links to the tab with detailed analysis.
€360 investment → €1,257/month returns + EUR 120,500,000 risk avoided
€360
4h · 5 findings
€1,257 /mo
~€15,080 / year
EUR 120,500,000
if kept compliant
€120 — in quick wins — start here for the fastest payback
Figures combine localized regulatory fine ceilings, search/conversion value priced against local CPC, and bandwidth waste estimates. Results depend on implementation quality and audience composition. Not legal or financial advice.
4.5 developer hours at €80/hr
Based on France rates (€80/hr)
Start here for the best return on investment
€10,041,667 / month at risk
~€120,500,003 / year if left unfixed
€120,500,000
+9 more
€0.26 /mo
3482.0 MB/mo × 0.074 EUR/GB
Compliance figures represent the statutory maximum fine for the most severe triggered category, capped per regulation — not the sum of per-finding penalties. Based on published regulatory fine ranges. This is not legal advice.
Unique monthly visitors from your analytics
Purchases, signups, or key actions
Optional — for revenue estimation
more engaged visitors from reduced bounce
Fix 5 critical issues to capture this value
Based on Google/Deloitte research ("Milliseconds Make Millions") showing a ~7% bounce rate increase per additional second of LCP above the 2.5s "Good" threshold.
Your site's LCP: → estimated after fixes.
These are estimates based on industry research — actual results vary
Your data stays in your browser — nothing is sent to our servers
Thanks for your feedback!
We'll use a cached audit if available, or offer to scan.
Industry-standard audits powered by Google Lighthouse.
Key metrics that affect user experience.
First Contentful Paint First Contentful Paint — how long until the browser renders the first piece of content. Under 1.8s is good.
2.03 s
Largest Contentful Paint Largest Contentful Paint — how long until the largest visible element loads. Under 2.5s is good.
3.32 s
Total Blocking Time Total Blocking Time — total time the main thread was blocked, preventing user input. Under 200ms is good.
95 ms
Cumulative Layout Shift Cumulative Layout Shift — measures visual stability. How much the page layout shifts during loading. Under 0.1 is good.
0.000
Speed Index Speed Index — how quickly content is visually displayed during load. Under 3.4s is good.
3.72 s
Time to Interactive Time to Interactive — how long until the page is fully interactive and responds to user input. Under 3.8s is good.
6.23 s
Audit breakdown by category with detailed findings.
Remove large, duplicate JavaScript modules from bundles to reduce unnecessary bytes consumed by network activity.
Performance issues directly impact user engagement and conversion rates.
Polyfills and transforms enable older browsers to use new JavaScript features. However, many aren't necessary for modern browsers. Consider modifying your JavaScript build process to not transpile Baseline features, unless you know you must support older browsers. Learn why most sites can deploy ES6+ code without transpiling
Shipping ES5 transpiled code to modern browsers wastes bytes — every user with an evergreen browser pays for compatibility you don't need.
Most users today run browsers that natively support ES6+, async/await, optional chaining, and the rest of modern JavaScript. Transpiling to ES5 'just in case' adds 20-40% to your bundle for no benefit. Configure your build to target a modern browserslist, or ship a differential bundle pair (modern + legacy) with the module/nomodule pattern.
Source: Google web.dev / Lighthouse
3rd party code can significantly impact load performance. Reduce and defer loading of 3rd party code to prioritize your page's content.
Performance issues directly impact user engagement and conversion rates.
A long cache lifetime can speed up repeat visits to your page. Learn more about caching.
Performance issues directly impact user engagement and conversion rates.
Reducing the download time of images can improve the perceived load time of the page and LCP. Learn more about optimizing image size
Performance issues directly impact user engagement and conversion rates.
| URL | Resource Size | Est Savings | |
|---|---|---|---|
div#home > div#home-inner > div#home-group > div.wamp_character div#home > div#home-inner > div#home-group > div.wamp_character | www.wampserver.com/wp-content/themes/wampserver/img/illustration-contrib.png | 166.8 KiB | 113.9 KiB |
TÉLÉCHARGEMENTS
WampServer est disponible gratuitement (sous licence GPL) en d… div#page > div#download-wrapper > div.ancre > div#download | www.wampserver.com/wp-content/themes/wampserver/img/fond_download.png | 104.2 KiB | 70.2 KiB |
div#download > div#download-inner > div#download-group > div.picto div#download > div#download-inner > div#download-group > div.picto | www.wampserver.com/wp-content/themes/wampserver/img/picto-sprite.png | 72.0 KiB | 61.2 KiB |
CRÉDITS
Auteur :
Romain Bourdon
Mainteneur / Roadmap :
Dominique Ottello
Modéra… div#footer-wrapper > div.ancre > div#footer > div#footer-inner | www.wampserver.com/wp-content/themes/wampserver/img/bloc-don.png | 33.4 KiB | 25.8 KiB |
div#formations > div#formations-inner > div#formations-group > div.wamp_character div#formations > div#formations-inner > div#formations-group > div.wamp_character | www.wampserver.com/wp-content/themes/wampserver/img/pingouin.png | 54.4 KiB | 23.1 KiB |
ENGLISH, РУССКИЙ
DÉMARRER
TÉLÉCHARGER
FORMATION
FORUM
HÉBERGEMENT CLOUD body.home > div#header | www.wampserver.com/wp-content/themes/wampserver/img/bg-header.png | 56.4 KiB | 19.6 KiB |
Wamp Server div#header-group > div#logo > a.home > img | www.wampserver.com/wp-content/themes/wampserver/img/logo.png | 9.5 KiB | 4.7 KiB |
Optimize LCP by making the LCP image discoverable from the HTML immediately, and avoiding lazy-loading
Performance issues directly impact user engagement and conversion rates.
Avoid chaining critical requests by reducing the length of chains, reducing the download size of resources, or deferring the download of unnecessary resources to improve page load.
Performance issues directly impact user engagement and conversion rates.
Requests are blocking the page's initial render, which may delay LCP. Deferring or inlining can move these network requests out of the critical path.
Performance issues directly impact user engagement and conversion rates.
Tap interactions may be delayed by up to 300 ms if the viewport is not optimized for mobile.
Performance issues directly impact user engagement and conversion rates.
head > meta head > meta |
These insights are also available in the Chrome DevTools Performance Panel - record a trace to view more detailed information.
Time to Interactive is the amount of time it takes for the page to become fully interactive. Learn more about the Time to Interactive metric.
Performance issues directly impact user engagement and conversion rates.
The maximum potential First Input Delay that your users could experience is the duration of the longest task. Learn more about the Maximum Potential First Input Delay metric.
Performance issues directly impact user engagement and conversion rates.
Reduce unused JavaScript and defer loading scripts until they are required to decrease bytes consumed by network activity. Learn how to reduce unused JavaScript.
Multi-megabyte JavaScript bundles delay every interactive feature on the page.
This is the Lighthouse audit fired when too much JS is shipped relative to what executes. The fix isn't a config flag — it requires bundle analysis (webpack-bundle-analyzer, rollup-plugin-visualizer), splitting routes into chunks, lazy-loading off-screen components, and removing unused dependencies. Fundamentally different from minification: minifying reduces byte count, this reduces what's downloaded at all.
Source: Google web.dev / Lighthouse
| URL | Transfer Size | Est Savings |
|---|---|---|
| www.gstatic.com/recaptcha/releases/gTpTIWhbKpxADzTzkcabhXN4/recaptcha__en.js | 361.8 KiB | 242.2 KiB |
| connect.facebook.net/fr_FR/all.js?hash=90dd75f125d41f77fc05070a2cbe36fa | 82.5 KiB | 53.7 KiB |
| ajax.googleapis.com/ajax/libs/jquery/1.7.1/jquery.min.js | 32.6 KiB | 20.1 KiB |
Set an explicit width and height on image elements to reduce layout shifts and improve CLS. Learn how to set image dimensions
Performance issues directly impact user engagement and conversion rates.
| URL | |
|---|---|
Wamp Server div#header-group > div#logo > a.home > img | www.wampserver.com/wp-content/themes/wampserver/img/logo.png |
div#footer-inner > div#footer-group > p.bottom > img.ovirt div#footer-inner > div#footer-group > p.bottom > img.ovirt | www.wampserver.com/wp-content/themes/wampserver/img/ovirt-16.png |
More information about the performance of your application. These numbers don't directly affect the Performance score.
These checks highlight opportunities to improve the accessibility of your web app. Automatic detection can only detect a subset of issues and does not guarantee the accessibility of your web app, so manual testing is also encouraged.
One main landmark helps screen reader users navigate a web page. Learn more about landmarks.
Performance issues directly impact user engagement and conversion rates.
| Failing Elements |
|---|
html html |
These items highlight common accessibility best practices.
All sites should be protected with HTTPS, even ones that don't handle sensitive data. This includes avoiding mixed content, where some resources are loaded over HTTP despite the initial request being served over HTTPS. HTTPS prevents intruders from tampering with or passively listening in on the communications between your app and your users, and is a prerequisite for HTTP/2 and many new web platform APIs. Learn more about HTTPS.
Performance issues directly impact user engagement and conversion rates.
| Insecure URL | Request Resolution |
|---|---|
| fonts.googleapis.com/css?family=Rationale | Blocked |
| s7.addthis.com/js/250/addthis_widget.js | Blocked |
Image natural dimensions should be proportional to the display size and the pixel ratio to maximize image clarity. Learn how to provide responsive images.
Performance issues directly impact user engagement and conversion rates.
| URL | Displayed size | Actual size | Expected size | |
|---|---|---|---|---|
Wamp Server div#header-group > div#logo > a.home > img | www.wampserver.com/wp-content/themes/wampserver/img/logo.png | 351 x 85 | 351 x 85 | 527 x 128 |
Specifying a doctype prevents the browser from switching to quirks-mode. Learn more about the doctype declaration.
Performance issues directly impact user engagement and conversion rates.
Errors logged to the console indicate unresolved problems. They can come from network request failures and other browser concerns. Learn more about this errors in console diagnostic audit
Performance issues directly impact user engagement and conversion rates.
| Source | Description |
|---|---|
Mixed Content: The page at 'https://www.wampserver.com/' was loaded over HTTPS, but requested an insecure script 'http://s7.addthis.com/js/250/addthis_widget.js'. This request has been blocked; the content must be served over HTTPS. | |
www.wampserver.com/ line 11, col 0 | Mixed Content: The page at 'https://www.wampserver.com/' was loaded over HTTPS, but requested an insecure stylesheet 'http://fonts.googleapis.com/css?family=Rationale'. This request has been blocked; the content must be served over HTTPS. |
www.wampserver.com/ line 871, col 24 | TypeError: $(...).colorbox is not a function
at HTMLDocument.<anonymous> (https://www.wampserver.com/:872:25)
at n (https://ajax.googleapis.com/ajax/libs/jquery/1.7.1/jquery.min.js:2:14784)
at Object.fireWith (https://ajax.googleapis.com/ajax/libs/jquery/1.7.1/jquery.min.js:2:15553)
at e.ready (https://ajax.googleapis.com/ajax/libs/jquery/1.7.1/jquery.min.js:2:9773)
at HTMLDocument.B (https://ajax.googleapis.com/ajax/libs/jquery/1.7.1/jquery.min.js:2:14348) |
Issues logged to the `Issues` panel in Chrome Devtools indicate unresolved problems. They can come from network request failures, insufficient security controls, and other browser concerns. Open up the Issues panel in Chrome DevTools for more details on each issue.
Performance issues directly impact user engagement and conversion rates.
| Issue type |
|---|
| Mixed content |
These checks ensure that your page is following basic search engine optimization advice. There are many additional factors Lighthouse does not score here that may affect your search ranking, including performance on Core Web Vitals. Learn more about Google Search Essentials.
hreflang links tell search engines what version of a page they should list in search results for a given language or region. Learn more about `hreflang`.
Performance issues directly impact user engagement and conversion rates.
head > link |
head > link |
Format your HTML in a way that enables crawlers to better understand your app’s content.
Industry-standard audits powered by Google Lighthouse. — Desktop
Key metrics that affect user experience. — Desktop
First Contentful Paint First Contentful Paint — how long until the browser renders the first piece of content. Under 1.8s is good.
1.02 s
Largest Contentful Paint Largest Contentful Paint — how long until the largest visible element loads. Under 2.5s is good.
1.90 s
Total Blocking Time Total Blocking Time — total time the main thread was blocked, preventing user input. Under 200ms is good.
0 ms
Cumulative Layout Shift Cumulative Layout Shift — measures visual stability. How much the page layout shifts during loading. Under 0.1 is good.
0.000
Speed Index Speed Index — how quickly content is visually displayed during load. Under 3.4s is good.
1.39 s
Time to Interactive Time to Interactive — how long until the page is fully interactive and responds to user input. Under 3.8s is good.
1.90 s
Audit breakdown by category with detailed findings.
Remove large, duplicate JavaScript modules from bundles to reduce unnecessary bytes consumed by network activity.
Performance issues directly impact user engagement and conversion rates.
Polyfills and transforms enable older browsers to use new JavaScript features. However, many aren't necessary for modern browsers. Consider modifying your JavaScript build process to not transpile Baseline features, unless you know you must support older browsers. Learn why most sites can deploy ES6+ code without transpiling
Shipping ES5 transpiled code to modern browsers wastes bytes — every user with an evergreen browser pays for compatibility you don't need.
Most users today run browsers that natively support ES6+, async/await, optional chaining, and the rest of modern JavaScript. Transpiling to ES5 'just in case' adds 20-40% to your bundle for no benefit. Configure your build to target a modern browserslist, or ship a differential bundle pair (modern + legacy) with the module/nomodule pattern.
Source: Google web.dev / Lighthouse
3rd party code can significantly impact load performance. Reduce and defer loading of 3rd party code to prioritize your page's content.
Performance issues directly impact user engagement and conversion rates.
A long cache lifetime can speed up repeat visits to your page. Learn more about caching.
Performance issues directly impact user engagement and conversion rates.
Reducing the download time of images can improve the perceived load time of the page and LCP. Learn more about optimizing image size
Performance issues directly impact user engagement and conversion rates.
| URL | Resource Size | Est Savings | |
|---|---|---|---|
div#home > div#home-inner > div#home-group > div.wamp_character div#home > div#home-inner > div#home-group > div.wamp_character | www.wampserver.com/wp-content/themes/wampserver/img/illustration-contrib.png | 166.8 KiB | 113.9 KiB |
TÉLÉCHARGEMENTS
WampServer est disponible gratuitement (sous licence GPL) en d… div#page > div#download-wrapper > div.ancre > div#download | www.wampserver.com/wp-content/themes/wampserver/img/fond_download.png | 104.2 KiB | 70.2 KiB |
div#download > div#download-inner > div#download-group > div.picto div#download > div#download-inner > div#download-group > div.picto | www.wampserver.com/wp-content/themes/wampserver/img/picto-sprite.png | 72.0 KiB | 61.2 KiB |
CRÉDITS
Auteur :
Romain Bourdon
Mainteneur / Roadmap :
Dominique Ottello
Modéra… div#footer-wrapper > div.ancre > div#footer > div#footer-inner | www.wampserver.com/wp-content/themes/wampserver/img/bloc-don.png | 33.4 KiB | 25.8 KiB |
div#formations > div#formations-inner > div#formations-group > div.wamp_character div#formations > div#formations-inner > div#formations-group > div.wamp_character | www.wampserver.com/wp-content/themes/wampserver/img/pingouin.png | 54.4 KiB | 23.1 KiB |
ENGLISH, РУССКИЙ
DÉMARRER
TÉLÉCHARGER
FORMATION
FORUM
HÉBERGEMENT CLOUD body.home > div#header | www.wampserver.com/wp-content/themes/wampserver/img/bg-header.png | 56.4 KiB | 19.6 KiB |
Wamp Server div#header-group > div#logo > a.home > img | www.wampserver.com/wp-content/themes/wampserver/img/logo.png | 9.5 KiB | 4.7 KiB |
Optimize LCP by making the LCP image discoverable from the HTML immediately, and avoiding lazy-loading
Performance issues directly impact user engagement and conversion rates.
Avoid chaining critical requests by reducing the length of chains, reducing the download size of resources, or deferring the download of unnecessary resources to improve page load.
Performance issues directly impact user engagement and conversion rates.
Requests are blocking the page's initial render, which may delay LCP. Deferring or inlining can move these network requests out of the critical path.
Performance issues directly impact user engagement and conversion rates.
These insights are also available in the Chrome DevTools Performance Panel - record a trace to view more detailed information.
Reduce unused JavaScript and defer loading scripts until they are required to decrease bytes consumed by network activity. Learn how to reduce unused JavaScript.
Multi-megabyte JavaScript bundles delay every interactive feature on the page.
This is the Lighthouse audit fired when too much JS is shipped relative to what executes. The fix isn't a config flag — it requires bundle analysis (webpack-bundle-analyzer, rollup-plugin-visualizer), splitting routes into chunks, lazy-loading off-screen components, and removing unused dependencies. Fundamentally different from minification: minifying reduces byte count, this reduces what's downloaded at all.
Source: Google web.dev / Lighthouse
| URL | Transfer Size | Est Savings |
|---|---|---|
| www.gstatic.com/recaptcha/releases/gTpTIWhbKpxADzTzkcabhXN4/recaptcha__en.js | 361.8 KiB | 242.2 KiB |
| connect.facebook.net/fr_FR/all.js?hash=90dd75f125d41f77fc05070a2cbe36fa | 82.5 KiB | 53.7 KiB |
| ajax.googleapis.com/ajax/libs/jquery/1.7.1/jquery.min.js | 32.6 KiB | 20.1 KiB |
Set an explicit width and height on image elements to reduce layout shifts and improve CLS. Learn how to set image dimensions
Performance issues directly impact user engagement and conversion rates.
| URL | |
|---|---|
Wamp Server div#header-group > div#logo > a.home > img | www.wampserver.com/wp-content/themes/wampserver/img/logo.png |
div#footer-inner > div#footer-group > p.bottom > img.ovirt div#footer-inner > div#footer-group > p.bottom > img.ovirt | www.wampserver.com/wp-content/themes/wampserver/img/ovirt-16.png |
More information about the performance of your application. These numbers don't directly affect the Performance score.
These checks highlight opportunities to improve the accessibility of your web app. Automatic detection can only detect a subset of issues and does not guarantee the accessibility of your web app, so manual testing is also encouraged.
One main landmark helps screen reader users navigate a web page. Learn more about landmarks.
Performance issues directly impact user engagement and conversion rates.
| Failing Elements |
|---|
html html |
These items highlight common accessibility best practices.
All sites should be protected with HTTPS, even ones that don't handle sensitive data. This includes avoiding mixed content, where some resources are loaded over HTTP despite the initial request being served over HTTPS. HTTPS prevents intruders from tampering with or passively listening in on the communications between your app and your users, and is a prerequisite for HTTP/2 and many new web platform APIs. Learn more about HTTPS.
Performance issues directly impact user engagement and conversion rates.
| Insecure URL | Request Resolution |
|---|---|
| fonts.googleapis.com/css?family=Rationale | Blocked |
| s7.addthis.com/js/250/addthis_widget.js | Blocked |
Specifying a doctype prevents the browser from switching to quirks-mode. Learn more about the doctype declaration.
Performance issues directly impact user engagement and conversion rates.
Errors logged to the console indicate unresolved problems. They can come from network request failures and other browser concerns. Learn more about this errors in console diagnostic audit
Performance issues directly impact user engagement and conversion rates.
| Source | Description |
|---|---|
Mixed Content: The page at 'https://www.wampserver.com/' was loaded over HTTPS, but requested an insecure script 'http://s7.addthis.com/js/250/addthis_widget.js'. This request has been blocked; the content must be served over HTTPS. | |
www.wampserver.com/ line 11, col 0 | Mixed Content: The page at 'https://www.wampserver.com/' was loaded over HTTPS, but requested an insecure stylesheet 'http://fonts.googleapis.com/css?family=Rationale'. This request has been blocked; the content must be served over HTTPS. |
www.wampserver.com/ line 871, col 24 | TypeError: $(...).colorbox is not a function
at HTMLDocument.<anonymous> (https://www.wampserver.com/:872:25)
at n (https://ajax.googleapis.com/ajax/libs/jquery/1.7.1/jquery.min.js:2:14784)
at Object.fireWith (https://ajax.googleapis.com/ajax/libs/jquery/1.7.1/jquery.min.js:2:15553)
at e.ready (https://ajax.googleapis.com/ajax/libs/jquery/1.7.1/jquery.min.js:2:9773)
at HTMLDocument.B (https://ajax.googleapis.com/ajax/libs/jquery/1.7.1/jquery.min.js:2:14348) |
Issues logged to the `Issues` panel in Chrome Devtools indicate unresolved problems. They can come from network request failures, insufficient security controls, and other browser concerns. Open up the Issues panel in Chrome DevTools for more details on each issue.
Performance issues directly impact user engagement and conversion rates.
| Issue type |
|---|
| Mixed content |
These checks ensure that your page is following basic search engine optimization advice. There are many additional factors Lighthouse does not score here that may affect your search ranking, including performance on Core Web Vitals. Learn more about Google Search Essentials.
hreflang links tell search engines what version of a page they should list in search results for a given language or region. Learn more about `hreflang`.
Performance issues directly impact user engagement and conversion rates.
head > link |
head > link |
Format your HTML in a way that enables crawlers to better understand your app’s content.
Send Feedback