Global Performance
6/6 locations ✓Acceptable global latency — average 415ms across 6 locations, fastest from Santa Clara (224ms), slowest from Sao Paulo (703ms). No CDN detected. Cache-Control header is missing. 2 locations above the 500ms target.
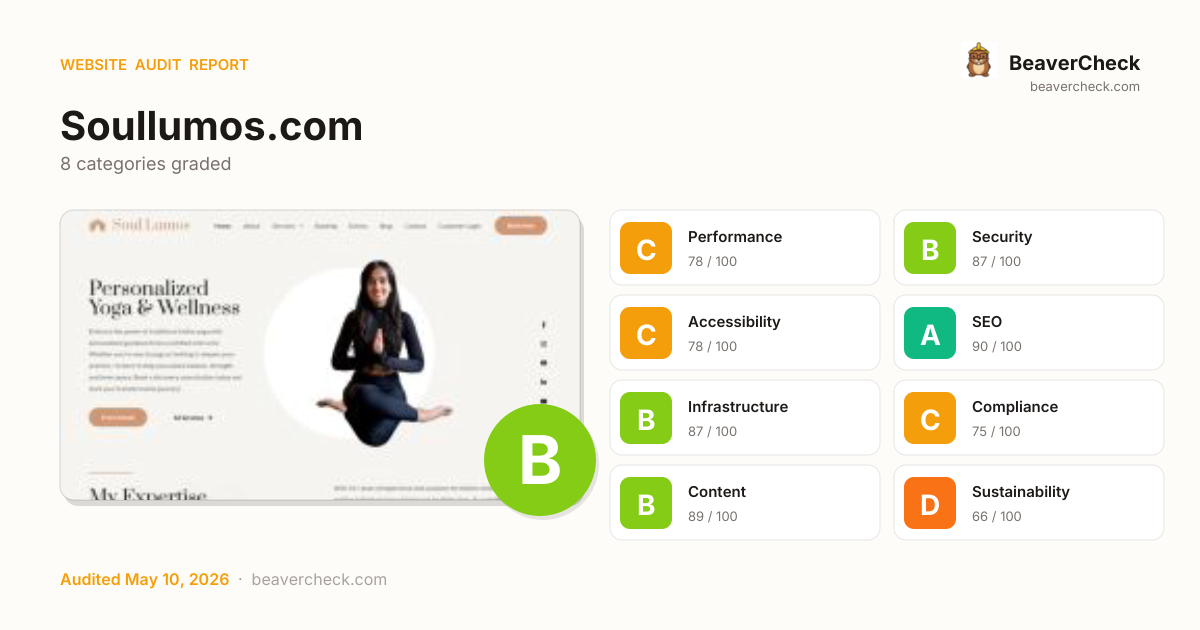
Audit overview
Sustainability needs attention; the rest of the categories are in good shape.
Fix Priority Matrix
5 findingsQuick Wins
2High impact, low effort — start here.
Strategic
3High impact, requires investment.
Easy Improvements
0Small gains, minimal effort.
Nothing in this quadrant — good news.
Deprioritize
0Low impact, high effort — do last.
Nothing in this quadrant — good news.
Screenshots


Top Priorities (5)
3 control(s) without accessible label
Form controls without labels — assistive tech announces 'edit text' with no context; users can't complete forms.
6 link(s) with no accessible text
Links with no accessible text (empty <a></a>, image-only no alt, icon-only no aria-label) are unidentifiable to screen readers.
/composer.json is publicly accessible
Sensitive resource publicly accessible — restrict access or remove.
1 link(s) open in a new tab without rel=noopener
target="_blank" without rel="noopener" lets the destination tab navigate the original via window.opener -- a reverse-tabnabbing phishing primitive.
2 font preload(s) missing `crossorigin` -- font will be downloaded twice
Performance issues directly impact user engagement and conversion rates.
Business case
What fixing the audit's findings is worth -- and what ignoring them keeps costing.
Return on investment
CAD 451 investment → CAD 13,145/month returns + CAD 250,000 risk avoided
Figures combine localized regulatory fine ceilings, search/conversion value priced against local CPC, and bandwidth waste estimates. Results depend on implementation quality and audience composition. Not legal or financial advice.
Conversion barriers
7 barrier(s) likely increasing bounce by ~29%.
- Page takes 7.9s to loadUsers abandon at ~3s — you're 5.4s over the 2.5s threshold→ Optimize render-blocking resources, preload the hero image, and compress images
- 3 form field(s) without a labelScreen readers skip unlabeled fields; autofill can't identify them; checkout abandonment spikes→ Associate every input with a visible <label for="…">; add autocomplete attributes
- High main-thread blocking timePage is non-interactive for 385ms after first paint→ Defer third-party scripts and split large bundles
- No HSTS headerReturning visitors are briefly exposed to downgrade attacks on first request→ Set Strict-Transport-Security: max-age=31536000; includeSubDomains
- No Content-Security-Policy headerHigher XSS blast radius — one compromised script can exfiltrate the checkout form→ Ship a reporting-only CSP first, then enforce once violations are clean
Preliminary CRO audit — each barrier links to the tab with detailed analysis.
Remediation cost
Start here for the best return on investment
Cost by category
Cost by effort level
Adjust assumptions
Team composition
Multiplier applied to dev hours to reflect QA, design, and PM overhead. Use Dev only for solo work; Full team for projects with formal review processes.
Rates reflect fully-loaded developer cost including overhead
Warning:Cost of inaction
Compliance Risk
CAD 250,000
- Multiple H1 headings (2 found)ACA: CAD 250 – CAD 250,000
- Heading level skipped: H2 → H6 (missing H3)ACA: CAD 250 – CAD 250,000
- 3 control(s) without accessible labelACA: CAD 250 – CAD 250,000
Bounce-Rate Cost
CAD 8,180 /mo
+29.2pp bounce · ~2,921 lost visitors/mo
CPC: CAD 2.80
Bandwidth Waste
CAD 0.94 /mo
8720.9 MB/mo × 0.108 CAD/GB
- Optimize transfer: save ~872 KB per page loadSaves CAD 0.94/mo
Compliance figures represent the statutory maximum fine for the most severe triggered category, capped per regulation — not the sum of per-finding penalties. Based on published regulatory fine ranges. This is not legal advice.
Unique monthly visitors from your analytics
Purchases, signups, or key actions
Optional — for revenue estimation
more engaged visitors from reduced bounce
Fix 2 critical issues to capture this value
How this is calculated
Based on Google/Deloitte research ("Milliseconds Make Millions") showing a ~7% bounce rate increase per additional second of LCP above the 2.5s "Good" threshold.
Your site's LCP: → estimated after fixes.
These are estimates based on industry research — actual results vary
Your data stays in your browser — nothing is sent to our servers
Lighthouse
Mobile
First Contentful Paint First Contentful Paint — how long until the browser renders the first piece of content. Under 1.8s is good.
3.26 s
Largest Contentful Paint Largest Contentful Paint — how long until the largest visible element loads. Under 2.5s is good.
7.91 s
Total Blocking Time Total Blocking Time — total time the main thread was blocked, preventing user input. Under 200ms is good.
385 ms
Cumulative Layout Shift Cumulative Layout Shift — measures visual stability. How much the page layout shifts during loading. Under 0.1 is good.
0.046
Speed Index Speed Index — how quickly content is visually displayed during load. Under 3.4s is good.
3.26 s
Time to Interactive Time to Interactive — how long until the page is fully interactive and responds to user input. Under 3.8s is good.
18.26 s
Desktop
First Contentful Paint First Contentful Paint — how long until the browser renders the first piece of content. Under 1.8s is good.
970 ms
Largest Contentful Paint Largest Contentful Paint — how long until the largest visible element loads. Under 2.5s is good.
1.39 s
Total Blocking Time Total Blocking Time — total time the main thread was blocked, preventing user input. Under 200ms is good.
1 ms
Cumulative Layout Shift Cumulative Layout Shift — measures visual stability. How much the page layout shifts during loading. Under 0.1 is good.
0.002
Speed Index Speed Index — how quickly content is visually displayed during load. Under 3.4s is good.
970 ms
Time to Interactive Time to Interactive — how long until the page is fully interactive and responds to user input. Under 3.8s is good.
1.63 s
Categories
8Performance
2 font preload(s) missing `crossorigin` -- font will be downloaded twice
Security
/composer.json is publicly accessible
Accessibility
3 control(s) without accessible label
SEO
All checks pass
Infrastructure
All checks pass
Compliance
All checks pass
Content
All checks pass
Sustainability
All checks pass
How you compare
Where this site stands against peers running the same stack.
Top 10% of WordPress sites score 86+ on Compliance; you're at 75 — closing this gap is the highest-leverage improvement.
Top 10% of Cloudflare sites score 96+ on Sustainability; you're at 66 — closing this gap is the highest-leverage improvement.
Technology stack
WordPress, on LiteSpeed/PHP
Stack Architecture
 Hostinger
  WordPress
  Cloudflare Facebook Google Search Console HSTS
  HTTP/3 Microsoft
  MySQL
MySQL  Open Graph
  RSS
RSS  PHP 8.3.30
 LiteSpeed
 All Detected Technologies (13)
LiteSpeed is a high-scalability web server.
PHP is a general-purpose scripting language used for web development.
WordPress is a free and open-source content management system written in PHP and paired with a MySQL or MariaDB database. Features include a plugin architecture and a template system.
HTTP Strict Transport Security (HSTS) informs browsers that the site should only be accessed using HTTPS.
HTTP/3 is the third major version of the Hypertext Transfer Protocol used to exchange information on the World Wide Web.
MySQL is an open-source relational database management system.
Open Graph is a protocol that is used to integrate any web page into the social graph.
RSS is a family of web feed formats used to publish frequently updated works—such as blog entries, news headlines, audio, and video—in a standardized format.
Hostinger is an employee-owned Web hosting provider and internet domain registrar.
Observations (4)
Runtime exposed via X-Powered-By header
The X-Powered-By header reveals 'PHP 8.3.30'. Remove this header in production to reduce information leakage.
WordPress detected — review security configuration
WordPress sites benefit from: protecting wp-login.php, disabling XML-RPC if unused, restricting REST API access, and keeping all plugins and themes up to date. Check the Security tab for specific findings.
No build tool detected
A framework (Cloudflare) was detected but no bundler was identified. The build tool may not be detectable from output patterns, or the site may use the framework's built-in bundler.
Complex technology stack detected
13 technologies identified. A complex stack increases maintenance burden and attack surface. Consider whether all components are actively needed.
Show your score
Drop this badge on your README, marketing site, or status page. It auto-updates every time the audit re-runs and links back to this report.
This badge auto-updates with your latest scan result.
[](https://beavercheck.com/results/4f3b98f4-efd0-422f-8103-ac937bfa8cbe)<a href="https://beavercheck.com/results/4f3b98f4-efd0-422f-8103-ac937bfa8cbe"><img src="https://beavercheck.com/badge?url=https%3A%2F%2FSoullumos.com" alt="BeaverCheck Score"></a>https://beavercheck.com/badge?url=https%3A%2F%2FSoullumos.comExport & share
Download the audit, share with your team, or grab a fix plan ready to copy into your tracker.
Copies markdown to clipboard
Fix Plan
Three-week roadmap to ship the audit's findings, with one-click copy targets for your tracker.
Three-week fix plan
2 sprints · 5h total → projected B (88)
Sprint 1: Quick Wins
+3Highest ROI — low effort, high impact
- · 6 link(s) with no accessible text
- · 1 link(s) open in a new tab without rel=noopener
Sprint 2: Core Fixes
+3Medium effort, high structural impact
- · 3 control(s) without accessible label
- · /composer.json is publicly accessible
- · 2 font preload(s) missing `crossorigin` -- font will be downloaded twice