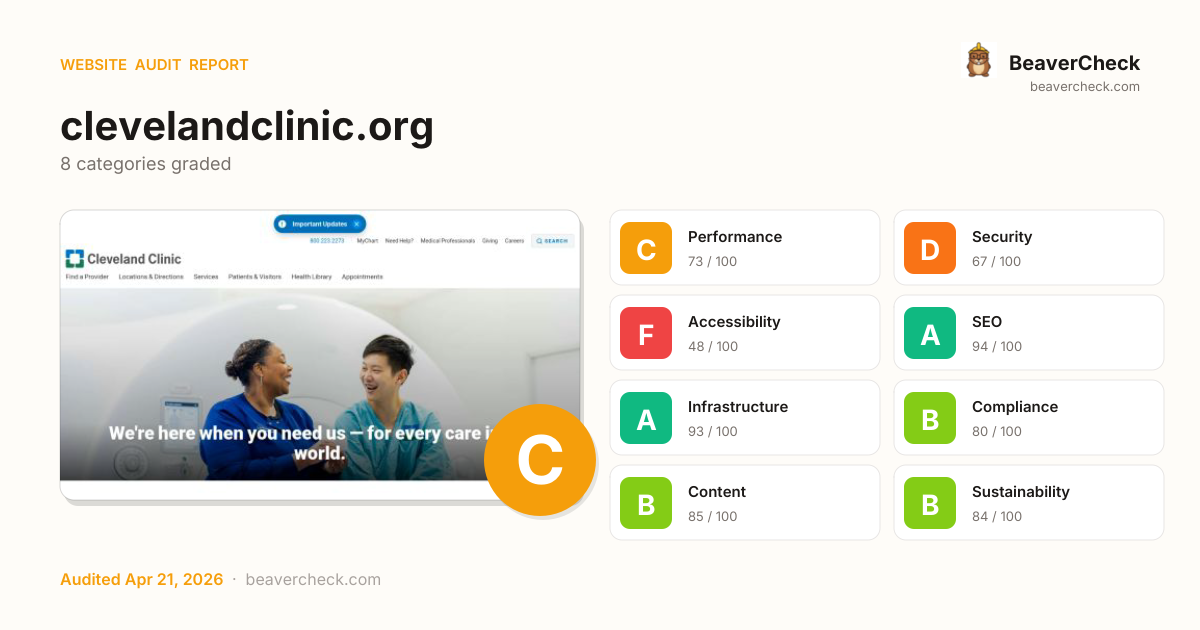
Mobile 375 × 812

Desktop 1440 × 900

Score: 73 / 100
Based on 8 categories, 0 sections
Decent speed, but optimizing further could improve engagement.
Several missing protections leave your users and data exposed.
Major barriers for users with disabilities — up to 15% of your audience.
Well-optimized for search — your content is discoverable.
Solid infrastructure — fast server responses across the board.
Mostly compliant — a few items need attention.
Rich content metadata — your pages look great everywhere.
Reasonable footprint with room for optimization.
The overall score is a weighted average of individual category scores. Categories with more impact on user experience and security carry more weight.
Weights reflect general web best practices. Individual needs may differ.
Content-Security-Policy header is missing
Security gaps expose your site and users to attacks, eroding trust.
No Content-Security-Policy header found
Security gaps expose your site and users to attacks, eroding trust.
1 button(s) with no accessible text
Accessibility issues exclude users with disabilities — up to 15% of your potential audience.
4 image(s) missing alt attribute
Accessibility issues exclude users with disabilities — up to 15% of your potential audience.
4 image-in-link without alt text
Accessibility issues exclude users with disabilities — up to 15% of your potential audience.
High impact, low effort — start here.
High impact, requires investment.
Small gains, minimal effort.
Nothing in this quadrant — good news.
Low impact, high effort — do last.
Nothing in this quadrant — good news.
[](https://beavercheck.com/results/501b442d-4104-4742-afc4-92a5d2ab26f6)<a href="https://beavercheck.com/results/501b442d-4104-4742-afc4-92a5d2ab26f6"><img src="https://beavercheck.com/badge?url=https%3A%2F%2Fclevelandclinic.org" alt="BeaverCheck Score"></a>https://beavercheck.com/badge?url=https%3A%2F%2Fclevelandclinic.orgThis badge auto-updates with your latest scan result.
Your site performs reasonably well, but a few targeted fixes could meaningfully improve results. Accessibility issues exclude users who rely on assistive technology — an estimated 15% of your potential audience. Addressing the critical issues below would have the most immediate impact on your user trust.
8 barrier(s) likely increasing bounce by ~33%.
Page takes 5.5s to load
+12% bounceUsers abandon at ~3s — you're 3.0s over the 2.5s threshold
Fix: Optimize render-blocking resources, preload the hero image, and compress images
Page feels frozen for 676ms
+5% bounceClicks on the primary CTA are ignored while JavaScript runs
Fix: Break up long tasks; defer non-critical JavaScript to post-hydration
No HSTS header
+1% bounceReturning visitors are briefly exposed to downgrade attacks on first request
Fix: Set Strict-Transport-Security: max-age=31536000; includeSubDomains
No Content-Security-Policy header
+1% bounceHigher XSS blast radius — one compromised script can exfiltrate the checkout form
Fix: Ship a reporting-only CSP first, then enforce once violations are clean
Severe layout shift during page load
+6% bounceUsers mis-click when content jumps — converting intent into frustration
Fix: Reserve space for images, ads, and embeds with explicit width/height
8 link(s) with generic text ("click here", "read more")
+1% bounceScreen-reader users navigating by link list see no context — and search engines can't infer relevance
Fix: Rewrite with descriptive phrases that identify the destination
No skip-to-content link
+1% bounceKeyboard and screen-reader users must tab through the entire header on every page
Fix: Add a visible-on-focus <a href="#main">Skip to content</a> as the first focusable element
81 broken link(s) on the page
+5% bounceClicks land on 404s — trust drops and the session often ends
Fix: Fix or remove the broken destinations surfaced on the Content tab
Preliminary CRO audit — each barrier links to the tab with detailed analysis.
€468 investment → €3,400/month returns + EUR 120,500,000 risk avoided
€468
6h · 5 findings
€3,400 /mo
~€40,805 / year
EUR 120,500,000
if kept compliant
€85 — in quick wins — start here for the fastest payback
Figures combine localized regulatory fine ceilings, search/conversion value priced against local CPC, and bandwidth waste estimates. Results depend on implementation quality and audience composition. Not legal or financial advice.
5.5 developer hours at €85/hr
Based on European Union rates (€85/hr)
Start here for the best return on investment
€10,041,667 / month at risk
~€120,500,008 / year if left unfixed
€120,500,000
+10 more
€0.68 /mo
9209.3 MB/mo × 0.074 EUR/GB
Compliance figures represent the statutory maximum fine for the most severe triggered category, capped per regulation — not the sum of per-finding penalties. Based on published regulatory fine ranges. This is not legal advice.
Unique monthly visitors from your analytics
Purchases, signups, or key actions
Optional — for revenue estimation
more engaged visitors from reduced bounce
Fix 5 critical issues to capture this value
Based on Google/Deloitte research ("Milliseconds Make Millions") showing a ~7% bounce rate increase per additional second of LCP above the 2.5s "Good" threshold.
Your site's LCP: → estimated after fixes.
These are estimates based on industry research — actual results vary
Your data stays in your browser — nothing is sent to our servers
Thanks for your feedback!
We'll use a cached audit if available, or offer to scan.
Industry-standard audits powered by Google Lighthouse.
Key metrics that affect user experience.
First Contentful Paint First Contentful Paint — how long until the browser renders the first piece of content. Under 1.8s is good.
4.69 s
Largest Contentful Paint Largest Contentful Paint — how long until the largest visible element loads. Under 2.5s is good.
5.52 s
Total Blocking Time Total Blocking Time — total time the main thread was blocked, preventing user input. Under 200ms is good.
676 ms
Cumulative Layout Shift Cumulative Layout Shift — measures visual stability. How much the page layout shifts during loading. Under 0.1 is good.
0.555
Speed Index Speed Index — how quickly content is visually displayed during load. Under 3.4s is good.
4.69 s
Time to Interactive Time to Interactive — how long until the page is fully interactive and responds to user input. Under 3.8s is good.
11.62 s
Audit breakdown by category with detailed findings.
Remove large, duplicate JavaScript modules from bundles to reduce unnecessary bytes consumed by network activity.
Performance issues directly impact user engagement and conversion rates.
Polyfills and transforms enable older browsers to use new JavaScript features. However, many aren't necessary for modern browsers. Consider modifying your JavaScript build process to not transpile Baseline features, unless you know you must support older browsers. Learn why most sites can deploy ES6+ code without transpiling
Shipping ES5 transpiled code to modern browsers wastes bytes — every user with an evergreen browser pays for compatibility you don't need.
Most users today run browsers that natively support ES6+, async/await, optional chaining, and the rest of modern JavaScript. Transpiling to ES5 'just in case' adds 20-40% to your bundle for no benefit. Configure your build to target a modern browserslist, or ship a differential bundle pair (modern + legacy) with the module/nomodule pattern.
Source: Google web.dev / Lighthouse
3rd party code can significantly impact load performance. Reduce and defer loading of 3rd party code to prioritize your page's content.
Performance issues directly impact user engagement and conversion rates.
A long cache lifetime can speed up repeat visits to your page. Learn more about caching.
Performance issues directly impact user engagement and conversion rates.
Layout shifts occur when elements move absent any user interaction. Investigate the causes of layout shifts, such as elements being added, removed, or their fonts changing as the page loads.
Performance issues directly impact user engagement and conversion rates.
Your first network request is the most important. Reduce its latency by avoiding redirects, ensuring a fast server response, and enabling text compression.
Performance issues directly impact user engagement and conversion rates.
A forced reflow occurs when JavaScript queries geometric properties (such as offsetWidth) after styles have been invalidated by a change to the DOM state. This can result in poor performance. Learn more about forced reflows and possible mitigations.
Performance issues directly impact user engagement and conversion rates.
Avoid chaining critical requests by reducing the length of chains, reducing the download size of resources, or deferring the download of unnecessary resources to improve page load.
Performance issues directly impact user engagement and conversion rates.
Requests are blocking the page's initial render, which may delay LCP. Deferring or inlining can move these network requests out of the critical path.
Performance issues directly impact user engagement and conversion rates.
| URL | Transfer Size | Duration |
|---|---|---|
| cdn.optimizely.com/js/28007920049.js | 122.7 KiB | 2.0 s |
| my.clevelandclinic.org/assets/styles/styles.css | 106.6 KiB | 1.7 s |
| my.clevelandclinic.org/assets/styles/vendor/magnific-popup.css | 1.9 KiB |
Reducing the download time of images can improve the perceived load time of the page and LCP. Learn more about optimizing image size
Performance issues directly impact user engagement and conversion rates.
| URL | Resource Size | Est Savings | |
|---|---|---|---|
Cleveland Clinic main campus div.story-panel__card-content > a.story-panel__image-link > div.story-panel__image-overlay > img.js-story-panel__image | /-/scassets/images/org/locations/home/cleveland-clinic-ma... | 41.6 KiB | 31.0 KiB |
Cleveland Clinic Florida div.story-panel__card-content > a.story-panel__image-link > div.story-panel__image-overlay > img.js-story-panel__image | /-/scassets/images/org/locations/home/cleveland-clinic-fl... | 22.8 KiB | 16.2 KiB |
Appointments div.story-panel__card-content > a.story-panel__image-link > div.story-panel__image-overlay > img.js-story-panel__image | /-/scassets/images/org/locations/home/appointments-card.jpg | 19.2 KiB | 14.6 KiB |
These insights are also available in the Chrome DevTools Performance Panel - record a trace to view more detailed information.
Redirects introduce additional delays before the page can be loaded. Learn how to avoid page redirects.
Performance issues directly impact user engagement and conversion rates.
| URL | Time Spent |
|---|---|
| clevelandclinic.org/ | 809 ms |
| www.clevelandclinic.org/ | 803 ms |
| my.clevelandclinic.org/ | 0.0 ms |
These are the largest layout shifts observed on the page. Each table item represents a single layout shift, and shows the element that shifted the most. Below each item are possible root causes that led to the layout shift. Some of these layout shifts may not be included in the CLS metric value due to windowing. Learn how to improve CLS
Performance issues directly impact user engagement and conversion rates.
| Element | Layout shift score |
|---|---|
Our Providers
Search by name, specialty, location and more.
Find a Provider div.story-panel__carousel > ul.story-panel__cards-container > li.story-layout > div.story-panel__card | 0.474 |
| 0.038 | |
body.health body.health | 0.014 |
body.health body.health | 0.008 |
body.health body.health | 0.007 |
body.health body.health | 0.006 |
body.health body.health | 0.005 |
body.health body.health | 0.004 |
We're here when you need us — for every care in the world. div.hero__image > div.container > div.hero__text > h1.hero__title | 0.002 |
We're here when you need us — for every care in the world. div.hero__image > div.container > div.hero__text > h1.hero__title | 0.001 |
Time to Interactive is the amount of time it takes for the page to become fully interactive. Learn more about the Time to Interactive metric.
Performance issues directly impact user engagement and conversion rates.
The maximum potential First Input Delay that your users could experience is the duration of the longest task. Learn more about the Maximum Potential First Input Delay metric.
Performance issues directly impact user engagement and conversion rates.
Reduce unused rules from stylesheets and defer CSS not used for above-the-fold content to decrease bytes consumed by network activity. Learn how to reduce unused CSS.
Performance issues directly impact user engagement and conversion rates.
| URL | Transfer Size | Est Savings |
|---|---|---|
| my.clevelandclinic.org/assets/styles/styles.css | 106.5 KiB | 96.4 KiB |
| fonts.googleapis.com/earlyaccess/notosansscsliced.css | 28.6 KiB | 28.6 KiB |
Reduce unused JavaScript and defer loading scripts until they are required to decrease bytes consumed by network activity. Learn how to reduce unused JavaScript.
Multi-megabyte JavaScript bundles delay every interactive feature on the page.
This is the Lighthouse audit fired when too much JS is shipped relative to what executes. The fix isn't a config flag — it requires bundle analysis (webpack-bundle-analyzer, rollup-plugin-visualizer), splitting routes into chunks, lazy-loading off-screen components, and removing unused dependencies. Fundamentally different from minification: minifying reduces byte count, this reduces what's downloaded at all.
Source: Google web.dev / Lighthouse
| URL | Transfer Size | Est Savings |
|---|---|---|
| www.googletagmanager.com/gtm.js?id=GTM-3M4W | 169.9 KiB | 79.5 KiB |
| oc-cdn-ocprod.azureedge.net/livechatwidget/scripts/LiveChatBootstrapper.js | 112.5 KiB | 65.9 KiB |
| cdn.optimizely.com/js/28007920049.js | 122.1 KiB | 42.1 KiB |
| bigidcmp.cloud/banner.js?siteId=e7a0b4f7-3b3b-49ce-9467-9e699346f114 | 52.7 KiB | 32.2 KiB |
| assets.adobedtm.com/b4225c707162/4900abd505ae/launch-c146ea99d958.min.js | 66.3 KiB | 26.8 KiB |
| my.clevelandclinic.org/assets/scripts/dist/page-scripts.js | 31.1 KiB | 24.1 KiB |
| solutions.invocacdn.com/js/invoca-latest.min.js | 37.6 KiB | 23.0 KiB |
Consider reducing the time spent parsing, compiling, and executing JS. You may find delivering smaller JS payloads helps with this. Learn how to reduce Javascript execution time.
Performance issues directly impact user engagement and conversion rates.
| URL | Total CPU Time | Script Evaluation | Script Parse |
|---|---|---|---|
| my.clevelandclinic.org/ | 968 ms | 25 ms | 11 ms |
| Unattributable | 576 ms | 12 ms | 0.0 ms |
| code.jquery.com/jquery-3.0.0.min.js | 540 ms | 197 ms | 6.0 ms |
| www.googletagmanager.com/gtm.js?id=GTM-3M4W | 376 ms | 316 ms | 50 ms |
| cdn.optimizely.com/js/28007920049.js | 354 ms | 280 ms | 38 ms |
| assets.adobedtm.com/b4225c707162/4900abd505ae/launch-c146ea99d958.min.js | 328 ms | 276 ms | 33 ms |
| bigidcmp.cloud/banner.js?siteId=e7a0b4f7-3b3b-49ce-9467-9e699346f114 | 283 ms | 210 ms | 18 ms |
| oc-cdn-ocprod.azureedge.net/livechatwidget/scripts/LiveChatBootstrapper.js | 259 ms | 198 ms | 59 ms |
| my.clevelandclinic.org/assets/styles/styles.css | 57 ms | 0.0 ms | 0.0 ms |
Consider reducing the time spent parsing, compiling and executing JS. You may find delivering smaller JS payloads helps with this. Learn how to minimize main-thread work
Performance issues directly impact user engagement and conversion rates.
| Category | Time Spent |
|---|---|
| Script Evaluation | 1.7 s |
| Other | 1.0 s |
| Style & Layout | 674 ms |
| Script Parsing & Compilation | 254 ms |
| Rendering | 251 ms |
| Parse HTML & CSS | 108 ms |
| Garbage Collection | 21 ms |
Large network payloads cost users real money and are highly correlated with long load times. Learn how to reduce payload sizes.
Performance issues directly impact user engagement and conversion rates.
Set an explicit width and height on image elements to reduce layout shifts and improve CLS. Learn how to set image dimensions
Performance issues directly impact user engagement and conversion rates.
| URL | |
|---|---|
Getting an appointment at Cleveland Clinic is easy. Schedule using any of these… div.container > div.cta-panel__card > div.cta-panel__card-content > img | /-/scassets/images/org/icons/care-pages/call-to-action/ic... |
Find health and wellness information to help you and your family live a bit hea… div.container > div.cta-panel__card > div.cta-panel__card-content > img | /-/scassets/images/org/icons/care-pages/call-to-action/ic... |
Have a question? We want to make it easy to find what you're looking for. Get a… div.container > div.cta-panel__card > div.cta-panel__card-content > img | /-/scassets/images/org/icons/care-pages/call-to-action/ic... |
patient centered care icon div.spotlight-panel__container > div.spotlight-panel__card > div.spotlight-panel__icon-section > img | /-/scassets/images/org/icons/care-pages/spotlight-panel/p... |
national recognition icon div.spotlight-panel__container > div.spotlight-panel__card > div.spotlight-panel__icon-section > img | /-/scassets/images/org/icons/care-pages/spotlight-panel/n... |
skilled and collaborative providers icon div.spotlight-panel__container > div.spotlight-panel__card > div.spotlight-panel__icon-section > img | /-/scassets/images/org/icons/care-pages/spotlight-panel/s... |
exclamation icon header#site-header > div.nav--primary__menu > a.nav--primary__link--emergency-notification > img | my.clevelandclinic.org/Assets/imgs/icon-alert--blue.svg |
Emergency icon header.notification-banner__header > span.notification-banner__icon > a.notification-banner__link--expand > img | my.clevelandclinic.org/-/scassets/images/org/icons/icon-emergency-circle.svg |
More information about the performance of your application. These numbers don't directly affect the Performance score.
These checks highlight opportunities to improve the accessibility of your web app. Automatic detection can only detect a subset of issues and does not guarantee the accessibility of your web app, so manual testing is also encouraged.
Some ARIA parent roles must contain specific child roles to perform their intended accessibility functions. Learn more about roles and required children elements.
Performance issues directly impact user engagement and conversion rates.
| Failing Elements |
|---|
Institutes & Departments
Join Our Nursing Team
Careers
Refer a Patient
ConsultQ… div.homepage-content > section#home-page_for-providers > div.content-block__section > div.content-block-faq-panel |
These are opportunities to improve the usage of ARIA in your application which may enhance the experience for users of assistive technology, like a screen reader.
Properly ordered headings that do not skip levels convey the semantic structure of the page, making it easier to navigate and understand when using assistive technologies. Learn more about heading order.
Performance issues directly impact user engagement and conversion rates.
| Failing Elements |
|---|
Our Providers div.story-panel__card > div.story-panel__card-content > a.story-panel__title-link > h3.story-panel__title |
Actions footer.footer > div.container > div.footer__item > h5.footer__title |
These are opportunities to improve keyboard navigation in your application.
Informative elements should aim for short, descriptive alternate text. Decorative elements can be ignored with an empty alt attribute. Learn more about the `alt` attribute.
Performance issues directly impact user engagement and conversion rates.
| Failing Elements |
|---|
div.homepage-content > section#aenterprise_home-page-care-near-you > a.story-panel__nav-button > img div.homepage-content > section#aenterprise_home-page-care-near-you > a.story-panel__nav-button > img |
These are opportunities to improve the semantics of the controls in your application. This may enhance the experience for users of assistive technology, like a screen reader.
Low-contrast text is difficult or impossible for many users to read. Link text that is discernible improves the experience for users with low vision. Learn how to make links distinguishable.
Performance issues directly impact user engagement and conversion rates.
| Failing Elements |
|---|
800.223.2273 div.container > div.l-1col > div.footer__text > a |
These are opportunities to improve the legibility of your content.
One main landmark helps screen reader users navigate a web page. Learn more about landmarks.
Performance issues directly impact user engagement and conversion rates.
| Failing Elements |
|---|
html html |
These items highlight common accessibility best practices.
Errors logged to the console indicate unresolved problems. They can come from network request failures and other browser concerns. Learn more about this errors in console diagnostic audit
Performance issues directly impact user engagement and conversion rates.
| Source | Description |
|---|---|
Failed to load resource: net::ERR_NAME_NOT_RESOLVED |
These checks ensure that your page is following basic search engine optimization advice. There are many additional factors Lighthouse does not score here that may affect your search ranking, including performance on Core Web Vitals. Learn more about Google Search Essentials.
Search engines may use `href` attributes on links to crawl websites. Ensure that the `href` attribute of anchor elements links to an appropriate destination, so more pages of the site can be discovered. Learn how to make links crawlable
Performance issues directly impact user engagement and conversion rates.
| Uncrawlable Link |
|---|
Close section.notification-banner > div#notification-banner__lightbox-popup > div.notification-banner__lightbox > a.notification-banner__lightbox-button--close |
View more: div.homepage-content > section#aenterprise_home-page_why-choose > div.l-1col--1 > a.button |
body.health > div.homepage-content > section#aenterprise_home-page-care-near-you > a.story-panel__nav-button body.health > div.homepage-content > section#aenterprise_home-page-care-near-you > a.story-panel__nav-button |
div.homepage-content > section#aenterprise_home-page-care-near-you > div.story-panel__pagination > a.story-panel__pagination-dot div.homepage-content > section#aenterprise_home-page-care-near-you > div.story-panel__pagination > a.story-panel__pagination-dot |
To appear in search results, crawlers need access to your app.
Informative elements should aim for short, descriptive alternate text. Decorative elements can be ignored with an empty alt attribute. Learn more about the `alt` attribute.
Performance issues directly impact user engagement and conversion rates.
| Failing Elements |
|---|
div.homepage-content > section#aenterprise_home-page-care-near-you > a.story-panel__nav-button > img div.homepage-content > section#aenterprise_home-page-care-near-you > a.story-panel__nav-button > img |
Format your HTML in a way that enables crawlers to better understand your app’s content.
Industry-standard audits powered by Google Lighthouse. — Desktop
Key metrics that affect user experience. — Desktop
First Contentful Paint First Contentful Paint — how long until the browser renders the first piece of content. Under 1.8s is good.
1.49 s
Largest Contentful Paint Largest Contentful Paint — how long until the largest visible element loads. Under 2.5s is good.
2.25 s
Total Blocking Time Total Blocking Time — total time the main thread was blocked, preventing user input. Under 200ms is good.
24 ms
Cumulative Layout Shift Cumulative Layout Shift — measures visual stability. How much the page layout shifts during loading. Under 0.1 is good.
0.216
Speed Index Speed Index — how quickly content is visually displayed during load. Under 3.4s is good.
1.49 s
Time to Interactive Time to Interactive — how long until the page is fully interactive and responds to user input. Under 3.8s is good.
2.46 s
Audit breakdown by category with detailed findings.
Remove large, duplicate JavaScript modules from bundles to reduce unnecessary bytes consumed by network activity.
Performance issues directly impact user engagement and conversion rates.
Polyfills and transforms enable older browsers to use new JavaScript features. However, many aren't necessary for modern browsers. Consider modifying your JavaScript build process to not transpile Baseline features, unless you know you must support older browsers. Learn why most sites can deploy ES6+ code without transpiling
Shipping ES5 transpiled code to modern browsers wastes bytes — every user with an evergreen browser pays for compatibility you don't need.
Most users today run browsers that natively support ES6+, async/await, optional chaining, and the rest of modern JavaScript. Transpiling to ES5 'just in case' adds 20-40% to your bundle for no benefit. Configure your build to target a modern browserslist, or ship a differential bundle pair (modern + legacy) with the module/nomodule pattern.
Source: Google web.dev / Lighthouse
3rd party code can significantly impact load performance. Reduce and defer loading of 3rd party code to prioritize your page's content.
Performance issues directly impact user engagement and conversion rates.
A long cache lifetime can speed up repeat visits to your page. Learn more about caching.
Performance issues directly impact user engagement and conversion rates.
Layout shifts occur when elements move absent any user interaction. Investigate the causes of layout shifts, such as elements being added, removed, or their fonts changing as the page loads.
Performance issues directly impact user engagement and conversion rates.
Your first network request is the most important. Reduce its latency by avoiding redirects, ensuring a fast server response, and enabling text compression.
Performance issues directly impact user engagement and conversion rates.
A forced reflow occurs when JavaScript queries geometric properties (such as offsetWidth) after styles have been invalidated by a change to the DOM state. This can result in poor performance. Learn more about forced reflows and possible mitigations.
Performance issues directly impact user engagement and conversion rates.
Optimize LCP by making the LCP image discoverable from the HTML immediately, and avoiding lazy-loading
Performance issues directly impact user engagement and conversion rates.
Avoid chaining critical requests by reducing the length of chains, reducing the download size of resources, or deferring the download of unnecessary resources to improve page load.
Performance issues directly impact user engagement and conversion rates.
Requests are blocking the page's initial render, which may delay LCP. Deferring or inlining can move these network requests out of the critical path.
Performance issues directly impact user engagement and conversion rates.
| URL | Transfer Size | Duration |
|---|---|---|
| cdn.optimizely.com/js/28007920049.js | 122.7 KiB | 544 ms |
| my.clevelandclinic.org/assets/styles/styles.css | 106.9 KiB | 405 ms |
| my.clevelandclinic.org/assets/styles/vendor/magnific-popup.css | 2.1 KiB | 221 ms |
Reducing the download time of images can improve the perceived load time of the page and LCP. Learn more about optimizing image size
Performance issues directly impact user engagement and conversion rates.
| URL | Resource Size | Est Savings | |
|---|---|---|---|
Cleveland Clinic main campus div.story-panel__card-content > a.story-panel__image-link > div.story-panel__image-overlay > img.js-story-panel__image | /-/scassets/images/org/locations/home/cleveland-clinic-ma... | 41.6 KiB | 34.6 KiB |
Cleveland Clinic Canada div.story-panel__card-content > a.story-panel__image-link > div.story-panel__image-overlay > img.js-story-panel__image | /-/scassets/images/org/locations/home/cleveland-clinic-ca... | 36.1 KiB | 29.2 KiB |
Cleveland Clinic Abu Dhabi div.story-panel__card-content > a.story-panel__image-link > div.story-panel__image-overlay > img.js-story-panel__image | /-/scassets/images/org/locations/home/cleveland-clinic-ab... | 35.8 KiB | 29.0 KiB |
Locations div.story-panel__card-content > a.story-panel__image-link > div.story-panel__image-overlay > img.js-story-panel__image | my.clevelandclinic.org/-/scassets/images/org/locations/home/locations-card.jpg | 31.3 KiB | 19.9 KiB |
Cleveland Clinic Florida div.story-panel__card-content > a.story-panel__image-link > div.story-panel__image-overlay > img.js-story-panel__image | /-/scassets/images/org/locations/home/cleveland-clinic-fl... | 22.8 KiB | 18.4 KiB |
Appointments div.story-panel__card-content > a.story-panel__image-link > div.story-panel__image-overlay > img.js-story-panel__image | /-/scassets/images/org/locations/home/appointments-card.jpg | 19.2 KiB | 12.2 KiB |
These insights are also available in the Chrome DevTools Performance Panel - record a trace to view more detailed information.
Reduce unused rules from stylesheets and defer CSS not used for above-the-fold content to decrease bytes consumed by network activity. Learn how to reduce unused CSS.
Performance issues directly impact user engagement and conversion rates.
| URL | Transfer Size | Est Savings |
|---|---|---|
| my.clevelandclinic.org/assets/styles/styles.css | 106.6 KiB | 93.5 KiB |
| fonts.googleapis.com/earlyaccess/notosansscsliced.css | 28.6 KiB | 28.6 KiB |
Reduce unused JavaScript and defer loading scripts until they are required to decrease bytes consumed by network activity. Learn how to reduce unused JavaScript.
Multi-megabyte JavaScript bundles delay every interactive feature on the page.
This is the Lighthouse audit fired when too much JS is shipped relative to what executes. The fix isn't a config flag — it requires bundle analysis (webpack-bundle-analyzer, rollup-plugin-visualizer), splitting routes into chunks, lazy-loading off-screen components, and removing unused dependencies. Fundamentally different from minification: minifying reduces byte count, this reduces what's downloaded at all.
Source: Google web.dev / Lighthouse
| URL | Transfer Size | Est Savings |
|---|---|---|
| www.googletagmanager.com/gtm.js?id=GTM-3M4W | 169.9 KiB | 79.5 KiB |
| oc-cdn-ocprod.azureedge.net/livechatwidget/scripts/LiveChatBootstrapper.js | 112.5 KiB | 65.8 KiB |
| cdn.optimizely.com/js/28007920049.js | 122.1 KiB | 42.1 KiB |
| bigidcmp.cloud/banner.js?siteId=e7a0b4f7-3b3b-49ce-9467-9e699346f114 | 52.7 KiB | 32.1 KiB |
| assets.adobedtm.com/b4225c707162/4900abd505ae/launch-c146ea99d958.min.js | 66.3 KiB | 26.8 KiB |
| my.clevelandclinic.org/assets/scripts/dist/page-scripts.js | 31.2 KiB | 23.8 KiB |
| solutions.invocacdn.com/js/invoca-latest.min.js | 37.6 KiB | 23.0 KiB |
Large network payloads cost users real money and are highly correlated with long load times. Learn how to reduce payload sizes.
Performance issues directly impact user engagement and conversion rates.
Set an explicit width and height on image elements to reduce layout shifts and improve CLS. Learn how to set image dimensions
Performance issues directly impact user engagement and conversion rates.
| URL | |
|---|---|
Getting an appointment at Cleveland Clinic is easy. Schedule using any of these… div.container > div.cta-panel__card > div.cta-panel__card-content > img | /-/scassets/images/org/icons/care-pages/call-to-action/ic... |
Find health and wellness information to help you and your family live a bit hea… div.container > div.cta-panel__card > div.cta-panel__card-content > img | /-/scassets/images/org/icons/care-pages/call-to-action/ic... |
Have a question? We want to make it easy to find what you're looking for. Get a… div.container > div.cta-panel__card > div.cta-panel__card-content > img | /-/scassets/images/org/icons/care-pages/call-to-action/ic... |
patient centered care icon div.spotlight-panel__container > div.spotlight-panel__card > div.spotlight-panel__icon-section > img | /-/scassets/images/org/icons/care-pages/spotlight-panel/p... |
national recognition icon div.spotlight-panel__container > div.spotlight-panel__card > div.spotlight-panel__icon-section > img | /-/scassets/images/org/icons/care-pages/spotlight-panel/n... |
skilled and collaborative providers icon div.spotlight-panel__container > div.spotlight-panel__card > div.spotlight-panel__icon-section > img | /-/scassets/images/org/icons/care-pages/spotlight-panel/s... |
Innovation and Research Icon div.spotlight-panel__container > div.spotlight-panel__card > div.spotlight-panel__icon-section > img | /-/scassets/images/org/icons/care-pages/spotlight-panel/i... |
Emergency icon header.notification-banner__header > span.notification-banner__icon > a.notification-banner__link--expand > img | my.clevelandclinic.org/-/scassets/images/org/icons/icon-emergency-circle.svg |
More information about the performance of your application. These numbers don't directly affect the Performance score.
Redirects introduce additional delays before the page can be loaded. Learn how to avoid page redirects.
Performance issues directly impact user engagement and conversion rates.
| URL | Time Spent |
|---|---|
| clevelandclinic.org/ | 261 ms |
| www.clevelandclinic.org/ | 296 ms |
| my.clevelandclinic.org/ | 0.0 ms |
These are the largest layout shifts observed on the page. Each table item represents a single layout shift, and shows the element that shifted the most. Below each item are possible root causes that led to the layout shift. Some of these layout shifts may not be included in the CLS metric value due to windowing. Learn how to improve CLS
Performance issues directly impact user engagement and conversion rates.
| Element | Layout shift score |
|---|---|
Our Providers
Search by name, specialty, location and more.
Find a Provider
L… div.homepage-content > section#aenterprise_home-page-cards > div.story-panel__carousel > ul.story-panel__cards-container | 0.167 |
| 0.010 | |
We're here when you need us — for every care in the world. div.hero__image > div.container > div.hero__text > h1.hero__title | 0.007 |
body.health body.health | 0.005 |
body.health body.health | 0.004 |
body.health body.health | 0.003 |
body.health body.health | 0.002 |
These checks highlight opportunities to improve the accessibility of your web app. Automatic detection can only detect a subset of issues and does not guarantee the accessibility of your web app, so manual testing is also encouraged.
Some ARIA parent roles must contain specific child roles to perform their intended accessibility functions. Learn more about roles and required children elements.
Performance issues directly impact user engagement and conversion rates.
| Failing Elements |
|---|
Institutes & Departments
Join Our Nursing Team
Careers
Refer a Patient
ConsultQ… div.homepage-content > section#home-page_for-providers > div.content-block__section > div.content-block-faq-panel |
These are opportunities to improve the usage of ARIA in your application which may enhance the experience for users of assistive technology, like a screen reader.
Properly ordered headings that do not skip levels convey the semantic structure of the page, making it easier to navigate and understand when using assistive technologies. Learn more about heading order.
Performance issues directly impact user engagement and conversion rates.
| Failing Elements |
|---|
Our Providers div.story-panel__card > div.story-panel__card-content > a.story-panel__title-link > h3.story-panel__title |
Actions footer.footer > div.container > div.footer__item > h5.footer__title |
These are opportunities to improve keyboard navigation in your application.
Informative elements should aim for short, descriptive alternate text. Decorative elements can be ignored with an empty alt attribute. Learn more about the `alt` attribute.
Performance issues directly impact user engagement and conversion rates.
| Failing Elements |
|---|
div.homepage-content > section#aenterprise_home-page-care-near-you > a.story-panel__nav-button > img div.homepage-content > section#aenterprise_home-page-care-near-you > a.story-panel__nav-button > img |
These are opportunities to improve the semantics of the controls in your application. This may enhance the experience for users of assistive technology, like a screen reader.
Low-contrast text is difficult or impossible for many users to read. Link text that is discernible improves the experience for users with low vision. Learn how to make links distinguishable.
Performance issues directly impact user engagement and conversion rates.
| Failing Elements |
|---|
800.223.2273 div.container > div.l-1col > div.footer__text > a |
These are opportunities to improve the legibility of your content.
One main landmark helps screen reader users navigate a web page. Learn more about landmarks.
Performance issues directly impact user engagement and conversion rates.
| Failing Elements |
|---|
html html |
These items highlight common accessibility best practices.
Errors logged to the console indicate unresolved problems. They can come from network request failures and other browser concerns. Learn more about this errors in console diagnostic audit
Performance issues directly impact user engagement and conversion rates.
| Source | Description |
|---|---|
Failed to load resource: net::ERR_NAME_NOT_RESOLVED |
These checks ensure that your page is following basic search engine optimization advice. There are many additional factors Lighthouse does not score here that may affect your search ranking, including performance on Core Web Vitals. Learn more about Google Search Essentials.
Search engines may use `href` attributes on links to crawl websites. Ensure that the `href` attribute of anchor elements links to an appropriate destination, so more pages of the site can be discovered. Learn how to make links crawlable
Performance issues directly impact user engagement and conversion rates.
| Uncrawlable Link |
|---|
Close section.notification-banner > div#notification-banner__lightbox-popup > div.notification-banner__lightbox > a.notification-banner__lightbox-button--close |
View more: div.homepage-content > section#aenterprise_home-page_why-choose > div.l-1col--1 > a.button |
body.health > div.homepage-content > section#aenterprise_home-page-care-near-you > a.story-panel__nav-button body.health > div.homepage-content > section#aenterprise_home-page-care-near-you > a.story-panel__nav-button |
div.homepage-content > section#aenterprise_home-page-care-near-you > div.story-panel__pagination > a.story-panel__pagination-dot div.homepage-content > section#aenterprise_home-page-care-near-you > div.story-panel__pagination > a.story-panel__pagination-dot |
To appear in search results, crawlers need access to your app.
Informative elements should aim for short, descriptive alternate text. Decorative elements can be ignored with an empty alt attribute. Learn more about the `alt` attribute.
Performance issues directly impact user engagement and conversion rates.
| Failing Elements |
|---|
div.homepage-content > section#aenterprise_home-page-care-near-you > a.story-panel__nav-button > img div.homepage-content > section#aenterprise_home-page-care-near-you > a.story-panel__nav-button > img |
Format your HTML in a way that enables crawlers to better understand your app’s content.
Send Feedback