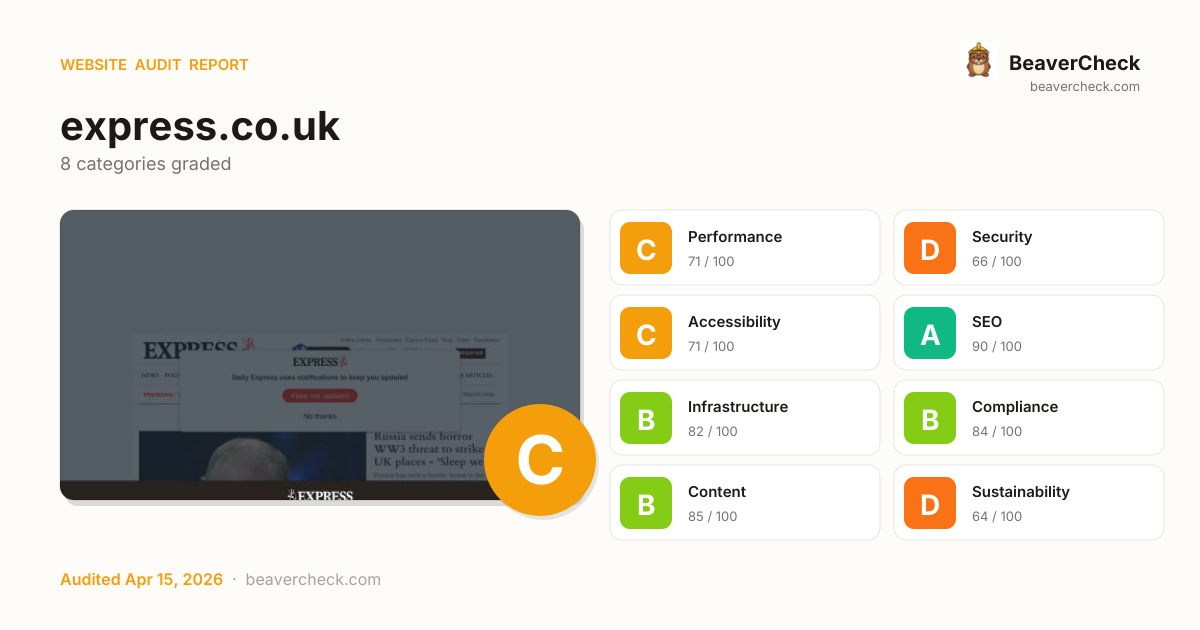
Mobile 375 × 812

Desktop 1440 × 900

Score: 74 / 100
Based on 8 categories, 0 sections
Decent speed, but optimizing further could improve engagement.
Several missing protections leave your users and data exposed.
Mostly accessible, but some users still face barriers.
Well-optimized for search — your content is discoverable.
Good server performance with room for optimization.
Mostly compliant — a few items need attention.
Rich content metadata — your pages look great everywhere.
Heavier than average — reducing page weight saves energy and bandwidth.
The overall score is a weighted average of individual category scores. Categories with more impact on user experience and security carry more weight.
Weights reflect general web best practices. Individual needs may differ.
Content-Security-Policy header is missing
Security gaps expose your site and users to attacks, eroding trust.
No Content-Security-Policy header found
Security gaps expose your site and users to attacks, eroding trust.
2 link(s) with no accessible text
Accessibility issues exclude users with disabilities — up to 15% of your potential audience.
22 image-only link(s) without alt text
Accessibility issues exclude users with disabilities — up to 15% of your potential audience.
121 third-party resources (100% of weight)
Performance issues directly impact user engagement and conversion rates.
High impact, low effort — start here.
High impact, requires investment.
Small gains, minimal effort.
Nothing in this quadrant — good news.
Low impact, high effort — do last.
Nothing in this quadrant — good news.
[](https://beavercheck.com/results/536e3b2c-9bfa-4959-83f6-f864c380cbff)<a href="https://beavercheck.com/results/536e3b2c-9bfa-4959-83f6-f864c380cbff"><img src="https://beavercheck.com/badge?url=https%3A%2F%2Fexpress.co.uk" alt="BeaverCheck Score"></a>https://beavercheck.com/badge?url=https%3A%2F%2Fexpress.co.ukThis badge auto-updates with your latest scan result.
Your site performs reasonably well, but a few targeted fixes could meaningfully improve results. Your LCP of 17.8s exceeds Google's 2.5s 'Good' threshold and the 1 performance issue below directly contributes to it. Addressing the critical issues below would have the most immediate impact on your user trust.
£450 investment → £0.45/month returns + GBP 18,050,000 risk avoided
£450
6h · 5 findings
£0.45 /mo
~£5.41 / year
GBP 18,050,000
if kept compliant
£75 — in quick wins — start here for the fastest payback
Figures combine localized regulatory fine ceilings, search/conversion value priced against local CPC, and bandwidth waste estimates. Results depend on implementation quality and audience composition. Not legal or financial advice.
6.0 developer hours at £75/hr
Based on United Kingdom rates (£75/hr)
Start here for the best return on investment
£1,504,167 / month at risk
~£18,050,005 / year if left unfixed
£18,050,000
+5 more
£0.45 /mo
7151.9 MB/mo × 0.063 GBP/GB
Compliance figures represent the statutory maximum fine for the most severe triggered category, capped per regulation — not the sum of per-finding penalties. Based on published regulatory fine ranges. This is not legal advice.
Unique monthly visitors from your analytics
Purchases, signups, or key actions
Optional — for revenue estimation
more engaged visitors from reduced bounce
Fix 4 critical issues to capture this value
Based on Google/Deloitte research ("Milliseconds Make Millions") showing a ~7% bounce rate increase per additional second of LCP above the 2.5s "Good" threshold.
Your site's LCP: → estimated after fixes.
These are estimates based on industry research — actual results vary
Your data stays in your browser — nothing is sent to our servers
Thanks for your feedback!
We'll use a cached audit if available, or offer to scan.
Industry-standard audits powered by Google Lighthouse.
Key metrics that affect user experience.
First Contentful Paint First Contentful Paint — how long until the browser renders the first piece of content. Under 1.8s is good.
4.80 s
Largest Contentful Paint Largest Contentful Paint — how long until the largest visible element loads. Under 2.5s is good.
17.78 s
Total Blocking Time Total Blocking Time — total time the main thread was blocked, preventing user input. Under 200ms is good.
2.38 s
Cumulative Layout Shift Cumulative Layout Shift — measures visual stability. How much the page layout shifts during loading. Under 0.1 is good.
0.000
Speed Index Speed Index — how quickly content is visually displayed during load. Under 3.4s is good.
7.39 s
Time to Interactive Time to Interactive — how long until the page is fully interactive and responds to user input. Under 3.8s is good.
17.82 s
Audit breakdown by category with detailed findings.
Remove large, duplicate JavaScript modules from bundles to reduce unnecessary bytes consumed by network activity.
Performance issues directly impact user engagement and conversion rates.
Polyfills and transforms enable older browsers to use new JavaScript features. However, many aren't necessary for modern browsers. Consider modifying your JavaScript build process to not transpile Baseline features, unless you know you must support older browsers. Learn why most sites can deploy ES6+ code without transpiling
Shipping ES5 transpiled code to modern browsers wastes bytes — every user with an evergreen browser pays for compatibility you don't need.
Most users today run browsers that natively support ES6+, async/await, optional chaining, and the rest of modern JavaScript. Transpiling to ES5 'just in case' adds 20-40% to your bundle for no benefit. Configure your build to target a modern browserslist, or ship a differential bundle pair (modern + legacy) with the module/nomodule pattern.
Source: Google web.dev / Lighthouse
3rd party code can significantly impact load performance. Reduce and defer loading of 3rd party code to prioritize your page's content.
Performance issues directly impact user engagement and conversion rates.
A long cache lifetime can speed up repeat visits to your page. Learn more about caching.
Performance issues directly impact user engagement and conversion rates.
A forced reflow occurs when JavaScript queries geometric properties (such as offsetWidth) after styles have been invalidated by a change to the DOM state. This can result in poor performance. Learn more about forced reflows and possible mitigations.
Performance issues directly impact user engagement and conversion rates.
Optimize LCP by making the LCP image discoverable from the HTML immediately, and avoiding lazy-loading
Performance issues directly impact user engagement and conversion rates.
Avoid chaining critical requests by reducing the length of chains, reducing the download size of resources, or deferring the download of unnecessary resources to improve page load.
Performance issues directly impact user engagement and conversion rates.
Your first network request is the most important. Reduce its latency by avoiding redirects, ensuring a fast server response, and enabling text compression.
Performance issues directly impact user engagement and conversion rates.
Reducing the download time of images can improve the perceived load time of the page and LCP. Learn more about optimizing image size
Performance issues directly impact user engagement and conversion rates.
| URL | Resource Size | Est Savings | |
|---|---|---|---|
Publisher Logo div#CIPAConsentNotice > div.cipa-dialogue > div.cipa-logo-container > img | cdn.images.express.co.uk/img/express-cmp.png?qc-size=369,117 | 15.6 KiB | 8.6 KiB |
These insights are also available in the Chrome DevTools Performance Panel - record a trace to view more detailed information.
Redirects introduce additional delays before the page can be loaded. Learn how to avoid page redirects.
Performance issues directly impact user engagement and conversion rates.
| URL | Time Spent |
|---|---|
| express.co.uk/ | 760 ms |
| www.express.co.uk/ | 0.0 ms |
Time to Interactive is the amount of time it takes for the page to become fully interactive. Learn more about the Time to Interactive metric.
Performance issues directly impact user engagement and conversion rates.
The maximum potential First Input Delay that your users could experience is the duration of the longest task. Learn more about the Maximum Potential First Input Delay metric.
Performance issues directly impact user engagement and conversion rates.
Reduce unused JavaScript and defer loading scripts until they are required to decrease bytes consumed by network activity. Learn how to reduce unused JavaScript.
Multi-megabyte JavaScript bundles delay every interactive feature on the page.
This is the Lighthouse audit fired when too much JS is shipped relative to what executes. The fix isn't a config flag — it requires bundle analysis (webpack-bundle-analyzer, rollup-plugin-visualizer), splitting routes into chunks, lazy-loading off-screen components, and removing unused dependencies. Fundamentally different from minification: minifying reduces byte count, this reduces what's downloaded at all.
Source: Google web.dev / Lighthouse
Consider reducing the time spent parsing, compiling, and executing JS. You may find delivering smaller JS payloads helps with this. Learn how to reduce Javascript execution time.
Performance issues directly impact user engagement and conversion rates.
Consider reducing the time spent parsing, compiling and executing JS. You may find delivering smaller JS payloads helps with this. Learn how to minimize main-thread work
Performance issues directly impact user engagement and conversion rates.
| Category | Time Spent |
|---|---|
| Script Evaluation | 3.7 s |
| Other | 1.1 s |
| Style & Layout | 999 ms |
| Script Parsing & Compilation | 854 ms |
| Parse HTML & CSS | 188 ms |
| Rendering | 166 ms |
| Garbage Collection | 90 ms |
Minifying CSS files can reduce network payload sizes. Learn how to minify CSS.
Performance issues directly impact user engagement and conversion rates.
| URL | Transfer Size | Est Savings |
|---|---|---|
| .App{ display:flex; justify-content:center; box-sizing:border-box; margin:0; … } … | 2.5 KiB | 2.1 KiB |
Set an explicit width and height on image elements to reduce layout shifts and improve CLS. Learn how to set image dimensions
Performance issues directly impact user engagement and conversion rates.
| URL | |
|---|---|
Logo div > div#push-notification-wrapper > div.logo > img | cdn.images.express.co.uk/img/logo/logo.svg |
Publisher Logo div#CIPAConsentNotice > div.cipa-dialogue > div.cipa-logo-container > img | cdn.images.express.co.uk/img/express-cmp.png?qc-size=369,117 |
More information about the performance of your application. These numbers don't directly affect the Performance score.
These checks highlight opportunities to improve the accessibility of your web app. Automatic detection can only detect a subset of issues and does not guarantee the accessibility of your web app, so manual testing is also encouraged.
Link text (and alternate text for images, when used as links) that is discernible, unique, and focusable improves the navigation experience for screen reader users. Learn how to make links accessible.
Performance issues directly impact user engagement and conversion rates.
| Failing Elements |
|---|
div#dx-maincontainer > header#dx-main-header > div.logo-container > a#premium-btn-subscribe div#dx-maincontainer > header#dx-main-header > div.logo-container > a#premium-btn-subscribe |
div#dx-maincontainer > div.manu-sidebar > div#navigation > a#premium-btn-subscribe div#dx-maincontainer > div.manu-sidebar > div#navigation > a#premium-btn-subscribe |
These are opportunities to improve the semantics of the controls in your application. This may enhance the experience for users of assistive technology, like a screen reader.
Image natural dimensions should be proportional to the display size and the pixel ratio to maximize image clarity. Learn how to provide responsive images.
Performance issues directly impact user engagement and conversion rates.
| URL | Displayed size | Actual size | Expected size | |
|---|---|---|---|---|
Publisher Logo div#CIPAConsentNotice > div.cipa-dialogue > div.cipa-logo-container > img | cdn.images.express.co.uk/img/express-cmp.png?qc-size=369,117 | 412 x 131 | 369 x 117 | 618 x 197 |
Supreme Court in London a.feliz-hp-box > div.lazy-container > picture > img | cdn.images.express.co.uk/img/dynamic/139/183x122/2194402_1.avif | 173 x 115 | 183 x 122 | 260 x 173 |
Deprecated APIs will eventually be removed from the browser. Learn more about deprecated APIs.
Performance issues directly impact user engagement and conversion rates.
| Deprecation / Warning | Source |
|---|---|
| AttributionReporting | connect.facebook.net/en_US/fbevents.js line 279, col 769 |
Source maps translate minified code to the original source code. This helps developers debug in production. In addition, Lighthouse is able to provide further insights. Consider deploying source maps to take advantage of these benefits. Learn more about source maps.
Performance issues directly impact user engagement and conversion rates.
These checks ensure that your page is following basic search engine optimization advice. There are many additional factors Lighthouse does not score here that may affect your search ranking, including performance on Core Web Vitals. Learn more about Google Search Essentials.
Industry-standard audits powered by Google Lighthouse. — Desktop
Key metrics that affect user experience. — Desktop
First Contentful Paint First Contentful Paint — how long until the browser renders the first piece of content. Under 1.8s is good.
987 ms
Largest Contentful Paint Largest Contentful Paint — how long until the largest visible element loads. Under 2.5s is good.
1.93 s
Total Blocking Time Total Blocking Time — total time the main thread was blocked, preventing user input. Under 200ms is good.
155 ms
Cumulative Layout Shift Cumulative Layout Shift — measures visual stability. How much the page layout shifts during loading. Under 0.1 is good.
0.008
Speed Index Speed Index — how quickly content is visually displayed during load. Under 3.4s is good.
1.41 s
Time to Interactive Time to Interactive — how long until the page is fully interactive and responds to user input. Under 3.8s is good.
3.87 s
Audit breakdown by category with detailed findings.
Remove large, duplicate JavaScript modules from bundles to reduce unnecessary bytes consumed by network activity.
Performance issues directly impact user engagement and conversion rates.
Polyfills and transforms enable older browsers to use new JavaScript features. However, many aren't necessary for modern browsers. Consider modifying your JavaScript build process to not transpile Baseline features, unless you know you must support older browsers. Learn why most sites can deploy ES6+ code without transpiling
Shipping ES5 transpiled code to modern browsers wastes bytes — every user with an evergreen browser pays for compatibility you don't need.
Most users today run browsers that natively support ES6+, async/await, optional chaining, and the rest of modern JavaScript. Transpiling to ES5 'just in case' adds 20-40% to your bundle for no benefit. Configure your build to target a modern browserslist, or ship a differential bundle pair (modern + legacy) with the module/nomodule pattern.
Source: Google web.dev / Lighthouse
3rd party code can significantly impact load performance. Reduce and defer loading of 3rd party code to prioritize your page's content.
Performance issues directly impact user engagement and conversion rates.
A forced reflow occurs when JavaScript queries geometric properties (such as offsetWidth) after styles have been invalidated by a change to the DOM state. This can result in poor performance. Learn more about forced reflows and possible mitigations.
Performance issues directly impact user engagement and conversion rates.
Optimize LCP by making the LCP image discoverable from the HTML immediately, and avoiding lazy-loading
Performance issues directly impact user engagement and conversion rates.
Avoid chaining critical requests by reducing the length of chains, reducing the download size of resources, or deferring the download of unnecessary resources to improve page load.
Performance issues directly impact user engagement and conversion rates.
Requests are blocking the page's initial render, which may delay LCP. Deferring or inlining can move these network requests out of the critical path.
Performance issues directly impact user engagement and conversion rates.
| URL | Transfer Size | Duration |
|---|---|---|
| cdn.images.express.co.uk/theme/Responsive/css/dist/app2026041401.min.css | 50.8 KiB | 407 ms |
| cdn.images.express.co.uk/css/dist/web-strip-banner2026041401.min.css | 1.2 KiB | 298 ms |
| cdn.images.express.co.uk/css/dist/version-toggle2026041401.min.css | 1.1 KiB | 298 ms |
| /theme/Responsive/css/dist/push-notification2026041401.mi... | 963 B | 298 ms |
A long cache lifetime can speed up repeat visits to your page. Learn more about caching.
Performance issues directly impact user engagement and conversion rates.
Your first network request is the most important. Reduce its latency by avoiding redirects, ensuring a fast server response, and enabling text compression.
Performance issues directly impact user engagement and conversion rates.
Reducing the download time of images can improve the perceived load time of the page and LCP. Learn more about optimizing image size
Performance issues directly impact user engagement and conversion rates.
| URL | Resource Size | Est Savings | |
|---|---|---|---|
Publisher Logo div#CIPAConsentNotice > div.cipa-dialogue > div.cipa-logo-container > img | cdn.images.express.co.uk/img/express-cmp.png?qc-size=369,117 | 15.6 KiB | 14.1 KiB |
These insights are also available in the Chrome DevTools Performance Panel - record a trace to view more detailed information.
Redirects introduce additional delays before the page can be loaded. Learn how to avoid page redirects.
Performance issues directly impact user engagement and conversion rates.
| URL | Time Spent |
|---|---|
| express.co.uk/ | 209 ms |
| www.express.co.uk/ | 0.0 ms |
Time to Interactive is the amount of time it takes for the page to become fully interactive. Learn more about the Time to Interactive metric.
Performance issues directly impact user engagement and conversion rates.
Reduce unused rules from stylesheets and defer CSS not used for above-the-fold content to decrease bytes consumed by network activity. Learn how to reduce unused CSS.
Performance issues directly impact user engagement and conversion rates.
| URL | Transfer Size | Est Savings |
|---|---|---|
| cdn.images.express.co.uk/theme/Responsive/css/dist/app2026041401.min.css | 50.4 KiB | 45.5 KiB |
Reduce unused JavaScript and defer loading scripts until they are required to decrease bytes consumed by network activity. Learn how to reduce unused JavaScript.
Multi-megabyte JavaScript bundles delay every interactive feature on the page.
This is the Lighthouse audit fired when too much JS is shipped relative to what executes. The fix isn't a config flag — it requires bundle analysis (webpack-bundle-analyzer, rollup-plugin-visualizer), splitting routes into chunks, lazy-loading off-screen components, and removing unused dependencies. Fundamentally different from minification: minifying reduces byte count, this reduces what's downloaded at all.
Source: Google web.dev / Lighthouse
| URL | Transfer Size | Est Savings |
|---|---|---|
| cdn.images.express.co.uk/js/dist/prebid20260414.min.js | 173.9 KiB | 141.6 KiB |
| /pagead/managed/js/gpt/m202604100101/pubads_impl.js | 186.4 KiB | 121.2 KiB |
| /@trinitymirrordigital/auth-ui/auth-ui.min.js?v=1fd39c450... | 130.7 KiB | 89.0 KiB |
| premium.express.co.uk/js/dist/app202602174.min.js | 96.7 KiB | 65.6 KiB |
| cdn.amplitude.com/libs/analytics-browser-gtm-wrapper-3.18.1.js.br | 73.4 KiB | 62.7 KiB |
| premium.express.co.uk/js/dist/app-pp20260212.min.js | 90.3 KiB | 57.8 KiB |
| www.googletagmanager.com/gtm.js?id=GTM-NX7XL77 | 170.0 KiB | 55.8 KiB |
| www.googletagmanager.com/gtag/js?id=AW-17949595080&cx=c>m=4e64e1 | 140.2 KiB | 54.1 KiB |
| connect.facebook.net/en_US/fbevents.js | 96.3 KiB | 34.2 KiB |
| cdn.images.express.co.uk/js/dist/prebid_express20260414.min.js | 80.5 KiB | 33.9 KiB |
| cdn.onesignal.com/sdks/web/v16/OneSignalSDK.page.es6.js?v=160603 | 41.4 KiB | 32.1 KiB |
| cdn.amplitude.com/libs/analytics-browser-gtm-2.23.6-min.js.gz | 48.9 KiB | 25.0 KiB |
| uk-script.dotmetrics.net/Scripts/script.js?v=362 | 28.1 KiB | 21.0 KiB |
Consider reducing the time spent parsing, compiling and executing JS. You may find delivering smaller JS payloads helps with this. Learn how to minimize main-thread work
Performance issues directly impact user engagement and conversion rates.
| Category | Time Spent |
|---|---|
| Script Evaluation | 1.0 s |
| Other | 346 ms |
| Style & Layout | 276 ms |
| Script Parsing & Compilation | 207 ms |
| Parse HTML & CSS | 80 ms |
| Rendering | 63 ms |
| Garbage Collection | 29 ms |
Minifying CSS files can reduce network payload sizes. Learn how to minify CSS.
Performance issues directly impact user engagement and conversion rates.
| URL | Transfer Size | Est Savings |
|---|---|---|
| .App{ display:flex; justify-content:center; box-sizing:border-box; margin:0; … } … | 2.5 KiB | 2.1 KiB |
Set an explicit width and height on image elements to reduce layout shifts and improve CLS. Learn how to set image dimensions
Performance issues directly impact user engagement and conversion rates.
| URL | |
|---|---|
Logo body > div#push-notification-wrapper > div.logo > img | cdn.images.express.co.uk/img/logo/logo.svg |
Publisher Logo div#CIPAConsentNotice > div.cipa-dialogue > div.cipa-logo-container > img | cdn.images.express.co.uk/img/express-cmp.png?qc-size=369,117 |
More information about the performance of your application. These numbers don't directly affect the Performance score.
These checks highlight opportunities to improve the accessibility of your web app. Automatic detection can only detect a subset of issues and does not guarantee the accessibility of your web app, so manual testing is also encouraged.
Low-contrast text is difficult or impossible for many users to read. Learn how to provide sufficient color contrast.
Performance issues directly impact user engagement and conversion rates.
| Failing Elements |
|---|
Reach and across our entities div.cipa-dialogue > div.cipa-notice-info > p > a.express |
cookies div.cipa-dialogue > div.cipa-notice-info > p > a.express |
Privacy Notice div.cipa-dialogue > div.cipa-notice-info > p > a.express |
Terms and Conditions. div.cipa-dialogue > div.cipa-notice-info > p > a.express |
These are opportunities to improve the legibility of your content.
Link text (and alternate text for images, when used as links) that is discernible, unique, and focusable improves the navigation experience for screen reader users. Learn how to make links accessible.
Performance issues directly impact user engagement and conversion rates.
| Failing Elements |
|---|
header.dx-main-header > div.wrapper > div.row > a#premium-btn-subscribe header.dx-main-header > div.wrapper > div.row > a#premium-btn-subscribe |
These are opportunities to improve the semantics of the controls in your application. This may enhance the experience for users of assistive technology, like a screen reader.
Deprecated APIs will eventually be removed from the browser. Learn more about deprecated APIs.
Performance issues directly impact user engagement and conversion rates.
| Deprecation / Warning | Source |
|---|---|
| AttributionReporting | connect.facebook.net/en_US/fbevents.js line 279, col 769 |
Source maps translate minified code to the original source code. This helps developers debug in production. In addition, Lighthouse is able to provide further insights. Consider deploying source maps to take advantage of these benefits. Learn more about source maps.
Performance issues directly impact user engagement and conversion rates.
These checks ensure that your page is following basic search engine optimization advice. There are many additional factors Lighthouse does not score here that may affect your search ranking, including performance on Core Web Vitals. Learn more about Google Search Essentials.
Send Feedback