Global Performance
6/6 locations ✓Acceptable global latency — average 299ms across 6 locations, fastest from New York (45ms), slowest from Madrid (534ms). No CDN detected. Cache-Control header is missing. 2 locations above the 500ms target.
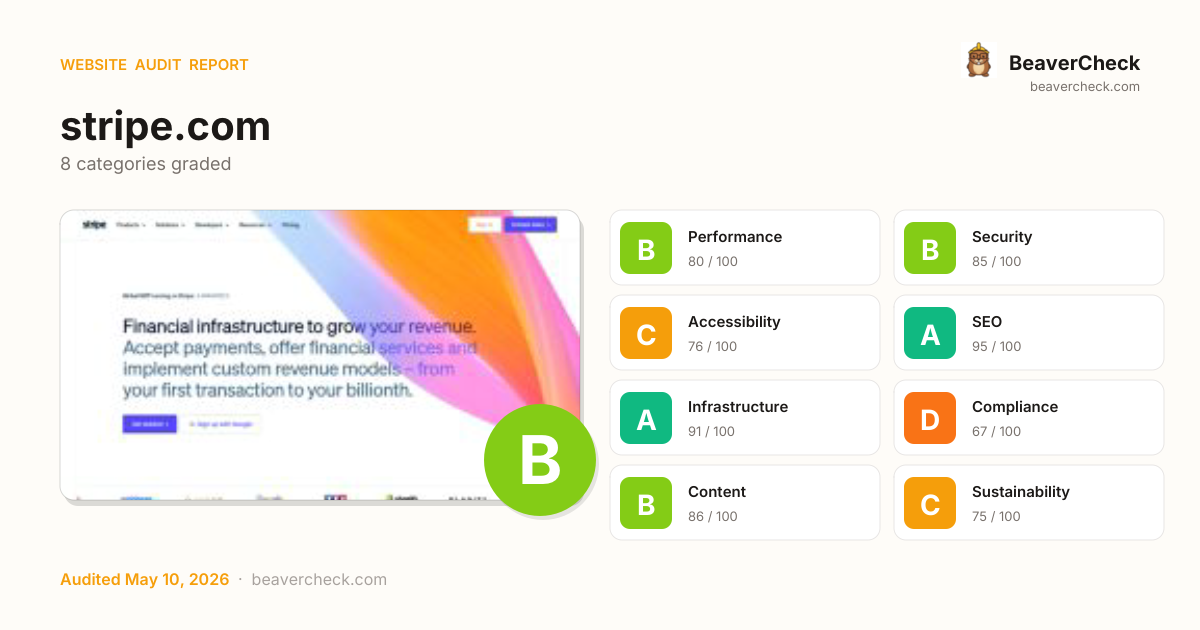
Audit overview
Compliance needs attention; the rest of the categories are in good shape.
Fix Priority Matrix
5 findingsQuick Wins
3High impact, low effort — start here.
Strategic
2High impact, requires investment.
Easy Improvements
0Small gains, minimal effort.
Nothing in this quadrant — good news.
Deprioritize
0Low impact, high effort — do last.
Nothing in this quadrant — good news.
Screenshots


Top Priorities (5)
32 link(s) with no accessible text
Links with no accessible text (empty <a></a>, image-only no alt, icon-only no aria-label) are unidentifiable to screen readers.
114 third-party resources (90% of weight)
Informational: third-party resource count and their share of page weight. High share caps perf gains from frontend optimization.
122 HTTP requests — consider bundling or reducing
High HTTP request count — bundling, sprite-ing, and HTTP/2 server push can reduce per-request overhead.
171 inline style attribute(s) detected
Inline style attributes force `style-src 'unsafe-inline'` in any CSP -- effectively negating CSP's XSS-mitigation value for stylesheets.
6 render-blocking stylesheet(s) -- recommended: <=3
Informational: a Permissions-Policy directive showing feature -> allowed origins.
Business case
What fixing the audit's findings is worth -- and what ignoring them keeps costing.
Return on investment
€680 investment → €5,570/month returns + EUR 20,500,000 risk avoided
Figures combine localized regulatory fine ceilings, search/conversion value priced against local CPC, and bandwidth waste estimates. Results depend on implementation quality and audience composition. Not legal or financial advice.
Conversion barriers
5 barrier(s) likely increasing bounce by ~28%.
- Page takes 8.1s to loadUsers abandon at ~3s — you're 5.6s over the 2.5s threshold→ Optimize render-blocking resources, preload the hero image, and compress images
- Page feels frozen for 12.3sClicks on the primary CTA are ignored while JavaScript runs→ Break up long tasks; defer non-critical JavaScript to post-hydration
- 3 broken link(s) on the pageClicks land on 404s — trust drops and the session often ends→ Fix or remove the broken destinations surfaced on the Content tab
- 33 link(s) with generic text ("click here", "read more")Screen-reader users navigating by link list see no context — and search engines can't infer relevance→ Rewrite with descriptive phrases that identify the destination
- No skip-to-content linkKeyboard and screen-reader users must tab through the entire header on every page→ Add a visible-on-focus <a href="#main">Skip to content</a> as the first focusable element
Preliminary CRO audit — each barrier links to the tab with detailed analysis.
Remediation cost
Start here for the best return on investment
Cost by category
Cost by effort level
Adjust assumptions
Team composition
Multiplier applied to dev hours to reflect QA, design, and PM overhead. Use Dev only for solo work; Full team for projects with formal review processes.
Rates reflect fully-loaded developer cost including overhead
Warning:Cost of inaction
Compliance Risk
€20.500.000
- Privacy Policy not detectedRGPD: EUR 10.000 – EUR 20.000.000
- Skip navigation link is missing (WCAG 2.4.1)EAA: EUR 1.000 – EUR 500.000
- Multiple H1 headings (2 found)EAA: EUR 1.000 – EUR 500.000
Bounce-Rate Cost
€2.340 /mo
+27.5pp bounce · ~2,753 lost visitors/mo
CPC: EUR 0.85
Bandwidth Waste
€0,44 /mo
5921.4 MB/mo × 0.074 EUR/GB
- Optimize transfer: save ~592 KB per page loadSaves €0,44/mo
Compliance figures represent the statutory maximum fine for the most severe triggered category, capped per regulation — not the sum of per-finding penalties. Based on published regulatory fine ranges. This is not legal advice.
Unique monthly visitors from your analytics
Purchases, signups, or key actions
Optional — for revenue estimation
more engaged visitors from reduced bounce
Fix 1 critical issues to capture this value
How this is calculated
Based on Google/Deloitte research ("Milliseconds Make Millions") showing a ~7% bounce rate increase per additional second of LCP above the 2.5s "Good" threshold.
Your site's LCP: → estimated after fixes.
These are estimates based on industry research — actual results vary
Your data stays in your browser — nothing is sent to our servers
Lighthouse
Mobile
First Contentful Paint First Contentful Paint — how long until the browser renders the first piece of content. Under 1.8s is good.
3.30 s
Largest Contentful Paint Largest Contentful Paint — how long until the largest visible element loads. Under 2.5s is good.
8.07 s
Total Blocking Time Total Blocking Time — total time the main thread was blocked, preventing user input. Under 200ms is good.
12.28 s
Cumulative Layout Shift Cumulative Layout Shift — measures visual stability. How much the page layout shifts during loading. Under 0.1 is good.
0.028
Speed Index Speed Index — how quickly content is visually displayed during load. Under 3.4s is good.
6.94 s
Time to Interactive Time to Interactive — how long until the page is fully interactive and responds to user input. Under 3.8s is good.
29.70 s
Desktop
First Contentful Paint First Contentful Paint — how long until the browser renders the first piece of content. Under 1.8s is good.
1.11 s
Largest Contentful Paint Largest Contentful Paint — how long until the largest visible element loads. Under 2.5s is good.
3.50 s
Total Blocking Time Total Blocking Time — total time the main thread was blocked, preventing user input. Under 200ms is good.
18.35 s
Cumulative Layout Shift Cumulative Layout Shift — measures visual stability. How much the page layout shifts during loading. Under 0.1 is good.
0.015
Speed Index Speed Index — how quickly content is visually displayed during load. Under 3.4s is good.
6.24 s
Time to Interactive Time to Interactive — how long until the page is fully interactive and responds to user input. Under 3.8s is good.
33.85 s
Categories
8Performance
114 third-party resources (90% of weight)
Security
171 inline style attribute(s) detected
Accessibility
32 link(s) with no accessible text
SEO
All checks pass
Infrastructure
All checks pass
Compliance
All checks pass
Content
All checks pass
Sustainability
All checks pass
How you compare
Where this site stands against peers running the same stack.
Top 10% of Cart Functionality sites score 86+ on Compliance; you're at 67 — closing this gap is the highest-leverage improvement.
Top 10% of Amazon Route 53 sites score 86+ on Compliance; you're at 67 — closing this gap is the highest-leverage improvement.
Technology stack
Amazon Route 53, hosted on Amazon Web Services, with Amazon S3 CDN
Stack Architecture
 Cart Functionality
  Open Graph
  Priority Hints
  React
React  Sentry
  Three.js 178
 Webpack
  core-js 3.6.5
 dc.js
dc.js  Amazon S3
  Nginx
Nginx  Amazon Web Services
  Next.js 14.2.30
All Detected Technologies (20)
Amazon S3 or Amazon Simple Storage Service is a service offered by Amazon Web Services (AWS) that provides object storage through a web service interface.
Nginx is a web server that can also be used as a reverse proxy, load balancer, mail proxy and HTTP cache.
Amazon Web Services (AWS) is a comprehensive cloud services platform offering compute power, database storage, content delivery and other functionality.
Next.js is a React framework for developing single page Javascript applications.
Websites that have a shopping cart or checkout page, either using a known ecommerce platform or a custom solution.
HTTP Strict Transport Security (HSTS) informs browsers that the site should only be accessed using HTTPS.
Open Graph is a protocol that is used to integrate any web page into the social graph.
Priority Hints exposes a mechanism for developers to signal a relative priority for browsers to consider when fetching resources.
React is an open-source JavaScript library for building user interfaces or UI components.
Sentry is an open-source platform for workflow productivity, aggregating errors from across the stack in real time.
Three.js is a cross-browser JavaScript library and application programming interface used to create and display animated 3D computer graphics in a web browser using WebGL.
Webpack is an open-source JavaScript module bundler.
core-js is a modular standard library for JavaScript, with polyfills for cutting-edge ECMAScript features.
A multi-dimensional charting library built to work natively with crossfilter and rendered using d3.js
Observations (2)
No build tool detected
A framework (Amazon Route 53) was detected but no bundler was identified. The build tool may not be detectable from output patterns, or the site may use the framework's built-in bundler.
Complex technology stack detected
20 technologies identified. A complex stack increases maintenance burden and attack surface. Consider whether all components are actively needed.
Show your score
Drop this badge on your README, marketing site, or status page. It auto-updates every time the audit re-runs and links back to this report.
This badge auto-updates with your latest scan result.
[](https://beavercheck.com/results/58ba54db-bee8-4d0f-9f25-89762824e385)<a href="https://beavercheck.com/results/58ba54db-bee8-4d0f-9f25-89762824e385"><img src="https://beavercheck.com/badge?url=https%3A%2F%2Fstripe.com" alt="BeaverCheck Score"></a>https://beavercheck.com/badge?url=https%3A%2F%2Fstripe.comExport & share
Download the audit, share with your team, or grab a fix plan ready to copy into your tracker.
Copies markdown to clipboard
Fix Plan
Three-week roadmap to ship the audit's findings, with one-click copy targets for your tracker.
Three-week fix plan
2 sprints · 8h total → projected B (87)
Sprint 1: Quick Wins
+4Highest ROI — low effort, high impact
- · 32 link(s) with no accessible text
- · 114 third-party resources (90% of weight)
- · 6 render-blocking stylesheet(s) -- recommended: <=3
Sprint 2: Core Fixes
+1Medium effort, high structural impact
- · 122 HTTP requests — consider bundling or reducing
- · 171 inline style attribute(s) detected