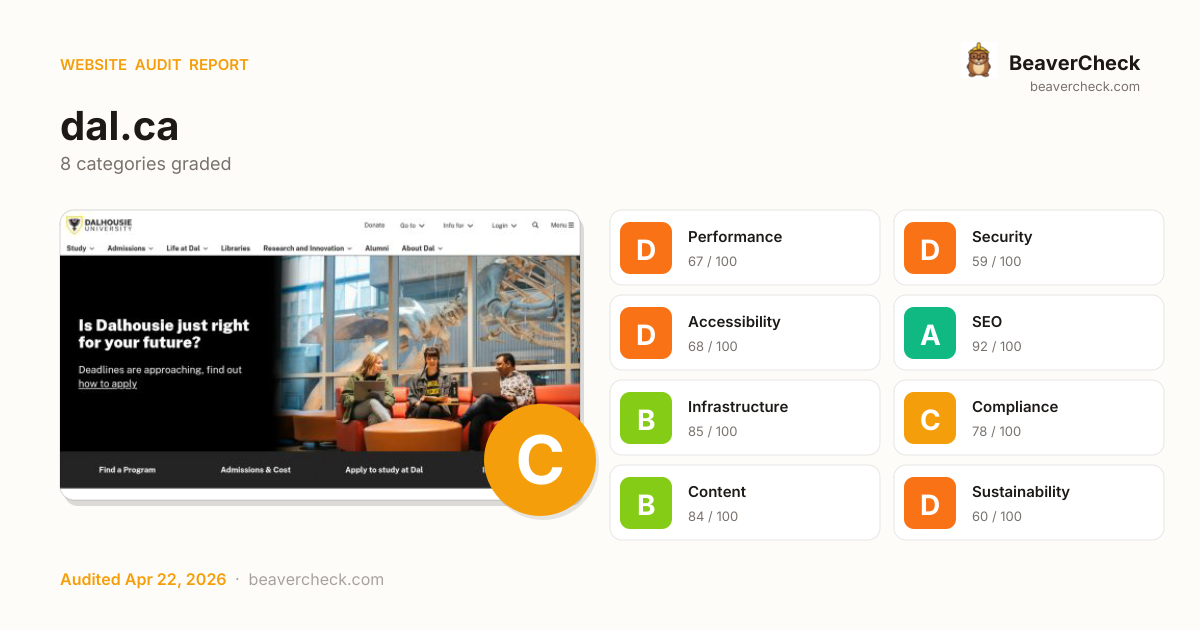
Skip to content
Audit Complete

Results for https://dal.ca

Visit site
CA · CAD (CA$) · Estimated Applicable regulations: PIPEDA · ACA Dev cost: CA$ 95/hr How jurisdiction is detected
Singapore Singapore · Singapore Completed: Apr 22, 2026 20:19 UTC
Download JSON Download Markdown Report

Mobile 375 × 812

Screenshot of the audited page (Mobile 375×812)

Desktop 1440 × 900

Screenshot of the audited page (Desktop 1440×900)
C71

Site Health

Score: 71 / 100

Based on 8 categories, 0 sections

Room to improve — your 6.7s load time is above Google's 2.5s 'Good' threshold.

Several missing protections leave your users and data exposed.

Several issues make your site difficult for assistive technology users.

Well-optimized for search — your content is discoverable.

Solid infrastructure — fast server responses across the board.

Mostly compliant — a few items need attention.

Good content signals with minor gaps.

Heavier than average — reducing page weight saves energy and bandwidth.

How is this calculated?

The overall score is a weighted average of individual category scores. Categories with more impact on user experience and security carry more weight.

Performance 25%Security 25%Accessibility 15%SEO 10%Infrastructure 10%Compliance 8%Content 5%Sustainability 2%

Weights reflect general web best practices. Individual needs may differ.

How the composite score is calculated

How you compare

Adobe Experience Manager · 129 peers
You 71
·
Avg 72
At average
0 50 100
Better than 26% of Adobe Experience Manager sites See full Adobe Experience Manager benchmark →
Apple · 1007 peers
You 71
·
Avg 72
At average
0 50 100
Better than 22% of Apple sites See full Apple benchmark →

Top Priorities (5)

1

Content-Security-Policy header is missing

Security gaps expose your site and users to attacks, eroding trust.

Security › Security Headers
2

HSTS header is missing

Security gaps expose your site and users to attacks, eroding trust.

Security › Security Headers
3

No Content-Security-Policy header found

Security gaps expose your site and users to attacks, eroding trust.

Security › Content Security Policy
4

147 third-party resources (100% of weight)

Performance issues directly impact user engagement and conversion rates.

Performance › Page Weight Inventory
5

148 HTTP requests — consider bundling or reducing

Performance issues directly impact user engagement and conversion rates.

Performance › Page Weight Budget
View fix priority matrix

Fix Priority Matrix

5 findings

Quick Wins

3

High impact, low effort — start here.

Strategic

2

High impact, requires investment.

Easy Improvements

0

Small gains, minimal effort.

Nothing in this quadrant — good news.

Deprioritize

0

Low impact, high effort — do last.

Nothing in this quadrant — good news.

← Low effort High effort →
BeaverCheck badge
Embed this badge
[![BeaverCheck](https://beavercheck.com/badge?url=https%3A%2F%2Fdal.ca)](https://beavercheck.com/results/58eeff66-28ec-4cb9-965f-f4e0d90ab2f9)
<a href="https://beavercheck.com/results/58eeff66-28ec-4cb9-965f-f4e0d90ab2f9"><img src="https://beavercheck.com/badge?url=https%3A%2F%2Fdal.ca" alt="BeaverCheck Score"></a>
https://beavercheck.com/badge?url=https%3A%2F%2Fdal.ca

This badge auto-updates with your latest scan result.

What fixing these means

Your site performs reasonably well, but a few targeted fixes could meaningfully improve results. Your LCP of 6.7s exceeds Google's 2.5s 'Good' threshold and the 2 performance issues below directly contribute to it. The 3 security gaps leave your users exposed — modern browsers increasingly warn visitors about insecure sites. Addressing the critical issues below would have the most immediate impact on your user trust.

3 security gaps detected — browsers may warn visitors about your site.
Your LCP is 6.7s — fixing the 2 performance criticals could bring it under Google's 2.5s 'Good' threshold.

Conversion Barriers

2 critical 4 warning

6 barrier(s) likely increasing bounce by ~27%.

Speed (2)

Page takes 6.7s to load

+12% bounce

Users abandon at ~3s — you're 4.2s over the 2.5s threshold

Fix: Optimize render-blocking resources, preload the hero image, and compress images

Page feels frozen for 3.9s

+5% bounce

Clicks on the primary CTA are ignored while JavaScript runs

Fix: Break up long tasks; defer non-critical JavaScript to post-hydration

Trust (2)

No HSTS header

+1% bounce

Returning visitors are briefly exposed to downgrade attacks on first request

Fix: Set Strict-Transport-Security: max-age=31536000; includeSubDomains

No Content-Security-Policy header

+1% bounce

Higher XSS blast radius — one compromised script can exfiltrate the checkout form

Fix: Ship a reporting-only CSP first, then enforce once violations are clean

Content (1)

No structured data

+2% bounce

No rich-result eligibility in Google — lower SERP CTR vs competitors with stars and prices

Fix: Add JSON-LD for your page type (Product, Article, FAQPage, LocalBusiness, …)

Navigation (1)

1 broken link(s) on the page

+2% bounce

Clicks land on 404s — trust drops and the session often ends

Fix: Fix or remove the broken destinations surfaced on the Content tab

Preliminary CRO audit — each barrier links to the tab with detailed analysis.

Return on Investment

CAD 523 investment → CAD 4,986/month returns + CAD 350,000 risk avoided

Payback period: < 1 month First-year ROI: +11351%

Investment

CAD 523

6h · 5 findings

Monthly returns

CAD 4,986 /mo

~CAD 59,833 / year

  • Conversions recovered CAD 4,985
  • Bandwidth savings CAD 1.29

Regulatory risk avoided

CAD 350,000

if kept compliant

  • ACA CAD 250,000
  • PIPEDA CAD 100,000

Payback period

0 12mo 24mo

CAD 143 — in quick wins — start here for the fastest payback

Figures combine localized regulatory fine ceilings, search/conversion value priced against local CPC, and bandwidth waste estimates. Results depend on implementation quality and audience composition. Not legal or financial advice.

Full methodology & sources

Estimated Remediation Cost

CA$523

5.5 developer hours at CA$95/hr

Based on Canada rates (CA$95/hr)

Quick wins
CA$143 3 fixes in ~90 minutes

Start here for the best return on investment

Cost by category

Cost by effort level

Adjust assumptions
CA$ /hr

Rates reflect fully-loaded developer cost including overhead

How developer rates are sourced

What Inaction Is Costing You

CAD 29,168 / month at risk

~CAD 350,016 / year if left unfixed

Compliance Risk

CAD 350,000

ACAPIPEDA
  • No privacy policy link detected
    PIPEDA: CAD 1,000 – CAD 100,000
  • 2 advertising/retargeting trackers detected
    PIPEDA: CAD 1,000 – CAD 100,000
  • Trackers detected but no cookie policy found
    PIPEDA: CAD 1,000 – CAD 100,000

+2 more

Bandwidth Waste

CAD 1.29 /mo

11968.8 MB/mo × 0.108 CAD/GB

  • Optimize transfer: save ~1.2 MB per page load
    Saves CAD 1.29/mo

Compliance figures represent the statutory maximum fine for the most severe triggered category, capped per regulation — not the sum of per-finding penalties. Based on published regulatory fine ranges. This is not legal advice.

Compliance methodology · SEO assumptions · Bandwidth model

Your performance is already good — improvements may show diminishing returns

Unique monthly visitors from your analytics

Purchases, signups, or key actions

Optional — for revenue estimation

additional conversions/month

more engaged visitors from reduced bounce

potential monthly revenue
Current bounce (est.)
After fixes (est.)
Estimated bounce reduction

Fix 3 critical issues to capture this value

How this is calculated

Based on Google/Deloitte research ("Milliseconds Make Millions") showing a ~7% bounce rate increase per additional second of LCP above the 2.5s "Good" threshold.

Your site's LCP: → estimated after fixes.

These are estimates based on industry research — actual results vary

Bounce-rate model & assumptions

Your data stays in your browser — nothing is sent to our servers

Was this report useful?

Thanks for your feedback!

We'll use a cached audit if available, or offer to scan.

Checking for existing audit...

Lighthouse Scores

Industry-standard audits powered by Google Lighthouse.

35
Performance Overall performance score (0–100) based on Core Web Vitals and other metrics. 90+ is good.
94
Accessibility Measures how accessible the page is for users with disabilities. Checks color contrast, ARIA labels, and semantic HTML.
77
Best Practices Checks for modern web development best practices including HTTPS, no console errors, and secure JavaScript.
100
SEO Measures basic SEO optimizations: meta tags, crawlability, link text, and mobile friendliness.

Core Web Vitals

Key metrics that affect user experience.

First Contentful Paint First Contentful Paint — how long until the browser renders the first piece of content. Under 1.8s is good.

4.01 s

Largest Contentful Paint Largest Contentful Paint — how long until the largest visible element loads. Under 2.5s is good.

6.69 s

Total Blocking Time Total Blocking Time — total time the main thread was blocked, preventing user input. Under 200ms is good.

3.86 s

Cumulative Layout Shift Cumulative Layout Shift — measures visual stability. How much the page layout shifts during loading. Under 0.1 is good.

0.081

Speed Index Speed Index — how quickly content is visually displayed during load. Under 3.4s is good.

4.51 s

Time to Interactive Time to Interactive — how long until the page is fully interactive and responds to user input. Under 3.8s is good.

29.99 s

Detailed Report

Audit breakdown by category with detailed findings.

35

Performance

Insights

Remove large, duplicate JavaScript modules from bundles to reduce unnecessary bytes consumed by network activity.

Why this matters

Performance issues directly impact user engagement and conversion rates.

Polyfills and transforms enable older browsers to use new JavaScript features. However, many aren't necessary for modern browsers. Consider modifying your JavaScript build process to not transpile Baseline features, unless you know you must support older browsers. Learn why most sites can deploy ES6+ code without transpiling

Why this matters

Shipping ES5 transpiled code to modern browsers wastes bytes — every user with an evergreen browser pays for compatibility you don't need.

Learn more

Most users today run browsers that natively support ES6+, async/await, optional chaining, and the rest of modern JavaScript. Transpiling to ES5 'just in case' adds 20-40% to your bundle for no benefit. Configure your build to target a modern browserslist, or ship a differential bundle pair (modern + legacy) with the module/nomodule pattern.

Source: Google web.dev / Lighthouse

3rd party code can significantly impact load performance. Reduce and defer loading of 3rd party code to prioritize your page's content.

Why this matters

Performance issues directly impact user engagement and conversion rates.

Your first network request is the most important. Reduce its latency by avoiding redirects, ensuring a fast server response, and enabling text compression.

Why this matters

Performance issues directly impact user engagement and conversion rates.

A forced reflow occurs when JavaScript queries geometric properties (such as offsetWidth) after styles have been invalidated by a change to the DOM state. This can result in poor performance. Learn more about forced reflows and possible mitigations.

Why this matters

Performance issues directly impact user engagement and conversion rates.

headings: [map[key:source label:Source valueType:source-location] map[granularity:1 key:reflowTime label:Total reflow time valueType:ms]]
items: [map[reflowTime:62.973 source:map[type:text value:[unattributed]]] map[reflowTime:4.818 source:map[column:49477 line:1 type:source-location url:https://www.dal.ca/etc.clientlibs/dal-main/clientlibs/clientlib-site.lt_011ee1c126a6c1fd9fcd645daa97f89a.min.js urlProvider:network]] map[reflowTime:0.352 source:map[column:50173 line:1 type:source-location url:https://www.dal.ca/etc.clientlibs/dal-main/clientlibs/clientlib-site.lt_011ee1c126a6c1fd9fcd645daa97f89a.min.js urlProvider:network]] map[reflowTime:0.263 source:map[column:50231 line:1 type:source-location url:https://www.dal.ca/etc.clientlibs/dal-main/clientlibs/clientlib-site.lt_011ee1c126a6c1fd9fcd645daa97f89a.min.js urlProvider:network]] map[reflowTime:0.227 source:map[column:50295 line:1 type:source-location url:https://www.dal.ca/etc.clientlibs/dal-main/clientlibs/clientlib-site.lt_011ee1c126a6c1fd9fcd645daa97f89a.min.js urlProvider:network]] map[reflowTime:0.772 source:map[column:49455 line:1 type:source-location url:https://www.dal.ca/etc.clientlibs/dal-main/clientlibs/clientlib-site.lt_011ee1c126a6c1fd9fcd645daa97f89a.min.js urlProvider:network]] map[reflowTime:0.43 source:map[column:429908 line:1 type:source-location url:https://www.dal.ca/etc.clientlibs/dal-main/clientlibs/clientlib-site.lt_011ee1c126a6c1fd9fcd645daa97f89a.min.js urlProvider:network]]]

Reducing the download time of images can improve the perceived load time of the page and LCP. Learn more about optimizing image size

Why this matters

Performance issues directly impact user engagement and conversion rates.

URLResource SizeEst Savings
two researchers examining plants div#teaser-82d97423f4 > div.cmp-teaser__image > div#teaser-82d97423f4-image > img.cmp-image__image
/_jcr_content/root/maincontent/main/container_433277233/t...138.9 KiB98.5 KiB
Dalhousie Studley Campus div.image > div#image-0c99fff8f5 > a.cmp-image__link > img.cmp-image__image
/_jcr_content/root/maincontent/main/container_433277233_/...139.0 KiB93.7 KiB
Dal Students on campus div#teaser-a0c49d2871 > div.cmp-teaser__image > div#teaser-a0c49d2871-image > img.cmp-image__image
/_jcr_content/root/maincontent/main/container_433277233/t...118.2 KiB77.7 KiB
Eight students are dancing on stage in costumes showcasing fashion from 1897. a.cmp-teaser__link > div.cmp-teaser__image > div#teaser-93729a85da-image > img.cmp-image__image
/_jcr_content/root/maincontent/main/container/container_c...78.5 KiB45.5 KiB
Posed shots of four recipients. a.cmp-teaser__link > div.cmp-teaser__image > div#teaser-6bfd9a2d46-image > img.cmp-image__image
/_jcr_content/root/maincontent/main/container/container_c...72.5 KiB39.5 KiB
a.cmp-teaser__link > div.cmp-teaser__image > div#teaser-34a5cc8aea-image > img.cmp-image__image a.cmp-teaser__link > div.cmp-teaser__image > div#teaser-34a5cc8aea-image > img.cmp-image__image
/_jcr_content/root/maincontent/main/container/container_c...59.6 KiB26.6 KiB
Three students sit on an orange sofa working on laptops. Behind them, windows o… div#hero-7fe1e4dd23 > div.cmp-teaser__image > div#hero-7fe1e4dd23-image > img.cmp-image__image
/_jcr_content/root/maincontent/main/hero_816095912_copy.c...78.0 KiB25.1 KiB
Overhead shot of a brightly coloured street mural. a.cmp-teaser__link > div.cmp-teaser__image > div#teaser-a6088fefd3-image > img.cmp-image__image
/_jcr_content/root/maincontent/main/container_541149697_/...51.2 KiB19.7 KiB
A person in scuba gear underwater. a.cmp-teaser__link > div.cmp-teaser__image > div#teaser-947481e57e-image > img.cmp-image__image
/_jcr_content/root/maincontent/main/container_541149697_/...51.6 KiB15.9 KiB
A headshot of Dr. Blaine Fiss in a blue lab jacket. a.cmp-teaser__link > div.cmp-teaser__image > div#teaser-36c78f9730-image > img.cmp-image__image
/_jcr_content/root/maincontent/main/container/container_c...43.4 KiB10.4 KiB

Optimize LCP by making the LCP image discoverable from the HTML immediately, and avoiding lazy-loading

Why this matters

Performance issues directly impact user engagement and conversion rates.

lhId: page-6-IMG
nodeLabel: Three students sit on an orange sofa working on laptops. Behind them, windows o…
path: 1,HTML,1,BODY,2,DIV,2,DIV,0,DIV,0,DIV,2,MAIN,0,DIV,0,DIV,0,DIV,1,DIV,0,DIV,0,IMG
selector: div#hero-7fe1e4dd23 > div.cmp-teaser__image > div#hero-7fe1e4dd23-image > img.cmp-image__image
snippet: <img src="https://www.dal.ca/_jcr_content/root/maincontent/main/hero_816095912_copy.…" srcset="https://www.dal.ca/_jcr_content/root/maincontent/main/hero_816095912_copy.…" class="cmp-image__image" itemprop="contentUrl" width="6240" height="4160" alt="Three students sit on an orange sofa working on laptops. Behind them, wind…">

Avoid chaining critical requests by reducing the length of chains, reducing the download size of resources, or deferring the download of unnecessary resources to improve page load.

Why this matters

Performance issues directly impact user engagement and conversion rates.

description: [preconnect](https://developer.chrome.com/docs/lighthouse/performance/uses-rel-preconnect/) hints help the browser establish a connection earlier in the page load, saving time when the first request for that origin is made. The following are the origins that the page preconnected to.
title: Preconnected origins
description: Add [preconnect](https://developer.chrome.com/docs/lighthouse/performance/uses-rel-preconnect/) hints to your most important origins, but try to use no more than 4.
title: Preconnect candidates

Requests are blocking the page's initial render, which may delay LCP. Deferring or inlining can move these network requests out of the critical path.

Why this matters

Performance issues directly impact user engagement and conversion rates.

A long cache lifetime can speed up repeat visits to your page. Learn more about caching.

Why this matters

Performance issues directly impact user engagement and conversion rates.

RequestCache TTLTransfer Size
connect.facebook.net/en_US/fbevents.js1200.0 s96.6 KiB
/signals/config/1165669311003126?v=2.9.303&r=stable&domai...1200.0 s44.9 KiB
scripts.clarity.ms/0.8.59-beta/clarity.js0.0 ms26.1 KiB
/signals/config/117970075559907?v=2.9.303&r=stable&domain...1200.0 s18.4 KiB
/signals/config/329309355875603?v=2.9.303&r=stable&domain...1200.0 s16.4 KiB
/signals/config/965573722171828?v=2.9.303&r=stable&domain...1200.0 s16.4 KiB
/signals/config/1322335958189833?v=2.9.303&r=stable&domai...1200.0 s16.4 KiB
/signals/config/3322336551373660?v=2.9.303&r=stable&domai...1200.0 s16.3 KiB
/signals/config/902260850395912?v=2.9.303&r=stable&domain...1200.0 s16.3 KiB
/signals/config/687563759257831?v=2.9.303&r=stable&domain...1200.0 s16.3 KiB
/signals/config/1136035060711876?v=2.9.303&r=stable&domai...1200.0 s16.3 KiB
/signals/config/901595522693840?v=2.9.303&r=stable&domain...1200.0 s16.3 KiB
snap.licdn.com/li.lms-analytics/insight.min.js86400.0 s18.7 KiB
/collect?v=2&fmt=js&pid=4295716&time=1776889108041&li_ads...0.0 ms271 B
/tr/?id=901595522693840&ev=PageView&dl=https%3A%2F%2Fwww....0.0 ms20 B
/tr/?id=1165669311003126&ev=PageView&dl=https%3A%2F%2Fwww...0.0 ms16 B
/tr/?id=1322335958189833&ev=PageView&dl=https%3A%2F%2Fwww...0.0 ms16 B
/tr/?id=1136035060711876&ev=PageView&dl=https%3A%2F%2Fwww...0.0 ms16 B
/tr/?id=117970075559907&ev=PageView&dl=https%3A%2F%2Fwww....0.0 ms16 B
/tr/?id=687563759257831&ev=PageView&dl=https%3A%2F%2Fwww....0.0 ms16 B
/tr/?id=329309355875603&ev=PageView&dl=https%3A%2F%2Fwww....0.0 ms16 B
/tr/?id=3322336551373660&ev=PageView&dl=https%3A%2F%2Fwww...0.0 ms16 B
/tr/?id=965573722171828&ev=PageView&dl=https%3A%2F%2Fwww....0.0 ms16 B
/tr/?id=902260850395912&ev=PageView&dl=https%3A%2F%2Fwww....0.0 ms16 B

Consider setting font-display to swap or optional to ensure text is consistently visible. swap can be further optimized to mitigate layout shifts with font metric overrides.

Why this matters

Performance issues directly impact user engagement and conversion rates.

These insights are also available in the Chrome DevTools Performance Panel - record a trace to view more detailed information.

Time to Interactive is the amount of time it takes for the page to become fully interactive. Learn more about the Time to Interactive metric.

Why this matters

Performance issues directly impact user engagement and conversion rates.

TTI

Redirects introduce additional delays before the page can be loaded. Learn how to avoid page redirects.

Why this matters

Performance issues directly impact user engagement and conversion rates.

Estimated savings: 1.4 s
URLTime Spent
dal.ca/1.4 s
www.dal.ca/0.0 ms

The maximum potential First Input Delay that your users could experience is the duration of the longest task. Learn more about the Maximum Potential First Input Delay metric.

Why this matters

Performance issues directly impact user engagement and conversion rates.

Diagnostics

Reduce unused JavaScript and defer loading scripts until they are required to decrease bytes consumed by network activity. Learn how to reduce unused JavaScript.

Why this matters

Multi-megabyte JavaScript bundles delay every interactive feature on the page.

Learn more

This is the Lighthouse audit fired when too much JS is shipped relative to what executes. The fix isn't a config flag — it requires bundle analysis (webpack-bundle-analyzer, rollup-plugin-visualizer), splitting routes into chunks, lazy-loading off-screen components, and removing unused dependencies. Fundamentally different from minification: minifying reduces byte count, this reduces what's downloaded at all.

Source: Google web.dev / Lighthouse

Consider reducing the time spent parsing, compiling, and executing JS. You may find delivering smaller JS payloads helps with this. Learn how to reduce Javascript execution time.

Why this matters

Performance issues directly impact user engagement and conversion rates.

URLTotal CPU TimeScript EvaluationScript Parse
Unattributable1.2 s99 ms0.0 ms
/etc.clientlibs/dal-main/clientlibs/clientlib-site.lt_011...760 ms350 ms60 ms
www.googletagmanager.com/gtm.js?id=GTM-MKVXFCZH508 ms416 ms74 ms
www.dal.ca/490 ms7.2 ms1.5 ms
www.googletagmanager.com/gtag/js?id=G-03M7E9DG13&cx=c&gtm=4e64k0388 ms318 ms64 ms
www.googletagmanager.com/gtag/destination?id=AW-441325732&cx=c&gtm=4e64k0375 ms249 ms55 ms
scripts.clarity.ms/0.8.59-beta/clarity.js373 ms321 ms25 ms
www.googletagmanager.com/gtag/destination?id=AW-11009127209&cx=c&gtm=4e64k0368 ms290 ms73 ms
www.googletagmanager.com/gtag/destination?id=AW-826908640&cx=c&gtm=4e64k0361 ms284 ms73 ms
www.googletagmanager.com/gtag/js?id=G-10ZKDM5ZR2&cx=c&gtm=4e64k0345 ms279 ms63 ms
analytics.tiktok.com/i18n/pixel/static/main.MWE0ZWQ3ZWQwOQ.js317 ms245 ms68 ms
www.googletagmanager.com/gtag/destination?id=AW-10854878465&cx=c&gtm=4e64k0306 ms239 ms65 ms
www.googletagmanager.com/gtag/destination?id=AW-11440401892&cx=c&gtm=4e64k0301 ms245 ms54 ms
www.googletagmanager.com/gtag/destination?id=AW-17976873880&cx=c&gtm=4e64k0292 ms234 ms55 ms
www.googletagmanager.com/gtag/destination?id=AW-10884959375&cx=c&gtm=4e64k0291 ms234 ms54 ms
www.googletagmanager.com/gtag/destination?id=AW-16797833085&cx=c&gtm=4e64k0288 ms232 ms53 ms
www.googletagmanager.com/gtag/destination?id=AW-11007919099&cx=c&gtm=4e64k0270 ms215 ms52 ms
connect.facebook.net/en_US/fbevents.js186 ms134 ms50 ms
/signals/config/1165669311003126?v=2.9.303&r=stable&domai...177 ms148 ms27 ms
/signals/config/1322335958189833?v=2.9.303&r=stable&domai...132 ms117 ms12 ms
/signals/config/117970075559907?v=2.9.303&r=stable&domain...105 ms86 ms13 ms
/signals/config/965573722171828?v=2.9.303&r=stable&domain...97 ms80 ms12 ms
/signals/config/1136035060711876?v=2.9.303&r=stable&domai...95 ms73 ms17 ms
/signals/config/3322336551373660?v=2.9.303&r=stable&domai...91 ms72 ms13 ms
/signals/config/329309355875603?v=2.9.303&r=stable&domain...90 ms73 ms12 ms
/signals/config/687563759257831?v=2.9.303&r=stable&domain...87 ms70 ms12 ms
/signals/config/902260850395912?v=2.9.303&r=stable&domain...87 ms69 ms12 ms
www.googletagmanager.com/gtag/destination?id=AW-976202791&cx=c&gtm=4e64k084 ms29 ms55 ms
/signals/config/901595522693840?v=2.9.303&r=stable&domain...73 ms56 ms13 ms
snap.licdn.com/li.lms-analytics/insight.min.js72 ms60 ms7.8 ms
analytics.tiktok.com/i18n/pixel/static/identify_5cff1caf.js61 ms39 ms21 ms

Consider reducing the time spent parsing, compiling and executing JS. You may find delivering smaller JS payloads helps with this. Learn how to minimize main-thread work

Why this matters

Performance issues directly impact user engagement and conversion rates.

CategoryTime Spent
Script Evaluation5.8 s
Other1.3 s
Script Parsing & Compilation1.2 s
Style & Layout503 ms
Garbage Collection283 ms
Rendering87 ms
Parse HTML & CSS85 ms

Set an explicit width and height on image elements to reduce layout shifts and improve CLS. Learn how to set image dimensions

Why this matters

Performance issues directly impact user engagement and conversion rates.

URL
Dalhousie University Logo div.image > div#image-e80de876cf > a.cmp-image__link > img.cmp-image__image
/content/experience-fragments/www/global/homepage-header/...

More information about the performance of your application. These numbers don't directly affect the Performance score.

Layout shift culprits
Optimize DOM size
LCP breakdown
Modern HTTP
Optimize viewport for mobile
Minify CSS
Minify JavaScript
Reduce unused CSS
User Timing marks and measures 55 user timings
Avoid long main-thread tasks 20 long tasks found
Avoid non-composited animations 1 animated element found
Page didn't prevent back/forward cache restoration
Network Requests
Network Round Trip Times 220 ms
Server Backend Latencies 290 ms
Tasks
Diagnostics
Metrics
Screenshot Thumbnails
Final Screenshot
Script Treemap Data
Resources Summary
Initial server response time was short Root document took 0 ms
Avoid large layout shifts 2 layout shifts found
INP breakdown
94

Accessibility

These checks highlight opportunities to improve the accessibility of your web app. Automatic detection can only detect a subset of issues and does not guarantee the accessibility of your web app, so manual testing is also encouraged.

Navigation

Properly ordered headings that do not skip levels convey the semantic structure of the page, making it easier to navigate and understand when using assistive technologies. Learn more about heading order.

Why this matters

Performance issues directly impact user engagement and conversion rates.

Failing Elements
Learn more about studying at Dal div.aem-Grid > div.title > div#title-3fb6f8ecc9 > h3.cmp-title__text

These are opportunities to improve keyboard navigation in your application.

Best practices

Touch targets with sufficient size and spacing help users who may have difficulty targeting small controls to activate the targets. Learn more about touch targets.

Why this matters

Performance issues directly impact user engagement and conversion rates.

Failing Elements
Website feedback div.content-teaser > ul#list-81501c058a > li.cmp-list__item > a.cmp-list__item-link
Privacy Statement div.content-teaser > ul#list-81501c058a > li.cmp-list__item > a.cmp-list__item-link

These items highlight common accessibility best practices.

Interactive controls are keyboard focusable
Interactive elements indicate their purpose and state
The page has a logical tab order
Visual order on the page follows DOM order
User focus is not accidentally trapped in a region
The user's focus is directed to new content added to the page
HTML5 landmark elements are used to improve navigation
Offscreen content is hidden from assistive technology
Custom controls have associated labels
Custom controls have ARIA roles
`[aria-*]` attributes match their roles
`[aria-hidden="true"]` is not present on the document `<body>`
`[aria-*]` attributes have valid values
`[aria-*]` attributes are valid and not misspelled
Buttons have an accessible name
Image elements have `[alt]` attributes
`[user-scalable="no"]` is not used in the `<meta name="viewport">` element and the `[maximum-scale]` attribute is not less than 5.
ARIA attributes are used as specified for the element's role
`[aria-hidden="true"]` elements do not contain focusable descendents
Elements use only permitted ARIA attributes
Background and foreground colors have a sufficient contrast ratio
Document has a `<title>` element
`<html>` element has a `[lang]` attribute
`<html>` element has a valid value for its `[lang]` attribute
Links are distinguishable without relying on color.
Links have a discernible name
Lists contain only `<li>` elements and script supporting elements (`<script>` and `<template>`).
List items (`<li>`) are contained within `<ul>`, `<ol>` or `<menu>` parent elements
Skip links are focusable.
Document has a main landmark.
`[accesskey]` values are unique
`button`, `link`, and `menuitem` elements have accessible names
Deprecated ARIA roles were not used
Elements with `role="dialog"` or `role="alertdialog"` have accessible names.
ARIA input fields have accessible names
ARIA `meter` elements have accessible names
ARIA `progressbar` elements have accessible names
`[role]`s have all required `[aria-*]` attributes
Elements with an ARIA `[role]` that require children to contain a specific `[role]` have all required children.
`[role]`s are contained by their required parent element
`[role]` values are valid
Elements with the `role=text` attribute do not have focusable descendents.
ARIA toggle fields have accessible names
ARIA `tooltip` elements have accessible names
ARIA `treeitem` elements have accessible names
The page contains a heading, skip link, or landmark region
`<dl>`'s contain only properly-ordered `<dt>` and `<dd>` groups, `<script>`, `<template>` or `<div>` elements.
Definition list items are wrapped in `<dl>` elements
ARIA IDs are unique
No form fields have multiple labels
`<frame>` or `<iframe>` elements have a title
`<html>` element has an `[xml:lang]` attribute with the same base language as the `[lang]` attribute.
Input buttons have discernible text.
`<input type="image">` elements have `[alt]` text
Form elements have associated labels
The document does not use `<meta http-equiv="refresh">`
`<object>` elements have alternate text
Select elements have associated label elements.
No element has a `[tabindex]` value greater than 0
Cells in a `<table>` element that use the `[headers]` attribute refer to table cells within the same table.
`<th>` elements and elements with `[role="columnheader"/"rowheader"]` have data cells they describe.
`[lang]` attributes have a valid value
`<video>` elements contain a `<track>` element with `[kind="captions"]`
Tables have different content in the summary attribute and `<caption>`.
All heading elements contain content.
Uses ARIA roles only on compatible elements
Image elements do not have `[alt]` attributes that are redundant text.
Identical links have the same purpose.
Elements with visible text labels have matching accessible names.
Tables use `<caption>` instead of cells with the `[colspan]` attribute to indicate a caption.
`<td>` elements in a large `<table>` have one or more table headers.
77

Best Practices

General

Deprecated APIs will eventually be removed from the browser. Learn more about deprecated APIs.

Why this matters

Performance issues directly impact user engagement and conversion rates.

Deprecation / WarningSource
AttributionReporting

Errors logged to the console indicate unresolved problems. They can come from network request failures and other browser concerns. Learn more about this errors in console diagnostic audit

Why this matters

Performance issues directly impact user engagement and conversion rates.

SourceDescription
Failed to load resource: the server responded with a status of 404 ()
Uses HTTPS
Avoids third-party cookies
Allows users to paste into input fields
Avoids requesting the geolocation permission on page load
Avoids requesting the notification permission on page load
Displays images with correct aspect ratio
Serves images with appropriate resolution
Page has the HTML doctype
Properly defines charset
No issues in the `Issues` panel in Chrome Devtools
Ensure CSP is effective against XSS attacks
Use a strong HSTS policy
Ensure proper origin isolation with COOP
Mitigate DOM-based XSS with Trusted Types
Detected JavaScript libraries
Page has valid source maps
Redirects HTTP traffic to HTTPS
Mitigate clickjacking with XFO or CSP
100

SEO

These checks ensure that your page is following basic search engine optimization advice. There are many additional factors Lighthouse does not score here that may affect your search ranking, including performance on Core Web Vitals. Learn more about Google Search Essentials.

Structured data is valid
Page isn’t blocked from indexing
Document has a `<title>` element
Document has a meta description
Page has successful HTTP status code
Links have descriptive text
Links are crawlable
robots.txt is valid
Image elements have `[alt]` attributes
Document has a valid `hreflang`
Document has a valid `rel=canonical`

Lighthouse Scores

Industry-standard audits powered by Google Lighthouse. — Desktop

62
Performance Overall performance score (0–100) based on Core Web Vitals and other metrics. 90+ is good.
95
Accessibility Measures how accessible the page is for users with disabilities. Checks color contrast, ARIA labels, and semantic HTML.
77
Best Practices Checks for modern web development best practices including HTTPS, no console errors, and secure JavaScript.
100
SEO Measures basic SEO optimizations: meta tags, crawlability, link text, and mobile friendliness.

Core Web Vitals

Key metrics that affect user experience. — Desktop

First Contentful Paint First Contentful Paint — how long until the browser renders the first piece of content. Under 1.8s is good.

1.58 s

Largest Contentful Paint Largest Contentful Paint — how long until the largest visible element loads. Under 2.5s is good.

2.56 s

Total Blocking Time Total Blocking Time — total time the main thread was blocked, preventing user input. Under 200ms is good.

371 ms

Cumulative Layout Shift Cumulative Layout Shift — measures visual stability. How much the page layout shifts during loading. Under 0.1 is good.

0.003

Speed Index Speed Index — how quickly content is visually displayed during load. Under 3.4s is good.

1.86 s

Time to Interactive Time to Interactive — how long until the page is fully interactive and responds to user input. Under 3.8s is good.

7.70 s

Detailed Report

Audit breakdown by category with detailed findings.

62

Performance

Insights

Remove large, duplicate JavaScript modules from bundles to reduce unnecessary bytes consumed by network activity.

Why this matters

Performance issues directly impact user engagement and conversion rates.

Polyfills and transforms enable older browsers to use new JavaScript features. However, many aren't necessary for modern browsers. Consider modifying your JavaScript build process to not transpile Baseline features, unless you know you must support older browsers. Learn why most sites can deploy ES6+ code without transpiling

Why this matters

Shipping ES5 transpiled code to modern browsers wastes bytes — every user with an evergreen browser pays for compatibility you don't need.

Learn more

Most users today run browsers that natively support ES6+, async/await, optional chaining, and the rest of modern JavaScript. Transpiling to ES5 'just in case' adds 20-40% to your bundle for no benefit. Configure your build to target a modern browserslist, or ship a differential bundle pair (modern + legacy) with the module/nomodule pattern.

Source: Google web.dev / Lighthouse

3rd party code can significantly impact load performance. Reduce and defer loading of 3rd party code to prioritize your page's content.

Why this matters

Performance issues directly impact user engagement and conversion rates.

Your first network request is the most important. Reduce its latency by avoiding redirects, ensuring a fast server response, and enabling text compression.

Why this matters

Performance issues directly impact user engagement and conversion rates.

Consider setting font-display to swap or optional to ensure text is consistently visible. swap can be further optimized to mitigate layout shifts with font metric overrides.

Why this matters

Performance issues directly impact user engagement and conversion rates.

A forced reflow occurs when JavaScript queries geometric properties (such as offsetWidth) after styles have been invalidated by a change to the DOM state. This can result in poor performance. Learn more about forced reflows and possible mitigations.

Why this matters

Performance issues directly impact user engagement and conversion rates.

headings: [map[key:source label:Top function call valueType:source-location] map[granularity:1 key:reflowTime label:Total reflow time valueType:ms]]
items: [map[reflowTime:51.425 source:map[column:428950 line:2 type:source-location url:https://www.dal.ca/etc.clientlibs/dal-main/clientlibs/clientlib-site.lt_011ee1c126a6c1fd9fcd645daa97f89a.min.js urlProvider:network]]]
headings: [map[key:source label:Source valueType:source-location] map[granularity:1 key:reflowTime label:Total reflow time valueType:ms]]
items: [map[reflowTime:0.65 source:map[column:49477 line:1 type:source-location url:https://www.dal.ca/etc.clientlibs/dal-main/clientlibs/clientlib-site.lt_011ee1c126a6c1fd9fcd645daa97f89a.min.js urlProvider:network]] map[reflowTime:32.63 source:map[column:50173 line:1 type:source-location url:https://www.dal.ca/etc.clientlibs/dal-main/clientlibs/clientlib-site.lt_011ee1c126a6c1fd9fcd645daa97f89a.min.js urlProvider:network]] map[reflowTime:0.375 source:map[column:50231 line:1 type:source-location url:https://www.dal.ca/etc.clientlibs/dal-main/clientlibs/clientlib-site.lt_011ee1c126a6c1fd9fcd645daa97f89a.min.js urlProvider:network]] map[reflowTime:0.283 source:map[column:50295 line:1 type:source-location url:https://www.dal.ca/etc.clientlibs/dal-main/clientlibs/clientlib-site.lt_011ee1c126a6c1fd9fcd645daa97f89a.min.js urlProvider:network]] map[reflowTime:0.891 source:map[column:49455 line:1 type:source-location url:https://www.dal.ca/etc.clientlibs/dal-main/clientlibs/clientlib-site.lt_011ee1c126a6c1fd9fcd645daa97f89a.min.js urlProvider:network]] map[reflowTime:40.366 source:map[column:429908 line:1 type:source-location url:https://www.dal.ca/etc.clientlibs/dal-main/clientlibs/clientlib-site.lt_011ee1c126a6c1fd9fcd645daa97f89a.min.js urlProvider:network]] map[reflowTime:51.425 source:map[column:429029 line:1 type:source-location url:https://www.dal.ca/etc.clientlibs/dal-main/clientlibs/clientlib-site.lt_011ee1c126a6c1fd9fcd645daa97f89a.min.js urlProvider:network]] map[reflowTime:15.757 source:map[column:420345 line:1 type:source-location url:https://www.dal.ca/etc.clientlibs/dal-main/clientlibs/clientlib-site.lt_011ee1c126a6c1fd9fcd645daa97f89a.min.js urlProvider:network]]]

Reducing the download time of images can improve the perceived load time of the page and LCP. Learn more about optimizing image size

Why this matters

Performance issues directly impact user engagement and conversion rates.

URLResource SizeEst Savings
two researchers examining plants div#teaser-82d97423f4 > div.cmp-teaser__image > div#teaser-82d97423f4-image > img.cmp-image__image
/_jcr_content/root/maincontent/main/container_433277233/t...345.6 KiB290.6 KiB
Dalhousie Studley Campus div.image > div#image-0c99fff8f5 > a.cmp-image__link > img.cmp-image__image
/_jcr_content/root/maincontent/main/container_433277233_/...311.1 KiB252.8 KiB
Dal Students on campus div#teaser-a0c49d2871 > div.cmp-teaser__image > div#teaser-a0c49d2871-image > img.cmp-image__image
/_jcr_content/root/maincontent/main/container_433277233/t...269.9 KiB214.9 KiB
a crowd listening to a speaker at Dal Engagement Day 2025 a.cmp-teaser__link > div.cmp-teaser__image > div#teaser-61d67f8e51-image > img.cmp-image__image
/_jcr_content/root/maincontent/main/container_541149697_/...229.0 KiB210.0 KiB
A person in scuba gear underwater. a.cmp-teaser__link > div.cmp-teaser__image > div#teaser-947481e57e-image > img.cmp-image__image
/_jcr_content/root/maincontent/main/container_541149697_/...227.1 KiB208.1 KiB
Three students sit on an orange sofa working on laptops. Behind them, windows o… div#hero-7fe1e4dd23 > div.cmp-teaser__image > div#hero-7fe1e4dd23-image > img.cmp-image__image
/_jcr_content/root/maincontent/main/hero_816095912_copy.c...162.6 KiB97.5 KiB
Eight students are dancing on stage in costumes showcasing fashion from 1897. a.cmp-teaser__link > div.cmp-teaser__image > div#teaser-93729a85da-image > img.cmp-image__image
/_jcr_content/root/maincontent/main/container/container_c...78.5 KiB69.3 KiB
a.cmp-teaser__link > div.cmp-teaser__image > div#teaser-34a5cc8aea-image > img.cmp-image__image a.cmp-teaser__link > div.cmp-teaser__image > div#teaser-34a5cc8aea-image > img.cmp-image__image
/_jcr_content/root/maincontent/main/container/container_c...59.6 KiB50.4 KiB
Posed shots of four recipients. a.cmp-teaser__link > div.cmp-teaser__image > div#teaser-6bfd9a2d46-image > img.cmp-image__image
/_jcr_content/root/maincontent/main/container/container_c...72.5 KiB39.5 KiB
A headshot of Dr. Blaine Fiss in a blue lab jacket. a.cmp-teaser__link > div.cmp-teaser__image > div#teaser-36c78f9730-image > img.cmp-image__image
/_jcr_content/root/maincontent/main/container/container_c...43.4 KiB34.2 KiB
Overhead shot of a brightly coloured street mural. a.cmp-teaser__link > div.cmp-teaser__image > div#teaser-a6088fefd3-image > img.cmp-image__image
/_jcr_content/root/maincontent/main/container_541149697_/...51.2 KiB32.2 KiB
Melina Collins is standing with her hand on her hip, wearing a button up cardig… a.cmp-teaser__link > div.cmp-teaser__image > div#teaser-941db846be-image > img.cmp-image__image
/_jcr_content/root/maincontent/main/container/container_c...26.6 KiB19.2 KiB

Optimize LCP by making the LCP image discoverable from the HTML immediately, and avoiding lazy-loading

Why this matters

Performance issues directly impact user engagement and conversion rates.

lhId: page-5-IMG
nodeLabel: Three students sit on an orange sofa working on laptops. Behind them, windows o…
path: 1,HTML,1,BODY,2,DIV,2,DIV,0,DIV,0,DIV,2,MAIN,0,DIV,0,DIV,0,DIV,1,DIV,0,DIV,0,IMG
selector: div#hero-7fe1e4dd23 > div.cmp-teaser__image > div#hero-7fe1e4dd23-image > img.cmp-image__image
snippet: <img src="https://www.dal.ca/_jcr_content/root/maincontent/main/hero_816095912_copy.…" srcset="https://www.dal.ca/_jcr_content/root/maincontent/main/hero_816095912_copy.…" class="cmp-image__image" itemprop="contentUrl" width="6240" height="4160" alt="Three students sit on an orange sofa working on laptops. Behind them, wind…">

Avoid chaining critical requests by reducing the length of chains, reducing the download size of resources, or deferring the download of unnecessary resources to improve page load.

Why this matters

Performance issues directly impact user engagement and conversion rates.

description: [preconnect](https://developer.chrome.com/docs/lighthouse/performance/uses-rel-preconnect/) hints help the browser establish a connection earlier in the page load, saving time when the first request for that origin is made. The following are the origins that the page preconnected to.
title: Preconnected origins
description: Add [preconnect](https://developer.chrome.com/docs/lighthouse/performance/uses-rel-preconnect/) hints to your most important origins, but try to use no more than 4.
title: Preconnect candidates
value: No additional origins are good candidates for preconnecting

Requests are blocking the page's initial render, which may delay LCP. Deferring or inlining can move these network requests out of the critical path.

Why this matters

Performance issues directly impact user engagement and conversion rates.

A long cache lifetime can speed up repeat visits to your page. Learn more about caching.

Why this matters

Performance issues directly impact user engagement and conversion rates.

RequestCache TTLTransfer Size
connect.facebook.net/en_US/fbevents.js1200.0 s96.6 KiB
/signals/config/1165669311003126?v=2.9.303&r=stable&domai...1200.0 s44.9 KiB
/signals/config/117970075559907?v=2.9.303&r=stable&domain...1200.0 s18.4 KiB
/signals/config/329309355875603?v=2.9.303&r=stable&domain...1200.0 s16.4 KiB
/signals/config/965573722171828?v=2.9.303&r=stable&domain...1200.0 s16.4 KiB
/signals/config/1322335958189833?v=2.9.303&r=stable&domai...1200.0 s16.4 KiB
/signals/config/902260850395912?v=2.9.303&r=stable&domain...1200.0 s16.3 KiB
/signals/config/3322336551373660?v=2.9.303&r=stable&domai...1200.0 s16.3 KiB
/signals/config/687563759257831?v=2.9.303&r=stable&domain...1200.0 s16.3 KiB
/signals/config/1136035060711876?v=2.9.303&r=stable&domai...1200.0 s16.3 KiB
/signals/config/901595522693840?v=2.9.303&r=stable&domain...1200.0 s16.3 KiB
scripts.clarity.ms/0.8.59-beta/clarity.js86400.0 s26.2 KiB
snap.licdn.com/li.lms-analytics/insight.min.js86400.0 s18.7 KiB
/collect?v=2&fmt=js&pid=4295716&time=1776889130556&li_ads...0.0 ms450 B
/tr/?id=1165669311003126&ev=PageView&dl=https%3A%2F%2Fwww...0.0 ms18 B
/tr/?id=1322335958189833&ev=PageView&dl=https%3A%2F%2Fwww...0.0 ms16 B
/tr/?id=1136035060711876&ev=PageView&dl=https%3A%2F%2Fwww...0.0 ms16 B
/tr/?id=117970075559907&ev=PageView&dl=https%3A%2F%2Fwww....0.0 ms16 B
/tr/?id=687563759257831&ev=PageView&dl=https%3A%2F%2Fwww....0.0 ms16 B
/tr/?id=329309355875603&ev=PageView&dl=https%3A%2F%2Fwww....0.0 ms16 B
/tr/?id=3322336551373660&ev=PageView&dl=https%3A%2F%2Fwww...0.0 ms16 B
/tr/?id=965573722171828&ev=PageView&dl=https%3A%2F%2Fwww....0.0 ms16 B
/tr/?id=902260850395912&ev=PageView&dl=https%3A%2F%2Fwww....0.0 ms16 B
/tr/?id=901595522693840&ev=PageView&dl=https%3A%2F%2Fwww....0.0 ms16 B

These insights are also available in the Chrome DevTools Performance Panel - record a trace to view more detailed information.

Redirects introduce additional delays before the page can be loaded. Learn how to avoid page redirects.

Why this matters

Performance issues directly impact user engagement and conversion rates.

Estimated savings: 862 ms
URLTime Spent
dal.ca/862 ms
www.dal.ca/0.0 ms

Time to Interactive is the amount of time it takes for the page to become fully interactive. Learn more about the Time to Interactive metric.

Why this matters

Performance issues directly impact user engagement and conversion rates.

TTI

Diagnostics

Reduce unused JavaScript and defer loading scripts until they are required to decrease bytes consumed by network activity. Learn how to reduce unused JavaScript.

Why this matters

Multi-megabyte JavaScript bundles delay every interactive feature on the page.

Learn more

This is the Lighthouse audit fired when too much JS is shipped relative to what executes. The fix isn't a config flag — it requires bundle analysis (webpack-bundle-analyzer, rollup-plugin-visualizer), splitting routes into chunks, lazy-loading off-screen components, and removing unused dependencies. Fundamentally different from minification: minifying reduces byte count, this reduces what's downloaded at all.

Source: Google web.dev / Lighthouse

Consider reducing the time spent parsing, compiling, and executing JS. You may find delivering smaller JS payloads helps with this. Learn how to reduce Javascript execution time.

Why this matters

Performance issues directly impact user engagement and conversion rates.

Consider reducing the time spent parsing, compiling and executing JS. You may find delivering smaller JS payloads helps with this. Learn how to minimize main-thread work

Why this matters

Performance issues directly impact user engagement and conversion rates.

CategoryTime Spent
Script Evaluation1.5 s
Other317 ms
Script Parsing & Compilation312 ms
Style & Layout267 ms
Garbage Collection49 ms
Rendering32 ms
Parse HTML & CSS18 ms

Reduce unused rules from stylesheets and defer CSS not used for above-the-fold content to decrease bytes consumed by network activity. Learn how to reduce unused CSS.

Why this matters

Performance issues directly impact user engagement and conversion rates.

Estimated savings: 0.0 ms 17.9 KiB
URLTransfer SizeEst Savings
/etc.clientlibs/dal-main/clientlibs/clientlib-site.lt_257...22.4 KiB17.9 KiB

Set an explicit width and height on image elements to reduce layout shifts and improve CLS. Learn how to set image dimensions

Why this matters

Performance issues directly impact user engagement and conversion rates.

URL
Dalhousie University Logo div.image > div#image-e80de876cf > a.cmp-image__link > img.cmp-image__image
/content/experience-fragments/www/global/homepage-header/...

More information about the performance of your application. These numbers don't directly affect the Performance score.

Max Potential First Input Delay 100 ms
Layout shift culprits
Optimize DOM size
LCP breakdown
Modern HTTP
Optimize viewport for mobile
Minify CSS
Minify JavaScript
User Timing marks and measures 55 user timings
Avoid long main-thread tasks 18 long tasks found
Avoid non-composited animations 1 animated element found
Page didn't prevent back/forward cache restoration
Network Requests
Network Round Trip Times 220 ms
Server Backend Latencies 300 ms
Tasks
Diagnostics
Metrics
Screenshot Thumbnails
Final Screenshot
Script Treemap Data
Resources Summary
Initial server response time was short Root document took 0 ms
Avoid large layout shifts 2 layout shifts found
INP breakdown
95

Accessibility

These checks highlight opportunities to improve the accessibility of your web app. Automatic detection can only detect a subset of issues and does not guarantee the accessibility of your web app, so manual testing is also encouraged.

Navigation

Properly ordered headings that do not skip levels convey the semantic structure of the page, making it easier to navigate and understand when using assistive technologies. Learn more about heading order.

Why this matters

Performance issues directly impact user engagement and conversion rates.

Failing Elements
Learn more about studying at Dal div.aem-Grid > div.title > div#title-3fb6f8ecc9 > h3.cmp-title__text

These are opportunities to improve keyboard navigation in your application.

Best practices

Touch targets with sufficient size and spacing help users who may have difficulty targeting small controls to activate the targets. Learn more about touch targets.

Why this matters

Performance issues directly impact user engagement and conversion rates.

Failing Elements
Upcoming events div.content-teaser > ul#list-02298e4b29 > li.cmp-list__item > a.cmp-list__item-link
Community Hub div.content-teaser > ul#list-02298e4b29 > li.cmp-list__item > a.cmp-list__item-link

These items highlight common accessibility best practices.

Interactive controls are keyboard focusable
Interactive elements indicate their purpose and state
The page has a logical tab order
Visual order on the page follows DOM order
User focus is not accidentally trapped in a region
The user's focus is directed to new content added to the page
HTML5 landmark elements are used to improve navigation
Offscreen content is hidden from assistive technology
Custom controls have associated labels
Custom controls have ARIA roles
`[aria-*]` attributes match their roles
`[aria-hidden="true"]` is not present on the document `<body>`
`[role]`s have all required `[aria-*]` attributes
`[role]` values are valid
`[aria-*]` attributes have valid values
`[aria-*]` attributes are valid and not misspelled
Buttons have an accessible name
Image elements have `[alt]` attributes
`[user-scalable="no"]` is not used in the `<meta name="viewport">` element and the `[maximum-scale]` attribute is not less than 5.
ARIA attributes are used as specified for the element's role
`[aria-hidden="true"]` elements do not contain focusable descendents
Elements use only permitted ARIA attributes
Background and foreground colors have a sufficient contrast ratio
Document has a `<title>` element
`<html>` element has a `[lang]` attribute
`<html>` element has a valid value for its `[lang]` attribute
Links are distinguishable without relying on color.
Links have a discernible name
Lists contain only `<li>` elements and script supporting elements (`<script>` and `<template>`).
List items (`<li>`) are contained within `<ul>`, `<ol>` or `<menu>` parent elements
Skip links are focusable.
Document has a main landmark.
Deprecated ARIA roles were not used
Identical links have the same purpose.
`[accesskey]` values are unique
`button`, `link`, and `menuitem` elements have accessible names
Elements with `role="dialog"` or `role="alertdialog"` have accessible names.
ARIA input fields have accessible names
ARIA `meter` elements have accessible names
ARIA `progressbar` elements have accessible names
Elements with an ARIA `[role]` that require children to contain a specific `[role]` have all required children.
`[role]`s are contained by their required parent element
Elements with the `role=text` attribute do not have focusable descendents.
ARIA toggle fields have accessible names
ARIA `tooltip` elements have accessible names
ARIA `treeitem` elements have accessible names
The page contains a heading, skip link, or landmark region
`<dl>`'s contain only properly-ordered `<dt>` and `<dd>` groups, `<script>`, `<template>` or `<div>` elements.
Definition list items are wrapped in `<dl>` elements
ARIA IDs are unique
No form fields have multiple labels
`<frame>` or `<iframe>` elements have a title
`<html>` element has an `[xml:lang]` attribute with the same base language as the `[lang]` attribute.
Input buttons have discernible text.
`<input type="image">` elements have `[alt]` text
Form elements have associated labels
The document does not use `<meta http-equiv="refresh">`
`<object>` elements have alternate text
Select elements have associated label elements.
No element has a `[tabindex]` value greater than 0
Cells in a `<table>` element that use the `[headers]` attribute refer to table cells within the same table.
`<th>` elements and elements with `[role="columnheader"/"rowheader"]` have data cells they describe.
`[lang]` attributes have a valid value
`<video>` elements contain a `<track>` element with `[kind="captions"]`
Tables have different content in the summary attribute and `<caption>`.
All heading elements contain content.
Uses ARIA roles only on compatible elements
Image elements do not have `[alt]` attributes that are redundant text.
Elements with visible text labels have matching accessible names.
Tables use `<caption>` instead of cells with the `[colspan]` attribute to indicate a caption.
`<td>` elements in a large `<table>` have one or more table headers.
77

Best Practices

General

Deprecated APIs will eventually be removed from the browser. Learn more about deprecated APIs.

Why this matters

Performance issues directly impact user engagement and conversion rates.

Deprecation / WarningSource
AttributionReporting

Errors logged to the console indicate unresolved problems. They can come from network request failures and other browser concerns. Learn more about this errors in console diagnostic audit

Why this matters

Performance issues directly impact user engagement and conversion rates.

SourceDescription
Failed to load resource: the server responded with a status of 404 ()
Uses HTTPS
Avoids third-party cookies
Allows users to paste into input fields
Avoids requesting the geolocation permission on page load
Avoids requesting the notification permission on page load
Displays images with correct aspect ratio
Serves images with appropriate resolution
Page has the HTML doctype
Properly defines charset
No issues in the `Issues` panel in Chrome Devtools
Ensure CSP is effective against XSS attacks
Use a strong HSTS policy
Ensure proper origin isolation with COOP
Mitigate DOM-based XSS with Trusted Types
Detected JavaScript libraries
Page has valid source maps
Redirects HTTP traffic to HTTPS
Mitigate clickjacking with XFO or CSP
100

SEO

These checks ensure that your page is following basic search engine optimization advice. There are many additional factors Lighthouse does not score here that may affect your search ranking, including performance on Core Web Vitals. Learn more about Google Search Essentials.

Structured data is valid
Page isn’t blocked from indexing
Document has a `<title>` element
Document has a meta description
Page has successful HTTP status code
Links have descriptive text
Links are crawlable
robots.txt is valid
Image elements have `[alt]` attributes
Document has a valid `hreflang`
Document has a valid `rel=canonical`

Send Feedback