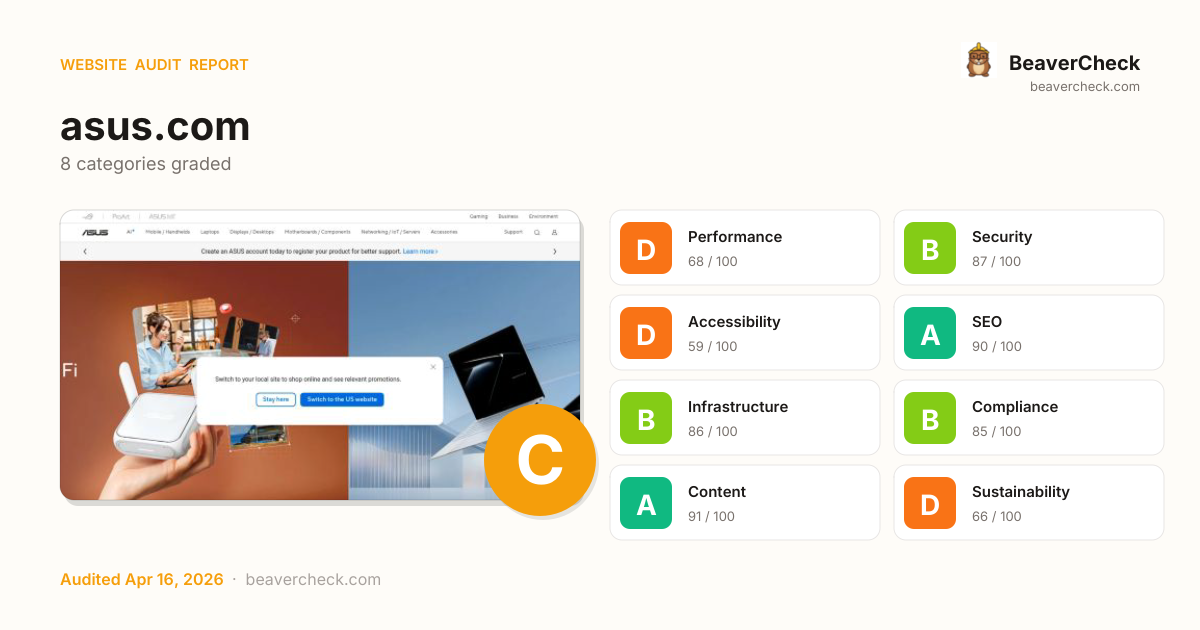
Audit overview
3 categories need attention: Performance, and 2 others.
Fix Priority Matrix
5 findingsQuick Wins
2High impact, low effort — start here.
Strategic
3High impact, requires investment.
Easy Improvements
0Small gains, minimal effort.
Nothing in this quadrant — good news.
Deprioritize
0Low impact, high effort — do last.
Nothing in this quadrant — good news.
Screenshots

Top Priorities (5)
No H1 heading found
No H1 means screen-reader users can't identify the page's primary topic, and Google's content-extraction degrades.
is missing width/height — may cause layout shift
Performance issues directly impact user engagement and conversion rates.
153 third-party resources (100% of weight)
Informational: third-party resource count and their share of page weight. High share caps perf gains from frontend optimization.
154 HTTP requests — consider bundling or reducing
High HTTP request count — bundling, sprite-ing, and HTTP/2 server push can reduce per-request overhead.
Cross-Origin-Embedder-Policy header is missing
COEP enforces that all embedded resources opt-in to cross-origin embedding — required for cross-origin isolation features.
Business case
What fixing the audit's findings is worth -- and what ignoring them keeps costing.
Return on investment
TWD 11,467 investment → TWD 149,471/month returns
Figures combine localized regulatory fine ceilings, search/conversion value priced against local CPC, and bandwidth waste estimates. Results depend on implementation quality and audience composition. Not legal or financial advice.
Conversion barriers
6 barrier(s) likely increasing bounce by ~26%.
- Page takes 11.3s to loadUsers abandon at ~3s — you're 8.8s over the 2.5s threshold→ Optimize render-blocking resources, preload the hero image, and compress images
- Page feels frozen for 1.3sClicks on the primary CTA are ignored while JavaScript runs→ Break up long tasks; defer non-critical JavaScript to post-hydration
- No Content-Security-Policy headerHigher XSS blast radius — one compromised script can exfiltrate the checkout form→ Ship a reporting-only CSP first, then enforce once violations are clean
- 10 link(s) with generic text ("click here", "read more")Screen-reader users navigating by link list see no context — and search engines can't infer relevance→ Rewrite with descriptive phrases that identify the destination
- No skip-to-content linkKeyboard and screen-reader users must tab through the entire header on every page→ Add a visible-on-focus <a href="#main">Skip to content</a> as the first focusable element
Preliminary CRO audit — each barrier links to the tab with detailed analysis.
Remediation cost
Start here for the best return on investment
Cost by category
Cost by effort level
Adjust assumptions
Team composition
Multiplier applied to dev hours to reflect QA, design, and PM overhead. Use Dev only for solo work; Full team for projects with formal review processes.
Rates reflect fully-loaded developer cost including overhead
Warning:Cost of inaction
Bounce-Rate Cost
TWD 128,582 /mo
+25.7pp bounce · ~2,572 lost visitors/mo
CPC: TWD 50.00
Bandwidth Waste
TWD 30 /mo
11756.9 MB/mo × 2.581 TWD/GB
- Optimize transfer: save ~1.2 MB per page loadSaves TWD 30/mo
Compliance figures represent the statutory maximum fine for the most severe triggered category, capped per regulation — not the sum of per-finding penalties. Based on published regulatory fine ranges. This is not legal advice.
Unique monthly visitors from your analytics
Purchases, signups, or key actions
Optional — for revenue estimation
more engaged visitors from reduced bounce
Fix 1 critical issues to capture this value
How this is calculated
Based on Google/Deloitte research ("Milliseconds Make Millions") showing a ~7% bounce rate increase per additional second of LCP above the 2.5s "Good" threshold.
Your site's LCP: → estimated after fixes.
These are estimates based on industry research — actual results vary
Your data stays in your browser — nothing is sent to our servers
Lighthouse
Mobile
First Contentful Paint First Contentful Paint — how long until the browser renders the first piece of content. Under 1.8s is good.
4.73 s
Largest Contentful Paint Largest Contentful Paint — how long until the largest visible element loads. Under 2.5s is good.
11.26 s
Total Blocking Time Total Blocking Time — total time the main thread was blocked, preventing user input. Under 200ms is good.
1.28 s
Cumulative Layout Shift Cumulative Layout Shift — measures visual stability. How much the page layout shifts during loading. Under 0.1 is good.
0.049
Speed Index Speed Index — how quickly content is visually displayed during load. Under 3.4s is good.
8.46 s
Time to Interactive Time to Interactive — how long until the page is fully interactive and responds to user input. Under 3.8s is good.
23.55 s
Desktop
First Contentful Paint First Contentful Paint — how long until the browser renders the first piece of content. Under 1.8s is good.
1.43 s
Largest Contentful Paint Largest Contentful Paint — how long until the largest visible element loads. Under 2.5s is good.
1.86 s
Total Blocking Time Total Blocking Time — total time the main thread was blocked, preventing user input. Under 200ms is good.
161 ms
Cumulative Layout Shift Cumulative Layout Shift — measures visual stability. How much the page layout shifts during loading. Under 0.1 is good.
0.078
Speed Index Speed Index — how quickly content is visually displayed during load. Under 3.4s is good.
2.93 s
Time to Interactive Time to Interactive — how long until the page is fully interactive and responds to user input. Under 3.8s is good.
3.60 s
Categories
8Performance
is missing width/height — may cause layout shift
Security
Cross-Origin-Embedder-Policy header is missing
Accessibility
No H1 heading found
SEO
All checks pass
Infrastructure
All checks pass
Compliance
All checks pass
Content
All checks pass
Sustainability
All checks pass
How you compare
Where this site stands against peers running the same stack.
Top 10% of Amazon Route 53 sites score 85+ on Performance; you're at 68 — closing this gap is the highest-leverage improvement.
Top 10% of Apple sites score 84+ on Performance; you're at 68 — closing this gap is the highest-leverage improvement.
Technology stack
Amazon Route 53
Stack Architecture
 Akamai mPulse
  Google Tag Manager
  Bazaarvoice Reviews
  Boomerang Facebook Google Search Console HSTS
  Hammer.js 2.0.7Microsoft Microsoft 365
  Nuxt.js
  Open Graph
  Swiper
  Vue.js
  core-js 3.6.5
 jQuery 3.6.0
All Detected Technologies (18)
Bazaarvoice is a provider of user-generated content solutions like ratings and reviews and Q&A.
boomerang is a JavaScript library that measures the page load time experienced by real users, commonly called RUM (Real User Measurement).
HTTP Strict Transport Security (HSTS) informs browsers that the site should only be accessed using HTTPS.
Hammer.js is a JavaScript library for adding touch gestures like swipe, pinch, and rotate to web applications.
Nuxt is a Vue framework for developing modern web applications.
Open Graph is a protocol that is used to integrate any web page into the social graph.
Swiper is a JavaScript library that creates modern touch sliders with hardware-accelerated transitions.
Vue.js is an open-source model–view–viewmodel JavaScript framework for building user interfaces and single-page applications.
core-js is a modular standard library for JavaScript, with polyfills for cutting-edge ECMAScript features.
jQuery is a JavaScript library which is a free, open-source software designed to simplify HTML DOM tree traversal and manipulation, as well as event handling, CSS animation, and Ajax.
Akamai mPulse is a real user monitoring (RUM) solution that enables companies to monitor, find, and fix website and application performance issues.
Google Tag Manager is a tag management system (TMS) that allows you to quickly and easily update measurement codes and related code fragments collectively known as tags on your website or mobile app.
Observations (3)
jQuery loaded alongside a modern framework
Both jQuery and Vue.js are loaded. Modern frameworks handle DOM manipulation natively. jQuery may be unnecessary and adds ~30KB to the page weight. Check the Performance tab for bundle analysis.
No build tool detected
A framework (Amazon Route 53) was detected but no bundler was identified. The build tool may not be detectable from output patterns, or the site may use the framework's built-in bundler.
Complex technology stack detected
18 technologies identified. A complex stack increases maintenance burden and attack surface. Consider whether all components are actively needed.
Show your score
Drop this badge on your README, marketing site, or status page. It auto-updates every time the audit re-runs and links back to this report.
This badge auto-updates with your latest scan result.
[](https://beavercheck.com/results/597e2823-933e-4ab4-89e8-319fa2a8f56e)<a href="https://beavercheck.com/results/597e2823-933e-4ab4-89e8-319fa2a8f56e"><img src="https://beavercheck.com/badge?url=https%3A%2F%2Fasus.com" alt="BeaverCheck Score"></a>https://beavercheck.com/badge?url=https%3A%2F%2Fasus.comExport & share
Download the audit, share with your team, or grab a fix plan ready to copy into your tracker.
Copies markdown to clipboard
Fix Plan
Three-week roadmap to ship the audit's findings, with one-click copy targets for your tracker.
Three-week fix plan
2 sprints · 7h total → projected B (83)
Sprint 1: Quick Wins
+2Highest ROI — low effort, high impact
- · No H1 heading found
- · 153 third-party resources (100% of weight)
Sprint 2: Core Fixes
+3Medium effort, high structural impact
- · Cross-Origin-Embedder-Policy header is missing
- · is missing width/height — may cause layout shift
- · 154 HTTP requests — consider bundling or reducing