Netherlands · Amsterdam Completed: Apr 22, 2026 21:15 UTC
Mobile 375 × 812

Desktop 1440 × 900
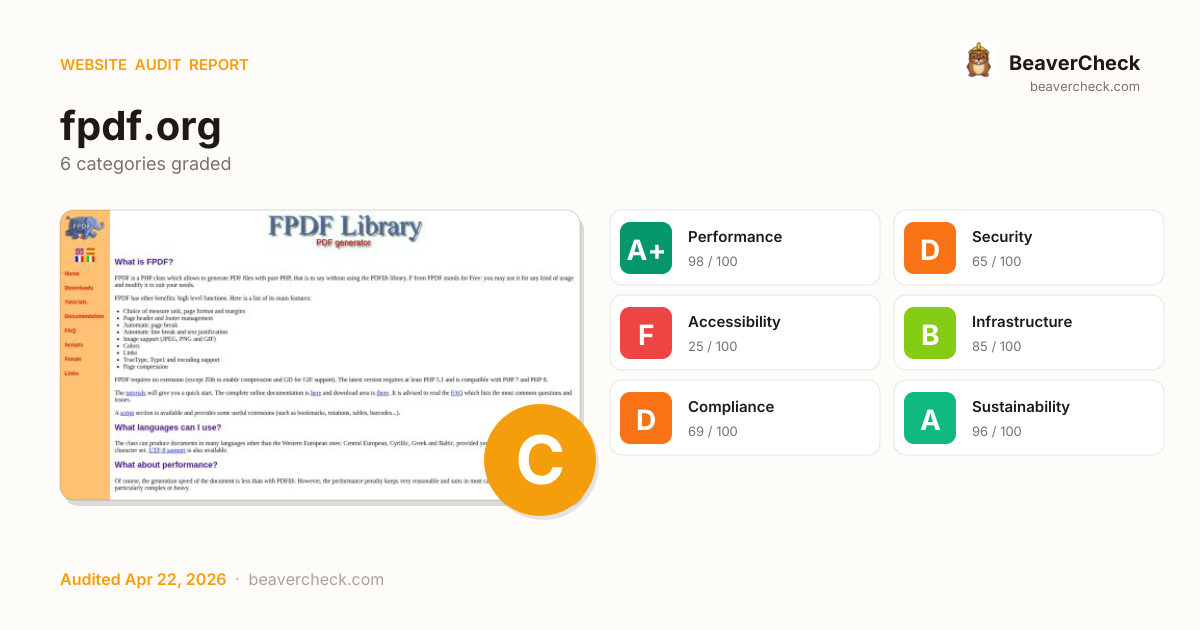
Score: 71 / 100
Based on 6 categories, 0 sections
Fast site — your users get a smooth experience.
Several missing protections leave your users and data exposed.
Major barriers for users with disabilities — up to 15% of your audience.
Solid infrastructure — fast server responses across the board.
Several regulatory requirements are not yet met.
Lean and efficient — low environmental impact per visit.
The overall score is a weighted average of individual category scores. Categories with more impact on user experience and security carry more weight.
Weights reflect general web best practices. Individual needs may differ.
Content-Security-Policy header is missing
Security gaps expose your site and users to attacks, eroding trust.
HSTS header is missing
Security gaps expose your site and users to attacks, eroding trust.
No Content-Security-Policy header found
Security gaps expose your site and users to attacks, eroding trust.
No favicon or icon links detected
Accessibility issues exclude users with disabilities — up to 15% of your potential audience.
Cross-Origin-Embedder-Policy header is missing
Security gaps expose your site and users to attacks, eroding trust.
High impact, low effort — start here.
High impact, requires investment.
Small gains, minimal effort.
Nothing in this quadrant — good news.
Low impact, high effort — do last.
Nothing in this quadrant — good news.
[](https://beavercheck.com/results/5de53c3a-0a23-44e4-90e7-b279e0cb16e1)<a href="https://beavercheck.com/results/5de53c3a-0a23-44e4-90e7-b279e0cb16e1"><img src="https://beavercheck.com/badge?url=https%3A%2F%2Ffpdf.org" alt="BeaverCheck Score"></a>https://beavercheck.com/badge?url=https%3A%2F%2Ffpdf.orgThis badge auto-updates with your latest scan result.
Your site performs reasonably well, but a few targeted fixes could meaningfully improve results. Accessibility issues exclude users who rely on assistive technology — an estimated 15% of your potential audience. Addressing the critical issues below would have the most immediate impact on your user trust.
3 barrier(s) likely increasing bounce by ~22%.
No HSTS header
+1% bounceReturning visitors are briefly exposed to downgrade attacks on first request
Fix: Set Strict-Transport-Security: max-age=31536000; includeSubDomains
No Content-Security-Policy header
+1% bounceHigher XSS blast radius — one compromised script can exfiltrate the checkout form
Fix: Ship a reporting-only CSP first, then enforce once violations are clean
No viewport meta tag
+15% bounceMobile browsers render at desktop width and shrink — text unreadable, tap targets miniature
Fix: Add <meta name="viewport" content="width=device-width, initial-scale=1">
Preliminary CRO audit — each barrier links to the tab with detailed analysis.
€280 investment → €0.00/month returns + EUR 20,000,000 risk avoided
€280
4h · 5 findings
€0.00 /mo
~€0.05 / year
EUR 20,000,000
if kept compliant
€160 — in quick wins — start here for the fastest payback
Figures combine localized regulatory fine ceilings, search/conversion value priced against local CPC, and bandwidth waste estimates. Results depend on implementation quality and audience composition. Not legal or financial advice.
3.5 developer hours at €80/hr
Based on France rates (€80/hr)
Start here for the best return on investment
€1,666,667 / month at risk
~€20,000,000 / year if left unfixed
€20,000,000
€0.00 /mo
53.0 MB/mo × 0.074 EUR/GB
Compliance figures represent the statutory maximum fine for the most severe triggered category, capped per regulation — not the sum of per-finding penalties. Based on published regulatory fine ranges. This is not legal advice.
Thanks for your feedback!
We'll use a cached audit if available, or offer to scan.
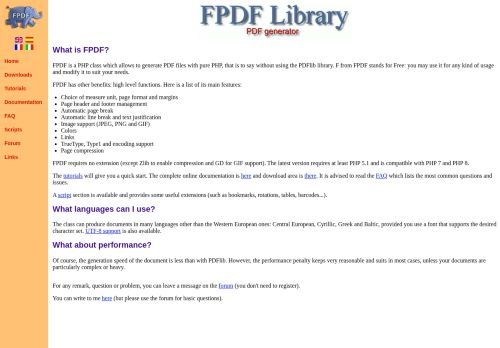
Industry-standard audits powered by Google Lighthouse.
Key metrics that affect user experience.
First Contentful Paint First Contentful Paint — how long until the browser renders the first piece of content. Under 1.8s is good.
0 ms
Largest Contentful Paint Largest Contentful Paint — how long until the largest visible element loads. Under 2.5s is good.
0 ms
Total Blocking Time Total Blocking Time — total time the main thread was blocked, preventing user input. Under 200ms is good.
0 ms
Cumulative Layout Shift Cumulative Layout Shift — measures visual stability. How much the page layout shifts during loading. Under 0.1 is good.
0.000
Speed Index Speed Index — how quickly content is visually displayed during load. Under 3.4s is good.
0 ms
Time to Interactive Time to Interactive — how long until the page is fully interactive and responds to user input. Under 3.8s is good.
0 ms
Audit breakdown by category with detailed findings.
Remove large, duplicate JavaScript modules from bundles to reduce unnecessary bytes consumed by network activity.
Performance issues directly impact user engagement and conversion rates.
Polyfills and transforms enable older browsers to use new JavaScript features. However, many aren't necessary for modern browsers. Consider modifying your JavaScript build process to not transpile Baseline features, unless you know you must support older browsers. Learn why most sites can deploy ES6+ code without transpiling
Shipping ES5 transpiled code to modern browsers wastes bytes — every user with an evergreen browser pays for compatibility you don't need.
Most users today run browsers that natively support ES6+, async/await, optional chaining, and the rest of modern JavaScript. Transpiling to ES5 'just in case' adds 20-40% to your bundle for no benefit. Configure your build to target a modern browserslist, or ship a differential bundle pair (modern + legacy) with the module/nomodule pattern.
Source: Google web.dev / Lighthouse
3rd party code can significantly impact load performance. Reduce and defer loading of 3rd party code to prioritize your page's content.
Performance issues directly impact user engagement and conversion rates.
A long cache lifetime can speed up repeat visits to your page. Learn more about caching.
Performance issues directly impact user engagement and conversion rates.
| Request | Cache TTL | Transfer Size |
|---|---|---|
| fpdf.org/title.png | 900.0 s | 9.4 KiB |
| fpdf.org/logo.gif | 900.0 s | 3.4 KiB |
| fpdf.org/en/fpdf.css | 900.0 s | 697 B |
| fpdf.org/en/flags.gif | 900.0 s | 525 B |
Tap interactions may be delayed by up to 300 ms if the viewport is not optimized for mobile.
Performance issues directly impact user engagement and conversion rates.
These insights are also available in the Chrome DevTools Performance Panel - record a trace to view more detailed information.
Time to Interactive is the amount of time it takes for the page to become fully interactive. Learn more about the Time to Interactive metric.
Performance issues directly impact user engagement and conversion rates.
The maximum potential First Input Delay that your users could experience is the duration of the longest task. Learn more about the Maximum Potential First Input Delay metric.
Performance issues directly impact user engagement and conversion rates.
Redirects introduce additional delays before the page can be loaded. Learn how to avoid page redirects.
Performance issues directly impact user engagement and conversion rates.
Minifying CSS files can reduce network payload sizes. Learn how to minify CSS.
Performance issues directly impact user engagement and conversion rates.
Minifying JavaScript files can reduce payload sizes and script parse time. Learn how to minify JavaScript.
Performance issues directly impact user engagement and conversion rates.
Reduce unused rules from stylesheets and defer CSS not used for above-the-fold content to decrease bytes consumed by network activity. Learn how to reduce unused CSS.
Performance issues directly impact user engagement and conversion rates.
Reduce unused JavaScript and defer loading scripts until they are required to decrease bytes consumed by network activity. Learn how to reduce unused JavaScript.
Multi-megabyte JavaScript bundles delay every interactive feature on the page.
This is the Lighthouse audit fired when too much JS is shipped relative to what executes. The fix isn't a config flag — it requires bundle analysis (webpack-bundle-analyzer, rollup-plugin-visualizer), splitting routes into chunks, lazy-loading off-screen components, and removing unused dependencies. Fundamentally different from minification: minifying reduces byte count, this reduces what's downloaded at all.
Source: Google web.dev / Lighthouse
Lists the longest tasks on the main thread, useful for identifying worst contributors to input delay. Learn how to avoid long main-thread tasks
Performance issues directly impact user engagement and conversion rates.
More information about the performance of your application. These numbers don't directly affect the Performance score.
These checks highlight opportunities to improve the accessibility of your web app. Automatic detection can only detect a subset of issues and does not guarantee the accessibility of your web app, so manual testing is also encouraged.
Screen reader users rely on frame titles to describe the contents of frames. Learn more about frame titles.
Performance issues directly impact user engagement and conversion rates.
| Failing Elements |
|---|
frameset > frame frameset > frame |
frameset > frame frameset > frame |
These are opportunities to improve the semantics of the controls in your application. This may enhance the experience for users of assistive technology, like a screen reader.
If a page doesn't specify a `lang` attribute, a screen reader assumes that the page is in the default language that the user chose when setting up the screen reader. If the page isn't actually in the default language, then the screen reader might not announce the page's text correctly. Learn more about the `lang` attribute.
Performance issues directly impact user engagement and conversion rates.
| Failing Elements |
|---|
html html |
These are opportunities to improve the interpretation of your content by users in different locales.
One main landmark helps screen reader users navigate a web page. Learn more about landmarks.
Performance issues directly impact user engagement and conversion rates.
| Failing Elements |
|---|
html html |
These items highlight common accessibility best practices.
Specifying a doctype prevents the browser from switching to quirks-mode. Learn more about the doctype declaration.
Performance issues directly impact user engagement and conversion rates.
Errors logged to the console indicate unresolved problems. They can come from network request failures and other browser concerns. Learn more about this errors in console diagnostic audit
Performance issues directly impact user engagement and conversion rates.
| Source | Description |
|---|---|
Failed to load resource: the server responded with a status of 404 () |
These checks ensure that your page is following basic search engine optimization advice. There are many additional factors Lighthouse does not score here that may affect your search ranking, including performance on Core Web Vitals. Learn more about Google Search Essentials.
Industry-standard audits powered by Google Lighthouse. — Desktop
Key metrics that affect user experience. — Desktop
First Contentful Paint First Contentful Paint — how long until the browser renders the first piece of content. Under 1.8s is good.
0 ms
Largest Contentful Paint Largest Contentful Paint — how long until the largest visible element loads. Under 2.5s is good.
0 ms
Total Blocking Time Total Blocking Time — total time the main thread was blocked, preventing user input. Under 200ms is good.
0 ms
Cumulative Layout Shift Cumulative Layout Shift — measures visual stability. How much the page layout shifts during loading. Under 0.1 is good.
0.000
Speed Index Speed Index — how quickly content is visually displayed during load. Under 3.4s is good.
0 ms
Time to Interactive Time to Interactive — how long until the page is fully interactive and responds to user input. Under 3.8s is good.
0 ms
Audit breakdown by category with detailed findings.
Remove large, duplicate JavaScript modules from bundles to reduce unnecessary bytes consumed by network activity.
Performance issues directly impact user engagement and conversion rates.
Polyfills and transforms enable older browsers to use new JavaScript features. However, many aren't necessary for modern browsers. Consider modifying your JavaScript build process to not transpile Baseline features, unless you know you must support older browsers. Learn why most sites can deploy ES6+ code without transpiling
Shipping ES5 transpiled code to modern browsers wastes bytes — every user with an evergreen browser pays for compatibility you don't need.
Most users today run browsers that natively support ES6+, async/await, optional chaining, and the rest of modern JavaScript. Transpiling to ES5 'just in case' adds 20-40% to your bundle for no benefit. Configure your build to target a modern browserslist, or ship a differential bundle pair (modern + legacy) with the module/nomodule pattern.
Source: Google web.dev / Lighthouse
3rd party code can significantly impact load performance. Reduce and defer loading of 3rd party code to prioritize your page's content.
Performance issues directly impact user engagement and conversion rates.
A long cache lifetime can speed up repeat visits to your page. Learn more about caching.
Performance issues directly impact user engagement and conversion rates.
| Request | Cache TTL | Transfer Size |
|---|---|---|
| fpdf.org/title.png | 900.0 s | 9.4 KiB |
| fpdf.org/logo.gif | 900.0 s | 3.4 KiB |
| fpdf.org/en/fpdf.css | 900.0 s | 697 B |
| fpdf.org/en/flags.gif | 900.0 s | 525 B |
These insights are also available in the Chrome DevTools Performance Panel - record a trace to view more detailed information.
Time to Interactive is the amount of time it takes for the page to become fully interactive. Learn more about the Time to Interactive metric.
Performance issues directly impact user engagement and conversion rates.
The maximum potential First Input Delay that your users could experience is the duration of the longest task. Learn more about the Maximum Potential First Input Delay metric.
Performance issues directly impact user engagement and conversion rates.
Redirects introduce additional delays before the page can be loaded. Learn how to avoid page redirects.
Performance issues directly impact user engagement and conversion rates.
Minifying CSS files can reduce network payload sizes. Learn how to minify CSS.
Performance issues directly impact user engagement and conversion rates.
Minifying JavaScript files can reduce payload sizes and script parse time. Learn how to minify JavaScript.
Performance issues directly impact user engagement and conversion rates.
Reduce unused rules from stylesheets and defer CSS not used for above-the-fold content to decrease bytes consumed by network activity. Learn how to reduce unused CSS.
Performance issues directly impact user engagement and conversion rates.
Reduce unused JavaScript and defer loading scripts until they are required to decrease bytes consumed by network activity. Learn how to reduce unused JavaScript.
Multi-megabyte JavaScript bundles delay every interactive feature on the page.
This is the Lighthouse audit fired when too much JS is shipped relative to what executes. The fix isn't a config flag — it requires bundle analysis (webpack-bundle-analyzer, rollup-plugin-visualizer), splitting routes into chunks, lazy-loading off-screen components, and removing unused dependencies. Fundamentally different from minification: minifying reduces byte count, this reduces what's downloaded at all.
Source: Google web.dev / Lighthouse
Lists the longest tasks on the main thread, useful for identifying worst contributors to input delay. Learn how to avoid long main-thread tasks
Performance issues directly impact user engagement and conversion rates.
More information about the performance of your application. These numbers don't directly affect the Performance score.
These checks highlight opportunities to improve the accessibility of your web app. Automatic detection can only detect a subset of issues and does not guarantee the accessibility of your web app, so manual testing is also encouraged.
Screen reader users rely on frame titles to describe the contents of frames. Learn more about frame titles.
Performance issues directly impact user engagement and conversion rates.
| Failing Elements |
|---|
frameset > frame frameset > frame |
frameset > frame frameset > frame |
These are opportunities to improve the semantics of the controls in your application. This may enhance the experience for users of assistive technology, like a screen reader.
If a page doesn't specify a `lang` attribute, a screen reader assumes that the page is in the default language that the user chose when setting up the screen reader. If the page isn't actually in the default language, then the screen reader might not announce the page's text correctly. Learn more about the `lang` attribute.
Performance issues directly impact user engagement and conversion rates.
| Failing Elements |
|---|
html html |
These are opportunities to improve the interpretation of your content by users in different locales.
One main landmark helps screen reader users navigate a web page. Learn more about landmarks.
Performance issues directly impact user engagement and conversion rates.
| Failing Elements |
|---|
html html |
These items highlight common accessibility best practices.
Specifying a doctype prevents the browser from switching to quirks-mode. Learn more about the doctype declaration.
Performance issues directly impact user engagement and conversion rates.
Errors logged to the console indicate unresolved problems. They can come from network request failures and other browser concerns. Learn more about this errors in console diagnostic audit
Performance issues directly impact user engagement and conversion rates.
| Source | Description |
|---|---|
Failed to load resource: the server responded with a status of 404 () |
These checks ensure that your page is following basic search engine optimization advice. There are many additional factors Lighthouse does not score here that may affect your search ranking, including performance on Core Web Vitals. Learn more about Google Search Essentials.
Send Feedback