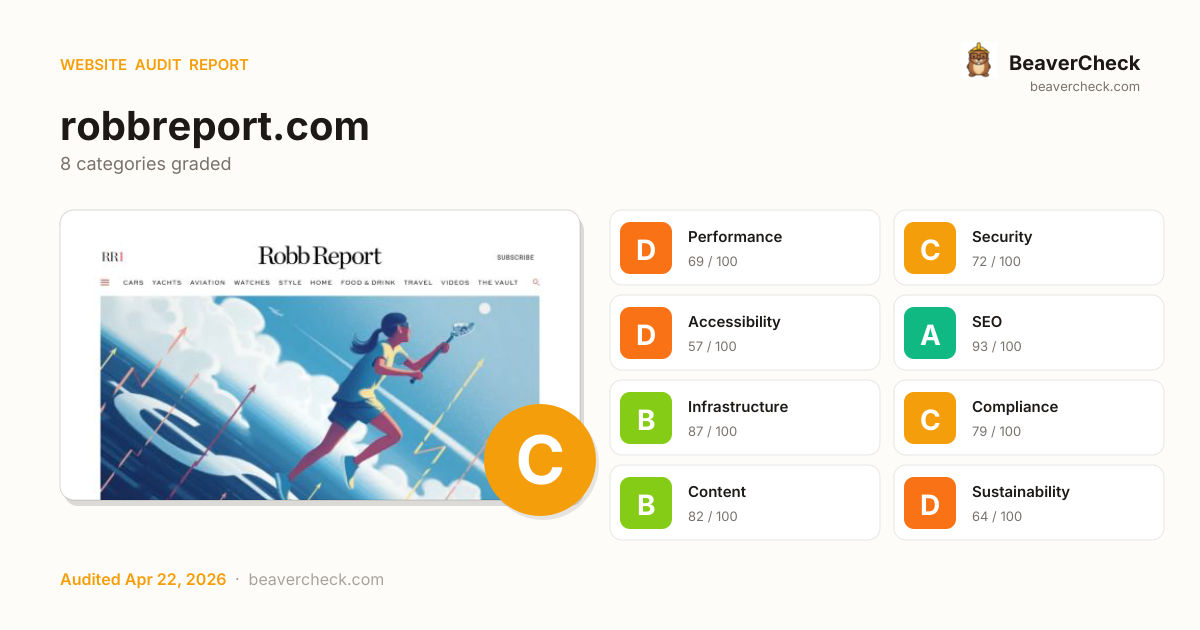
Mobile 375 × 812

Desktop 1440 × 900

Score: 74 / 100
Based on 8 categories, 0 sections
Room to improve — your 4.9s load time is above Google's 2.5s 'Good' threshold.
Good foundation, but a few gaps could be exploited.
Several issues make your site difficult for assistive technology users.
Well-optimized for search — your content is discoverable.
Solid infrastructure — fast server responses across the board.
Mostly compliant — a few items need attention.
Good content signals with minor gaps.
Heavier than average — reducing page weight saves energy and bandwidth.
The overall score is a weighted average of individual category scores. Categories with more impact on user experience and security carry more weight.
Weights reflect general web best practices. Individual needs may differ.
Page weighs 10.6 MB (4.6 MB transferred)
Performance issues directly impact user engagement and conversion rates.
1 control(s) without accessible label
Accessibility issues exclude users with disabilities — up to 15% of your potential audience.
6 button(s) with no accessible text
Accessibility issues exclude users with disabilities — up to 15% of your potential audience.
144 third-party resources (84% of weight)
Performance issues directly impact user engagement and conversion rates.
212 HTTP requests — consider bundling or reducing
Performance issues directly impact user engagement and conversion rates.
High impact, low effort — start here.
Nothing in this quadrant — good news.
High impact, requires investment.
Small gains, minimal effort.
Nothing in this quadrant — good news.
Low impact, high effort — do last.
Nothing in this quadrant — good news.
[](https://beavercheck.com/results/60933e0a-ab05-454a-abe5-9658d70e202b)<a href="https://beavercheck.com/results/60933e0a-ab05-454a-abe5-9658d70e202b"><img src="https://beavercheck.com/badge?url=https%3A%2F%2Frobbreport.com" alt="BeaverCheck Score"></a>https://beavercheck.com/badge?url=https%3A%2F%2Frobbreport.comThis badge auto-updates with your latest scan result.
Your site performs reasonably well, but a few targeted fixes could meaningfully improve results. Your LCP of 4.9s exceeds Google's 2.5s 'Good' threshold and the 3 performance issues below directly contribute to it. Accessibility issues exclude users who rely on assistive technology — an estimated 15% of your potential audience. Addressing the critical issues below would have the most immediate impact on your conversion rate.
9 barrier(s) likely increasing bounce by ~35%.
Page takes 4.9s to load
+12% bounceUsers abandon at ~3s — you're 2.4s over the 2.5s threshold
Fix: Optimize render-blocking resources, preload the hero image, and compress images
Page feels frozen for 1.2s
+5% bounceClicks on the primary CTA are ignored while JavaScript runs
Fix: Break up long tasks; defer non-critical JavaScript to post-hydration
Mixed content on HTTPS page
+8% bounceBrowsers block insecure subresources — broken images, missing scripts, warning badge
Fix: Change http:// URLs inside the page to https:// (or protocol-relative)
No HSTS header
+1% bounceReturning visitors are briefly exposed to downgrade attacks on first request
Fix: Set Strict-Transport-Security: max-age=31536000; includeSubDomains
No Content-Security-Policy header
+1% bounceHigher XSS blast radius — one compromised script can exfiltrate the checkout form
Fix: Ship a reporting-only CSP first, then enforce once violations are clean
1 form field(s) without a label
+2% bounceScreen readers skip unlabeled fields; autofill can't identify them; checkout abandonment spikes
Fix: Associate every input with a visible <label for="…">; add autocomplete attributes
Viewport disables user zoom
+2% bounceVisitors with low vision can't read the page — and some jurisdictions treat this as a legal risk
Fix: Remove user-scalable=no; drop maximum-scale if it's below 2
No skip-to-content link
+1% bounceKeyboard and screen-reader users must tab through the entire header on every page
Fix: Add a visible-on-focus <a href="#main">Skip to content</a> as the first focusable element
30 broken link(s) on the page
+5% bounceClicks land on 404s — trust drops and the session often ends
Fix: Fix or remove the broken destinations surfaced on the Content tab
Preliminary CRO audit — each barrier links to the tab with detailed analysis.
$900 investment → $3,514/month returns + USD 157,500 risk avoided
$900
9h · 5 findings
$3,514 /mo
~$42,170 / year
USD 157,500
if kept compliant
Figures combine localized regulatory fine ceilings, search/conversion value priced against local CPC, and bandwidth waste estimates. Results depend on implementation quality and audience composition. Not legal or financial advice.
9.0 developer hours at $100/hr
Based on United States rates ($100/hr)
$13,126 / month at risk
~$157,514 / year if left unfixed
$157,500
+6 more
$1.16 /mo
14522.7 MB/mo × 0.080 USD/GB
Compliance figures represent the statutory maximum fine for the most severe triggered category, capped per regulation — not the sum of per-finding penalties. Based on published regulatory fine ranges. This is not legal advice.
Unique monthly visitors from your analytics
Purchases, signups, or key actions
Optional — for revenue estimation
more engaged visitors from reduced bounce
Fix 3 critical issues to capture this value
Based on Google/Deloitte research ("Milliseconds Make Millions") showing a ~7% bounce rate increase per additional second of LCP above the 2.5s "Good" threshold.
Your site's LCP: → estimated after fixes.
These are estimates based on industry research — actual results vary
Your data stays in your browser — nothing is sent to our servers
Thanks for your feedback!
We'll use a cached audit if available, or offer to scan.
Industry-standard audits powered by Google Lighthouse.
Key metrics that affect user experience.
First Contentful Paint First Contentful Paint — how long until the browser renders the first piece of content. Under 1.8s is good.
2.56 s
Largest Contentful Paint Largest Contentful Paint — how long until the largest visible element loads. Under 2.5s is good.
4.91 s
Total Blocking Time Total Blocking Time — total time the main thread was blocked, preventing user input. Under 200ms is good.
1.18 s
Cumulative Layout Shift Cumulative Layout Shift — measures visual stability. How much the page layout shifts during loading. Under 0.1 is good.
0.003
Speed Index Speed Index — how quickly content is visually displayed during load. Under 3.4s is good.
5.74 s
Time to Interactive Time to Interactive — how long until the page is fully interactive and responds to user input. Under 3.8s is good.
25.75 s
Audit breakdown by category with detailed findings.
Remove large, duplicate JavaScript modules from bundles to reduce unnecessary bytes consumed by network activity.
Performance issues directly impact user engagement and conversion rates.
Polyfills and transforms enable older browsers to use new JavaScript features. However, many aren't necessary for modern browsers. Consider modifying your JavaScript build process to not transpile Baseline features, unless you know you must support older browsers. Learn why most sites can deploy ES6+ code without transpiling
Shipping ES5 transpiled code to modern browsers wastes bytes — every user with an evergreen browser pays for compatibility you don't need.
Most users today run browsers that natively support ES6+, async/await, optional chaining, and the rest of modern JavaScript. Transpiling to ES5 'just in case' adds 20-40% to your bundle for no benefit. Configure your build to target a modern browserslist, or ship a differential bundle pair (modern + legacy) with the module/nomodule pattern.
Source: Google web.dev / Lighthouse
3rd party code can significantly impact load performance. Reduce and defer loading of 3rd party code to prioritize your page's content.
Performance issues directly impact user engagement and conversion rates.
Your first network request is the most important. Reduce its latency by avoiding redirects, ensuring a fast server response, and enabling text compression.
Performance issues directly impact user engagement and conversion rates.
Consider setting font-display to swap or optional to ensure text is consistently visible. swap can be further optimized to mitigate layout shifts with font metric overrides.
Performance issues directly impact user engagement and conversion rates.
A forced reflow occurs when JavaScript queries geometric properties (such as offsetWidth) after styles have been invalidated by a change to the DOM state. This can result in poor performance. Learn more about forced reflows and possible mitigations.
Performance issues directly impact user engagement and conversion rates.
Reducing the download time of images can improve the perceived load time of the page and LCP. Learn more about optimizing image size
Performance issues directly impact user engagement and conversion rates.
| URL | Resource Size | Est Savings | |
|---|---|---|---|
Four Roses Single Barrels article.featured-category__story > div.featured-image > a > img.attachment-featured-image-480x270 | /wp-content/uploads/2026/04/Four_Roses_Single_Barrels_202... | 146.8 KiB | 137.4 KiB |
les colombieres menton article.editor-picks__secondary-pick > div.featured-image > a > img.attachment-featured-image-320x180 | robbreport.com/wp-content/uploads/2026/04/lescolombieres.jpg?resize=681,383 | 61.3 KiB | 49.5 KiB |
150 Littlefield Shirley Temple Wedding House Monterey article.featured-category__story > div.featured-image > a > img.attachment-featured-image-480x270 | /wp-content/uploads/2026/04/ShirleyTempleWedding-House_CA... | 31.5 KiB | 22.1 KiB |
Bulgari Octo Finissimo, Jaeger-LeCoultre Master Control Perpetual Calendar, Par… article.editor-picks__secondary-pick > div.featured-image > a > img.attachment-featured-image-320x180 | /wp-content/uploads/2026/04/RR_20260421_Watches_Wonders_E... | 27.5 KiB | 22.0 KiB |
magazine cover div.header-subscribe__container-inner > div.header-get__magazine-container > div.gtm-sub-cover > img.gtm-cover | /wp-content/uploads/2026/04/Untitled-design-6.png?w=150&h... | 25.5 KiB | 21.1 KiB |
X Square Robot new Wall-B robot arranges flowers article.featured-category__story > div.featured-image > a > img.attachment-featured-image-480x270 | robbreport.com/wp-content/uploads/2026/04/x-square-robot-wall-b1.jpg?w=480 | 25.9 KiB | 16.5 KiB |
amsterdam netherlands most expensive home listing article.featured-category__story > div.featured-image > a > img.attachment-featured-image-480x270 | robbreport.com/wp-content/uploads/2026/04/amsterdam-most-exp.jpg?w=480 | 22.4 KiB | 10.6 KiB |
The factory-restored 1972 Lamborghini Miura SV article.featured-category__story > div.featured-image > a > img.attachment-featured-image-480x270 | /wp-content/uploads/2026/04/restored-1972-lamborghini-miu... | 21.4 KiB | 9.7 KiB |
Timothée Chalamet; Urban Jürgensen UJ2 article.featured-category__story > div.featured-image > a > img.attachment-featured-image-480x270 | /wp-content/uploads/2026/04/Timothee-Chalamet-Urban-Jurge... | 14.1 KiB | 7.8 KiB |
TAG Heuer Formula 1 Solargraph article.featured-category__story > div.featured-image > a > img.attachment-featured-image-480x270 | /wp-content/uploads/2026/04/tag-heuer-formula-1-solargrap... | 11.9 KiB | 6.6 KiB |
The JAS Motorsport Tensei article.featured-category__story > div.featured-image > a > img.attachment-featured-image-480x270 | robbreport.com/wp-content/uploads/2026/04/jas-motorsport-tensei-01.jpg?w=480 | 10.2 KiB | 4.5 KiB |
Avoid chaining critical requests by reducing the length of chains, reducing the download size of resources, or deferring the download of unnecessary resources to improve page load.
Performance issues directly impact user engagement and conversion rates.
Requests are blocking the page's initial render, which may delay LCP. Deferring or inlining can move these network requests out of the critical path.
Performance issues directly impact user engagement and conversion rates.
| URL | Transfer Size | Duration |
|---|---|---|
| cdn.cookielaw.org/scripttemplates/otSDKStub.js | 0 B | 780 ms |
| iabusprivacy.pmc.com/geo-info.js | 265 B | 751 ms |
| /wp-content/plugins/pmc-plugins/pmc-piano/assets/build/co... | 1.2 KiB | |
| /_static/??-eJydk9FuwyAMRX9olKUPy16mfQsQp2EBjGyTqX8/kqbSq... | 43.3 KiB | 451 ms |
| /wp-content/plugins/pmc-plugins/pmc-piano/assets/build/wo... | 8.6 KiB | |
| /wp-content/plugins/pmc-plugins/pmc-video-player/build/js... | 7.5 KiB | 150 ms |
A long cache lifetime can speed up repeat visits to your page. Learn more about caching.
Performance issues directly impact user engagement and conversion rates.
These insights are also available in the Chrome DevTools Performance Panel - record a trace to view more detailed information.
Time to Interactive is the amount of time it takes for the page to become fully interactive. Learn more about the Time to Interactive metric.
Performance issues directly impact user engagement and conversion rates.
Keep the server response time for the main document short because all other requests depend on it. Learn more about the Time to First Byte metric.
Performance issues directly impact user engagement and conversion rates.
| URL | Time Spent |
|---|---|
| robbreport.com/ | 893 ms |
The maximum potential First Input Delay that your users could experience is the duration of the longest task. Learn more about the Maximum Potential First Input Delay metric.
Performance issues directly impact user engagement and conversion rates.
Reduce unused rules from stylesheets and defer CSS not used for above-the-fold content to decrease bytes consumed by network activity. Learn how to reduce unused CSS.
Performance issues directly impact user engagement and conversion rates.
| URL | Transfer Size | Est Savings |
|---|---|---|
| /_static/??-eJydk9FuwyAMRX9olKUPy16mfQsQp2EBjGyTqX8/kqbSq... | 43.1 KiB | 35.5 KiB |
| :root{--border-color-grey-lightest: rgb(241, 244, 247);--border-color-brand-secondary-light: rgb(0,… | 23.9 KiB | 20.2 KiB |
| robbreport.com/wp-includes/css/dist/block-library/style.min.css?m=1774626871g | 15.1 KiB | 15.0 KiB |
Consider reducing the time spent parsing, compiling, and executing JS. You may find delivering smaller JS payloads helps with this. Learn how to reduce Javascript execution time.
Performance issues directly impact user engagement and conversion rates.
| URL | Total CPU Time | Script Evaluation | Script Parse |
|---|---|---|---|
| Unattributable | 916 ms | 133 ms | 0.0 ms |
| robbreport.com/ | 862 ms | 150 ms | 27 ms |
| cdn.tinypass.com/api/tinypass.min.js | 604 ms | 455 ms | 49 ms |
| robbreport.com/wp-includes/js/jquery/jquery.min.js?ver=3.7.1 | 397 ms | 34 ms | 6.1 ms |
| ads.blogherads.com/static/chunks/5273.eec6f62e6c9beefc4be4.js | 394 ms | 361 ms | 23 ms |
| www.googletagmanager.com/gtag/js?id=G-4ZF0QC8G81&ver=6.7.5 | 240 ms | 189 ms | 50 ms |
| /wp-content/themes/pmc-robbreport-2017-v2/static/js/commo... | 227 ms | 208 ms | 12 ms |
| html-load.com/loader.min.js | 218 ms | 167 ms | 21 ms |
| /wp-content/themes/pmc-robbreport-2017-v2/static/js/home.... | 164 ms | 94 ms | 1.5 ms |
| www.googletagmanager.com/gtm.js?id=GTM-NSR5BCK | 146 ms | 107 ms | 38 ms |
| /p/323954724/connatix.player.js?cid=1ffe63de-eb53-11e9-b4... | 129 ms | 77 ms | 52 ms |
| fillthemap.com/chunks/k8dp76/qwke7z.vendor.js | 97 ms | 65 ms | 7.3 ms |
| pagead2.googlesyndication.com/pagead/js/adsbygoogle.js | 77 ms | 65 ms | 12 ms |
| connect.facebook.net/en_US/bundle/sdk.js/ | 60 ms | 42 ms | 18 ms |
Consider reducing the time spent parsing, compiling and executing JS. You may find delivering smaller JS payloads helps with this. Learn how to minimize main-thread work
Performance issues directly impact user engagement and conversion rates.
| Category | Time Spent |
|---|---|
| Script Evaluation | 2.4 s |
| Other | 1.0 s |
| Style & Layout | 855 ms |
| Script Parsing & Compilation | 433 ms |
| Rendering | 166 ms |
| Parse HTML & CSS | 108 ms |
| Garbage Collection | 20 ms |
Reduce unused JavaScript and defer loading scripts until they are required to decrease bytes consumed by network activity. Learn how to reduce unused JavaScript.
Multi-megabyte JavaScript bundles delay every interactive feature on the page.
This is the Lighthouse audit fired when too much JS is shipped relative to what executes. The fix isn't a config flag — it requires bundle analysis (webpack-bundle-analyzer, rollup-plugin-visualizer), splitting routes into chunks, lazy-loading off-screen components, and removing unused dependencies. Fundamentally different from minification: minifying reduces byte count, this reduces what's downloaded at all.
Source: Google web.dev / Lighthouse
| URL | Transfer Size | Est Savings |
|---|---|---|
| /p/323954724/connatix.player.js?cid=1ffe63de-eb53-11e9-b4... | 138.5 KiB | 94.7 KiB |
| ads.blogherads.com/static/chunks/5273.eec6f62e6c9beefc4be4.js | 115.4 KiB | 92.9 KiB |
| cdn.tinypass.com/api/tinypass.min.js | 132.1 KiB | 82.5 KiB |
| www.googletagmanager.com/gtag/js?id=G-4ZF0QC8G81&ver=6.7.5 | 168.3 KiB | 68.6 KiB |
| www.googletagmanager.com/gtm.js?id=GTM-NSR5BCK | 130.4 KiB | 65.9 KiB |
| connect.facebook.net/en_US/bundle/sdk.js/ | 78.4 KiB | 54.4 KiB |
| pagead2.googlesyndication.com/pagead/js/adsbygoogle.js | 54.1 KiB | 34.9 KiB |
| ads.blogherads.com/static/chunks/831.b113b40433677910de75.js | 27.6 KiB | 22.3 KiB |
Large network payloads cost users real money and are highly correlated with long load times. Learn how to reduce payload sizes.
Performance issues directly impact user engagement and conversion rates.
More information about the performance of your application. These numbers don't directly affect the Performance score.
These checks highlight opportunities to improve the accessibility of your web app. Automatic detection can only detect a subset of issues and does not guarantee the accessibility of your web app, so manual testing is also encouraged.
Low-contrast text is difficult or impossible for many users to read. Learn how to provide sufficient color contrast.
Performance issues directly impact user engagement and conversion rates.
| Failing Elements |
|---|
Wednesday, April 22, 2026 nav.header-nav > div.header__subscribe-mobile > h3.header__subscribe--mobile-time > span |
SHOP NOW div.gtm-sub-container > div.gtm-content > div > a.button |
SUBSCRIBE div.header-get__magazine-container > div.gtm-content > div > a.button |
These are opportunities to improve the legibility of your content.
Screen reader users rely on frame titles to describe the contents of frames. Learn more about frame titles.
Performance issues directly impact user engagement and conversion rates.
| Failing Elements |
|---|
section.sectioner > div.footer-rr1_container > div.footer-rr1_video > iframe section.sectioner > div.footer-rr1_container > div.footer-rr1_video > iframe |
These are opportunities to improve the semantics of the controls in your application. This may enhance the experience for users of assistive technology, like a screen reader.
Properly ordered headings that do not skip levels convey the semantic structure of the page, making it easier to navigate and understand when using assistive technologies. Learn more about heading order.
Performance issues directly impact user engagement and conversion rates.
| Failing Elements |
|---|
Wednesday, April 22, 2026 header > nav.header-nav > div.header__subscribe-mobile > h3.header__subscribe--mobile-time |
These are opportunities to improve keyboard navigation in your application.
Disabling zooming is problematic for users with low vision who rely on screen magnification to properly see the contents of a web page. Learn more about the viewport meta tag.
Performance issues directly impact user engagement and conversion rates.
| Failing Elements |
|---|
head > meta head > meta |
These items highlight common accessibility best practices.
Deprecated APIs will eventually be removed from the browser. Learn more about deprecated APIs.
Performance issues directly impact user engagement and conversion rates.
| Deprecation / Warning | Source |
|---|---|
| Topics | ads.blogherads.com/static/chunks/3622.7d0e84ccad5146cd86e6.js line 1, col 55741 |
Errors logged to the console indicate unresolved problems. They can come from network request failures and other browser concerns. Learn more about this errors in console diagnostic audit
Performance issues directly impact user engagement and conversion rates.
| Source | Description |
|---|---|
ads.blogherads.com/static/chunks/5273.eec6f62e6c9beefc4be4.js line 1, col 288164 | %cP%cM%cC Atlas MG padding: 2px 1px 2px 10px; border-radius: 7px 0 0 7px; background-color: black; color: white; padding: 2px 1px; background-color: black; color: #ed1c24; padding: 2px 10px 2px 1px; border-radius: 0 7px 7px 0; background-color: black; color: white; Error: Time to wait for consent has expired.
at s (https://ads.blogherads.com/static/chunks/5273.eec6f62e6c9beefc4be4.js:2:106729)
at Y (<anonymous>:1:2216) |
/wp-content/themes/pmc-robbreport-2017-v2/assets/build/js... line 1, col 45830 | ReferenceError: WebFont is not defined
at Object.load (https://robbreport.com/wp-content/themes/pmc-robbreport-2017-v2/assets/build/js/common.js?ver=1765796790:2:45831)
at https://robbreport.com/wp-content/themes/pmc-robbreport-2017-v2/assets/build/js/common.js?ver=1765796790:2:45754
at Y (<anonymous>:1:2216) |
These checks ensure that your page is following basic search engine optimization advice. There are many additional factors Lighthouse does not score here that may affect your search ranking, including performance on Core Web Vitals. Learn more about Google Search Essentials.
Industry-standard audits powered by Google Lighthouse. — Desktop
Key metrics that affect user experience. — Desktop
First Contentful Paint First Contentful Paint — how long until the browser renders the first piece of content. Under 1.8s is good.
649 ms
Largest Contentful Paint Largest Contentful Paint — how long until the largest visible element loads. Under 2.5s is good.
1.23 s
Total Blocking Time Total Blocking Time — total time the main thread was blocked, preventing user input. Under 200ms is good.
54 ms
Cumulative Layout Shift Cumulative Layout Shift — measures visual stability. How much the page layout shifts during loading. Under 0.1 is good.
0.002
Speed Index Speed Index — how quickly content is visually displayed during load. Under 3.4s is good.
1.82 s
Time to Interactive Time to Interactive — how long until the page is fully interactive and responds to user input. Under 3.8s is good.
3.11 s
Audit breakdown by category with detailed findings.
Remove large, duplicate JavaScript modules from bundles to reduce unnecessary bytes consumed by network activity.
Performance issues directly impact user engagement and conversion rates.
Polyfills and transforms enable older browsers to use new JavaScript features. However, many aren't necessary for modern browsers. Consider modifying your JavaScript build process to not transpile Baseline features, unless you know you must support older browsers. Learn why most sites can deploy ES6+ code without transpiling
Shipping ES5 transpiled code to modern browsers wastes bytes — every user with an evergreen browser pays for compatibility you don't need.
Most users today run browsers that natively support ES6+, async/await, optional chaining, and the rest of modern JavaScript. Transpiling to ES5 'just in case' adds 20-40% to your bundle for no benefit. Configure your build to target a modern browserslist, or ship a differential bundle pair (modern + legacy) with the module/nomodule pattern.
Source: Google web.dev / Lighthouse
3rd party code can significantly impact load performance. Reduce and defer loading of 3rd party code to prioritize your page's content.
Performance issues directly impact user engagement and conversion rates.
Your first network request is the most important. Reduce its latency by avoiding redirects, ensuring a fast server response, and enabling text compression.
Performance issues directly impact user engagement and conversion rates.
Consider setting font-display to swap or optional to ensure text is consistently visible. swap can be further optimized to mitigate layout shifts with font metric overrides.
Performance issues directly impact user engagement and conversion rates.
A forced reflow occurs when JavaScript queries geometric properties (such as offsetWidth) after styles have been invalidated by a change to the DOM state. This can result in poor performance. Learn more about forced reflows and possible mitigations.
Performance issues directly impact user engagement and conversion rates.
Reducing the download time of images can improve the perceived load time of the page and LCP. Learn more about optimizing image size
Performance issues directly impact user engagement and conversion rates.
| URL | Resource Size | Est Savings | |
|---|---|---|---|
les colombieres menton article.editor-picks__secondary-pick > div.featured-image > a > img.attachment-featured-image-320x180 | robbreport.com/wp-content/uploads/2026/04/lescolombieres.jpg?resize=681,383 | 61.3 KiB | 49.0 KiB |
magazine cover div.header-subscribe__container-inner > div.header-get__magazine-container > div.gtm-sub-cover > img.gtm-cover | /wp-content/uploads/2026/04/Untitled-design-6.png?w=150&h... | 25.5 KiB | 21.4 KiB |
Bulgari Octo Finissimo, Jaeger-LeCoultre Master Control Perpetual Calendar, Par… article.editor-picks__secondary-pick > div.featured-image > a > img.attachment-featured-image-320x180 | /wp-content/uploads/2026/04/RR_20260421_Watches_Wonders_E... | 27.5 KiB | 19.5 KiB |
Avoid chaining critical requests by reducing the length of chains, reducing the download size of resources, or deferring the download of unnecessary resources to improve page load.
Performance issues directly impact user engagement and conversion rates.
Requests are blocking the page's initial render, which may delay LCP. Deferring or inlining can move these network requests out of the critical path.
Performance issues directly impact user engagement and conversion rates.
A long cache lifetime can speed up repeat visits to your page. Learn more about caching.
Performance issues directly impact user engagement and conversion rates.
These insights are also available in the Chrome DevTools Performance Panel - record a trace to view more detailed information.
Keep the server response time for the main document short because all other requests depend on it. Learn more about the Time to First Byte metric.
Performance issues directly impact user engagement and conversion rates.
| URL | Time Spent |
|---|---|
| robbreport.com/ | 1.3 s |
Time to Interactive is the amount of time it takes for the page to become fully interactive. Learn more about the Time to Interactive metric.
Performance issues directly impact user engagement and conversion rates.
Reduce unused rules from stylesheets and defer CSS not used for above-the-fold content to decrease bytes consumed by network activity. Learn how to reduce unused CSS.
Performance issues directly impact user engagement and conversion rates.
| URL | Transfer Size | Est Savings |
|---|---|---|
| /_static/??-eJydk9FuwyAMRX9olKUPy16mfQsQp2EBjGyTqX8/kqbSq... | 43.1 KiB | 36.3 KiB |
| :root{--border-color-grey-lightest: rgb(241, 244, 247);--border-color-brand-secondary-light: rgb(0,… | 23.8 KiB | 20.1 KiB |
| robbreport.com/wp-includes/css/dist/block-library/style.min.css?m=1774626871g | 15.1 KiB | 15.0 KiB |
Reduce unused JavaScript and defer loading scripts until they are required to decrease bytes consumed by network activity. Learn how to reduce unused JavaScript.
Multi-megabyte JavaScript bundles delay every interactive feature on the page.
This is the Lighthouse audit fired when too much JS is shipped relative to what executes. The fix isn't a config flag — it requires bundle analysis (webpack-bundle-analyzer, rollup-plugin-visualizer), splitting routes into chunks, lazy-loading off-screen components, and removing unused dependencies. Fundamentally different from minification: minifying reduces byte count, this reduces what's downloaded at all.
Source: Google web.dev / Lighthouse
| URL | Transfer Size | Est Savings |
|---|---|---|
| /p/323954724/connatix.player.js?cid=1ffe63de-eb53-11e9-b4... | 138.5 KiB | 94.7 KiB |
| ads.blogherads.com/static/chunks/5273.eec6f62e6c9beefc4be4.js | 108.2 KiB | 87.1 KiB |
| cdn.tinypass.com/api/tinypass.min.js | 132.1 KiB | 82.5 KiB |
| www.googletagmanager.com/gtag/js?id=G-4ZF0QC8G81&ver=6.7.5 | 168.9 KiB | 68.8 KiB |
| www.googletagmanager.com/gtm.js?id=GTM-NSR5BCK | 130.4 KiB | 65.9 KiB |
| connect.facebook.net/en_US/bundle/sdk.js/ | 78.4 KiB | 54.4 KiB |
| ads.blogherads.com/static/chunks/3622.7d0e84ccad5146cd86e6.js | 43.1 KiB | 35.5 KiB |
| pagead2.googlesyndication.com/pagead/js/adsbygoogle.js | 54.1 KiB | 35.0 KiB |
| ads.blogherads.com/static/chunks/831.b113b40433677910de75.js | 31.1 KiB | 25.2 KiB |
Large network payloads cost users real money and are highly correlated with long load times. Learn how to reduce payload sizes.
Performance issues directly impact user engagement and conversion rates.
More information about the performance of your application. These numbers don't directly affect the Performance score.
These checks highlight opportunities to improve the accessibility of your web app. Automatic detection can only detect a subset of issues and does not guarantee the accessibility of your web app, so manual testing is also encouraged.
Low-contrast text is difficult or impossible for many users to read. Learn how to provide sufficient color contrast.
Performance issues directly impact user engagement and conversion rates.
| Failing Elements |
|---|
SHOP NOW div.gtm-sub-container > div.gtm-content > div > a.button |
SUBSCRIBE div.gtm-sub-container > div.gtm-content > div > a.button |
These are opportunities to improve the legibility of your content.
Screen reader users rely on frame titles to describe the contents of frames. Learn more about frame titles.
Performance issues directly impact user engagement and conversion rates.
| Failing Elements |
|---|
section.sectioner > div.footer-rr1_container > div.footer-rr1_video > iframe section.sectioner > div.footer-rr1_container > div.footer-rr1_video > iframe |
These are opportunities to improve the semantics of the controls in your application. This may enhance the experience for users of assistive technology, like a screen reader.
Properly ordered headings that do not skip levels convey the semantic structure of the page, making it easier to navigate and understand when using assistive technologies. Learn more about heading order.
Performance issues directly impact user engagement and conversion rates.
| Failing Elements |
|---|
SUBSCRIBE header > div.header-inner > a.header-inner__subscribe > h3.header-inner__subscribe--header |
These are opportunities to improve keyboard navigation in your application.
Disabling zooming is problematic for users with low vision who rely on screen magnification to properly see the contents of a web page. Learn more about the viewport meta tag.
Performance issues directly impact user engagement and conversion rates.
| Failing Elements |
|---|
head > meta head > meta |
These items highlight common accessibility best practices.
Image natural dimensions should be proportional to the display size and the pixel ratio to maximize image clarity. Learn how to provide responsive images.
Performance issues directly impact user engagement and conversion rates.
| URL | Displayed size | Actual size | Expected size | |
|---|---|---|---|---|
Children's lacrosse illustration article.editor-picks__primary-pick > div.featured-image > a > img.attachment-featured-image-980x551 | /wp-content/uploads/2026/04/RR_Child_Athletics_1.jpg?resi... | 1140 x 641 | 681 x 383 | 1140 x 641 |
Deprecated APIs will eventually be removed from the browser. Learn more about deprecated APIs.
Performance issues directly impact user engagement and conversion rates.
| Deprecation / Warning | Source |
|---|---|
| Topics | ads.blogherads.com/static/chunks/3622.7d0e84ccad5146cd86e6.js line 1, col 55741 |
Errors logged to the console indicate unresolved problems. They can come from network request failures and other browser concerns. Learn more about this errors in console diagnostic audit
Performance issues directly impact user engagement and conversion rates.
| Source | Description |
|---|---|
ads.blogherads.com/static/chunks/5273.eec6f62e6c9beefc4be4.js line 1, col 288164 | %cP%cM%cC Atlas MG padding: 2px 1px 2px 10px; border-radius: 7px 0 0 7px; background-color: black; color: white; padding: 2px 1px; background-color: black; color: #ed1c24; padding: 2px 10px 2px 1px; border-radius: 0 7px 7px 0; background-color: black; color: white; Error: Time to wait for consent has expired.
at s (https://ads.blogherads.com/static/chunks/5273.eec6f62e6c9beefc4be4.js:2:106729)
at Y (<anonymous>:1:2216) |
/wp-content/themes/pmc-robbreport-2017-v2/assets/build/js... line 1, col 45830 | ReferenceError: WebFont is not defined
at Object.load (https://robbreport.com/wp-content/themes/pmc-robbreport-2017-v2/assets/build/js/common.js?ver=1765796790:2:45831)
at https://robbreport.com/wp-content/themes/pmc-robbreport-2017-v2/assets/build/js/common.js?ver=1765796790:2:45754
at Y (<anonymous>:1:2216) |
These checks ensure that your page is following basic search engine optimization advice. There are many additional factors Lighthouse does not score here that may affect your search ranking, including performance on Core Web Vitals. Learn more about Google Search Essentials.
Send Feedback