Netherlands · Amsterdam Completed: Apr 16, 2026 17:18 UTC
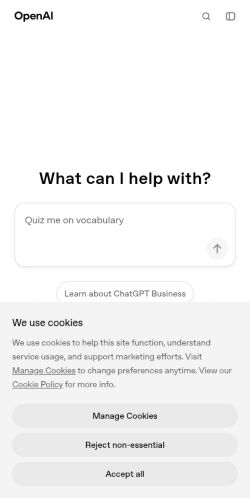
Mobile 375 × 812
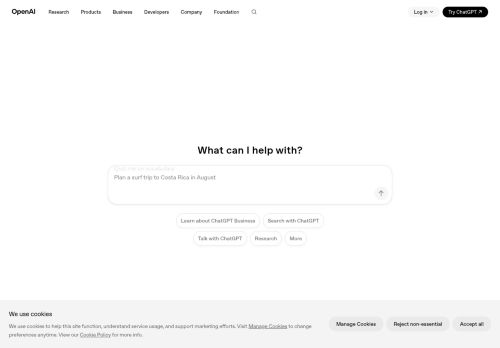
Desktop 1440 × 900
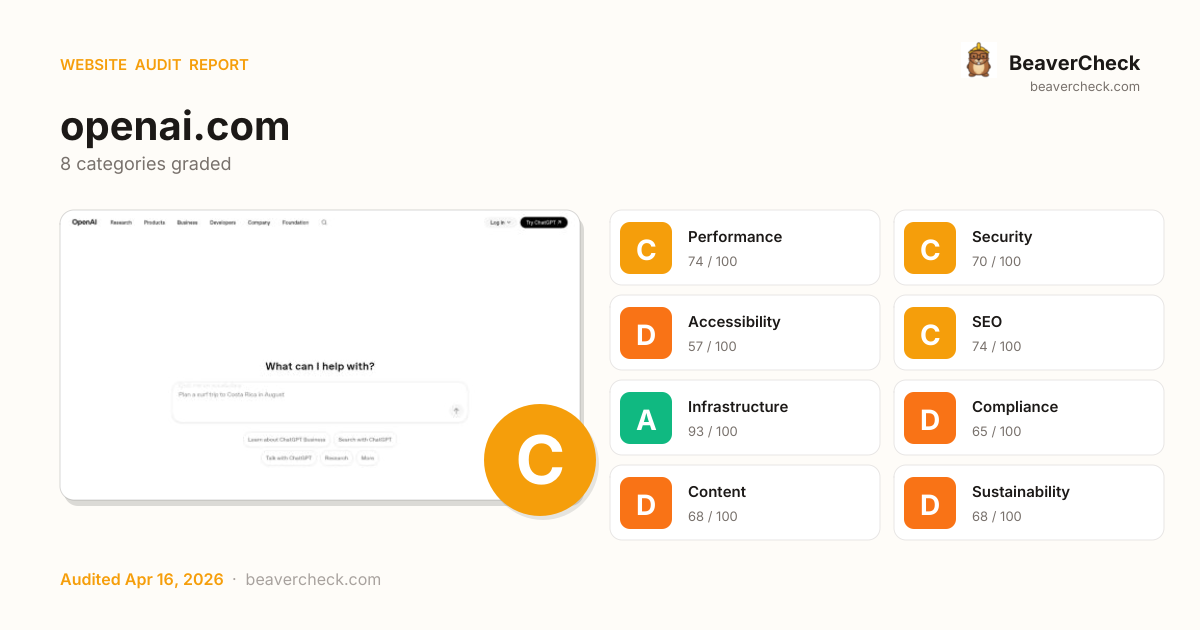
Score: 71 / 100
Based on 8 categories, 0 sections
Decent speed, but optimizing further could improve engagement.
Good foundation, but a few gaps could be exploited.
Several issues make your site difficult for assistive technology users.
Solid SEO basics — a few optimizations could boost rankings.
Solid infrastructure — fast server responses across the board.
Several regulatory requirements are not yet met.
Missing metadata means poor previews on social media and search.
Heavier than average — reducing page weight saves energy and bandwidth.
The overall score is a weighted average of individual category scores. Categories with more impact on user experience and security carry more weight.
Weights reflect general web best practices. Individual needs may differ.
'unsafe-eval' found in script source
Security gaps expose your site and users to attacks, eroding trust.
'unsafe-inline' found in script source
Security gaps expose your site and users to attacks, eroding trust.
Cookie 'country' is missing the Secure flag
Security gaps expose your site and users to attacks, eroding trust.
Cookie 'locale' is missing the Secure flag
Security gaps expose your site and users to attacks, eroding trust.
Cookie 'oai-did' is missing the Secure flag
Security gaps expose your site and users to attacks, eroding trust.
High impact, low effort — start here.
High impact, requires investment.
Nothing in this quadrant — good news.
Small gains, minimal effort.
Nothing in this quadrant — good news.
Low impact, high effort — do last.
Nothing in this quadrant — good news.
[](https://beavercheck.com/results/660d8c5e-3b88-4564-930a-91985c5e0e51)<a href="https://beavercheck.com/results/660d8c5e-3b88-4564-930a-91985c5e0e51"><img src="https://beavercheck.com/badge?url=https%3A%2F%2Fopenai.com" alt="BeaverCheck Score"></a>https://beavercheck.com/badge?url=https%3A%2F%2Fopenai.comThis badge auto-updates with your latest scan result.
Your site performs reasonably well, but a few targeted fixes could meaningfully improve results. Addressing the critical issues below would have the most immediate impact on your user trust.
9 barrier(s) likely increasing bounce by ~38%.
Page takes 20.7s to load
+12% bounceUsers abandon at ~3s — you're 18.2s over the 2.5s threshold
Fix: Optimize render-blocking resources, preload the hero image, and compress images
Page feels frozen for 3.2s
+5% bounceClicks on the primary CTA are ignored while JavaScript runs
Fix: Break up long tasks; defer non-critical JavaScript to post-hydration
No Content-Security-Policy header
+1% bounceHigher XSS blast radius — one compromised script can exfiltrate the checkout form
Fix: Ship a reporting-only CSP first, then enforce once violations are clean
No viewport meta tag
+15% bounceMobile browsers render at desktop width and shrink — text unreadable, tap targets miniature
Fix: Add <meta name="viewport" content="width=device-width, initial-scale=1">
No Open Graph tags
+2% bounceLinks shared on LinkedIn / Slack / Facebook show bare URLs — referral clicks drop
Fix: Add og:title, og:description, og:image, og:url to the page head
No structured data
+2% bounceNo rich-result eligibility in Google — lower SERP CTR vs competitors with stars and prices
Fix: Add JSON-LD for your page type (Product, Article, FAQPage, LocalBusiness, …)
Thin content
+3% bounceUnder 300 words — visitors bounce looking for substance, search engines rank competitors first
Fix: Add a substantive FAQ, product detail, or case-study section
Content is hard to read
+2% bounceGraduate-level reading difficulty — limits the addressable audience for product or blog pages
Fix: Shorten sentences; replace jargon with plain language; target Flesch ease ≥60
No skip-to-content link
+1% bounceKeyboard and screen-reader users must tab through the entire header on every page
Fix: Add a visible-on-focus <a href="#main">Skip to content</a> as the first focusable element
Preliminary CRO audit — each barrier links to the tab with detailed analysis.
$250 investment → $0.89/month returns + USD 157,500 risk avoided
$250
2h · 5 findings
$0.89 /mo
~$11 / year
USD 157,500
if kept compliant
Figures combine localized regulatory fine ceilings, search/conversion value priced against local CPC, and bandwidth waste estimates. Results depend on implementation quality and audience composition. Not legal or financial advice.
2.5 developer hours at $100/hr
Based on United States rates ($100/hr)
Start here for the best return on investment
$13,126 / month at risk
~$157,511 / year if left unfixed
$157,500
+6 more
$0.89 /mo
11088.7 MB/mo × 0.080 USD/GB
Compliance figures represent the statutory maximum fine for the most severe triggered category, capped per regulation — not the sum of per-finding penalties. Based on published regulatory fine ranges. This is not legal advice.
Unique monthly visitors from your analytics
Purchases, signups, or key actions
Optional — for revenue estimation
more engaged visitors from reduced bounce
Fix 5 critical issues to capture this value
Based on Google/Deloitte research ("Milliseconds Make Millions") showing a ~7% bounce rate increase per additional second of LCP above the 2.5s "Good" threshold.
Your site's LCP: → estimated after fixes.
These are estimates based on industry research — actual results vary
Your data stays in your browser — nothing is sent to our servers
Thanks for your feedback!
We'll use a cached audit if available, or offer to scan.
Industry-standard audits powered by Google Lighthouse.
Key metrics that affect user experience.
First Contentful Paint First Contentful Paint — how long until the browser renders the first piece of content. Under 1.8s is good.
4.37 s
Largest Contentful Paint Largest Contentful Paint — how long until the largest visible element loads. Under 2.5s is good.
20.67 s
Total Blocking Time Total Blocking Time — total time the main thread was blocked, preventing user input. Under 200ms is good.
3.20 s
Cumulative Layout Shift Cumulative Layout Shift — measures visual stability. How much the page layout shifts during loading. Under 0.1 is good.
0.000
Speed Index Speed Index — how quickly content is visually displayed during load. Under 3.4s is good.
8.01 s
Time to Interactive Time to Interactive — how long until the page is fully interactive and responds to user input. Under 3.8s is good.
21.77 s
Audit breakdown by category with detailed findings.
Remove large, duplicate JavaScript modules from bundles to reduce unnecessary bytes consumed by network activity.
Performance issues directly impact user engagement and conversion rates.
Polyfills and transforms enable older browsers to use new JavaScript features. However, many aren't necessary for modern browsers. Consider modifying your JavaScript build process to not transpile Baseline features, unless you know you must support older browsers. Learn why most sites can deploy ES6+ code without transpiling
Shipping ES5 transpiled code to modern browsers wastes bytes — every user with an evergreen browser pays for compatibility you don't need.
Most users today run browsers that natively support ES6+, async/await, optional chaining, and the rest of modern JavaScript. Transpiling to ES5 'just in case' adds 20-40% to your bundle for no benefit. Configure your build to target a modern browserslist, or ship a differential bundle pair (modern + legacy) with the module/nomodule pattern.
Source: Google web.dev / Lighthouse
3rd party code can significantly impact load performance. Reduce and defer loading of 3rd party code to prioritize your page's content.
Performance issues directly impact user engagement and conversion rates.
A forced reflow occurs when JavaScript queries geometric properties (such as offsetWidth) after styles have been invalidated by a change to the DOM state. This can result in poor performance. Learn more about forced reflows and possible mitigations.
Performance issues directly impact user engagement and conversion rates.
Each subpart has specific improvement strategies. Ideally, most of the LCP time should be spent on loading the resources, not within delays.
Performance issues directly impact user engagement and conversion rates.
Avoid chaining critical requests by reducing the length of chains, reducing the download size of resources, or deferring the download of unnecessary resources to improve page load.
Performance issues directly impact user engagement and conversion rates.
Requests are blocking the page's initial render, which may delay LCP. Deferring or inlining can move these network requests out of the critical path.
Performance issues directly impact user engagement and conversion rates.
A long cache lifetime can speed up repeat visits to your page. Learn more about caching.
Performance issues directly impact user engagement and conversion rates.
| Request | Cache TTL | Transfer Size |
|---|---|---|
| openai.com/cdn-cgi/challenge-platform/h/g/scripts/jsd/b0a7532ac8ec/main.js? | 14400.0 s | 12.4 KiB |
| static.cloudflareinsights.com/beacon.min.js | 86400.0 s | 10.7 KiB |
Reducing the download time of images can improve the perceived load time of the page and LCP. Learn more about optimizing image size
Performance issues directly impact user engagement and conversion rates.
| URL | Resource Size | Est Savings | |
|---|---|---|---|
1 1 div.relative > div.size-full > div.group > img.object-cover | /kftzwdyauwt9/6eaq9qftNBJJjryJnZGVRj/991b778132f449626fb9... | 42.1 KiB | 38.8 KiB |
oai Blog Codex Security Art Card 1x1 div.relative > div.size-full > div.group > img.object-cover | /kftzwdyauwt9/5BrJdBcEkCtafmi26Ib87o/594a2f25a92633451971... | 20.9 KiB | 19.3 KiB |
Learning Blocks ArtCard 1x1 div.relative > div.size-full > div.group > img.object-cover | /kftzwdyauwt9/91H3WwMZWgZwhG890LVLR/b3da0d856865e08c37d78... | 15.0 KiB | 13.8 KiB |
Amazon > Card div.relative > div.size-full > div.group > img.object-cover | /kftzwdyauwt9/KnGPrCMI6RRSrpeLqMi5G/7cf83bc7e73df70949e3f... | 14.5 KiB | 13.4 KiB |
These insights are also available in the Chrome DevTools Performance Panel - record a trace to view more detailed information.
Time to Interactive is the amount of time it takes for the page to become fully interactive. Learn more about the Time to Interactive metric.
Performance issues directly impact user engagement and conversion rates.
The maximum potential First Input Delay that your users could experience is the duration of the longest task. Learn more about the Maximum Potential First Input Delay metric.
Performance issues directly impact user engagement and conversion rates.
Reduce unused JavaScript and defer loading scripts until they are required to decrease bytes consumed by network activity. Learn how to reduce unused JavaScript.
Multi-megabyte JavaScript bundles delay every interactive feature on the page.
This is the Lighthouse audit fired when too much JS is shipped relative to what executes. The fix isn't a config flag — it requires bundle analysis (webpack-bundle-analyzer, rollup-plugin-visualizer), splitting routes into chunks, lazy-loading off-screen components, and removing unused dependencies. Fundamentally different from minification: minifying reduces byte count, this reduces what's downloaded at all.
Source: Google web.dev / Lighthouse
Consider reducing the time spent parsing, compiling, and executing JS. You may find delivering smaller JS payloads helps with this. Learn how to reduce Javascript execution time.
Performance issues directly impact user engagement and conversion rates.
Consider reducing the time spent parsing, compiling and executing JS. You may find delivering smaller JS payloads helps with this. Learn how to minimize main-thread work
Performance issues directly impact user engagement and conversion rates.
| Category | Time Spent |
|---|---|
| Script Evaluation | 4.8 s |
| Script Parsing & Compilation | 1.9 s |
| Other | 1.7 s |
| Style & Layout | 946 ms |
| Parse HTML & CSS | 203 ms |
| Garbage Collection | 166 ms |
| Rendering | 63 ms |
Large network payloads cost users real money and are highly correlated with long load times. Learn how to reduce payload sizes.
Performance issues directly impact user engagement and conversion rates.
More information about the performance of your application. These numbers don't directly affect the Performance score.
These checks highlight opportunities to improve the accessibility of your web app. Automatic detection can only detect a subset of issues and does not guarantee the accessibility of your web app, so manual testing is also encouraged.
Visible text labels that do not match the accessible name can result in a confusing experience for screen reader users. Learn more about accessible names.
Performance issues directly impact user engagement and conversion rates.
| Failing Elements |
|---|
Introducing GPT-5.4
Product
16 min read div.mb-sm > div.px-sm > div.group > a#4D3r5oL4eZTje3tZF6NhfE |
Codex for (almost) everything
Product
5 min read div.px-sm > div.relative > div.group > a#5bQ1R03qOM7xWLSWlXT9R6 |
The next evolution of the Agents SDK
Product
5 min read div.px-sm > div.relative > div.group > a#3ffilEahAARsjx7Ez43BpR |
Update on the OpenAI Foundation
Company
3 min read div.px-sm > div.relative > div.group > a#2cp7NogxmNSfrgeeTZFDn8 |
Accelerating the next phase of AI
Company
Mar 31, 2026 div.max-w-container > div.group > div.group > a#6RvBi7O6laluCU3ymDSD5a |
New ways to learn math and science in ChatGPT
Product
Mar 10, 2026 div.max-w-container > div.group > div.group > a#1oFzgkBotkTowN8dPwIIhl |
Codex Security: now in research preview
Product
Mar 6, 2026 div.max-w-container > div.group > div.group > a#7gJt5XNwYeJTeQ5L6R9EjF |
Our agreement with the Department of War
Company
Feb 28, 2026 div.max-w-container > div.group > div.group > a#5WZo3y5jpNICAbzXEylFEG |
OpenAI and Amazon announce strategic partnership
Company
Feb 27, 2026 div.max-w-container > div.group > div.group > a#2og39hipbAUhN9b0uj3lqc |
Improving instruction hierarchy in frontier LLMs
Research
Mar 10, 2026 div.@md:gap-sm > div.mb-md > div.group > a#7wu3OuFrpcwEV70Zt9duNx |
Reasoning models struggle to control their chains of thought, and that’s good
… div.@md:gap-sm > div.mb-md > div.group > a#43f38h660XvWgjSvmdiqRP |
Extending single-minus amplitudes to gravitons
Research
Mar 4, 2026 div.@md:gap-sm > div.mb-md > div.group > a#1pFsNvcQVjGd11LEpMQ4T1 |
Gradient Labs gives every bank customer an AI account manager
B2B Story
Apr 1,… div.@md:gap-sm > div.mb-md > div.group > a#6nKM7pnc7VvuGFbnRZl1PB |
STADLER reshapes knowledge work at a 230-year-old company
B2B Story
Mar 27, 20… div.@md:gap-sm > div.mb-md > div.group > a#7EBTmPbaeuvLCMNz0Zbaye |
Rakuten fixes issues twice as fast with Codex
B2B Story
Mar 11, 2026 div.@md:gap-sm > div.mb-md > div.group > a#64hlvpwM49woI301TBA2XJ |
English
United States footer.mt-3xl > div.px-sm > div.relative > button#radix-_R_1tpdpsnpfivb_ |
Deprecated APIs will eventually be removed from the browser. Learn more about deprecated APIs.
Performance issues directly impact user engagement and conversion rates.
| Deprecation / Warning | Source |
|---|---|
| SharedStorage | |
| StorageType.persistent is deprecated. Please use standardized navigator.storage instead. | |
| Fledge |
Source maps translate minified code to the original source code. This helps developers debug in production. In addition, Lighthouse is able to provide further insights. Consider deploying source maps to take advantage of these benefits. Learn more about source maps.
Performance issues directly impact user engagement and conversion rates.
These checks ensure that your page is following basic search engine optimization advice. There are many additional factors Lighthouse does not score here that may affect your search ranking, including performance on Core Web Vitals. Learn more about Google Search Essentials.
Industry-standard audits powered by Google Lighthouse. — Desktop
Key metrics that affect user experience. — Desktop
First Contentful Paint First Contentful Paint — how long until the browser renders the first piece of content. Under 1.8s is good.
527 ms
Largest Contentful Paint Largest Contentful Paint — how long until the largest visible element loads. Under 2.5s is good.
4.32 s
Total Blocking Time Total Blocking Time — total time the main thread was blocked, preventing user input. Under 200ms is good.
374 ms
Cumulative Layout Shift Cumulative Layout Shift — measures visual stability. How much the page layout shifts during loading. Under 0.1 is good.
0.012
Speed Index Speed Index — how quickly content is visually displayed during load. Under 3.4s is good.
2.54 s
Time to Interactive Time to Interactive — how long until the page is fully interactive and responds to user input. Under 3.8s is good.
4.55 s
Audit breakdown by category with detailed findings.
Remove large, duplicate JavaScript modules from bundles to reduce unnecessary bytes consumed by network activity.
Performance issues directly impact user engagement and conversion rates.
Polyfills and transforms enable older browsers to use new JavaScript features. However, many aren't necessary for modern browsers. Consider modifying your JavaScript build process to not transpile Baseline features, unless you know you must support older browsers. Learn why most sites can deploy ES6+ code without transpiling
Shipping ES5 transpiled code to modern browsers wastes bytes — every user with an evergreen browser pays for compatibility you don't need.
Most users today run browsers that natively support ES6+, async/await, optional chaining, and the rest of modern JavaScript. Transpiling to ES5 'just in case' adds 20-40% to your bundle for no benefit. Configure your build to target a modern browserslist, or ship a differential bundle pair (modern + legacy) with the module/nomodule pattern.
Source: Google web.dev / Lighthouse
3rd party code can significantly impact load performance. Reduce and defer loading of 3rd party code to prioritize your page's content.
Performance issues directly impact user engagement and conversion rates.
A forced reflow occurs when JavaScript queries geometric properties (such as offsetWidth) after styles have been invalidated by a change to the DOM state. This can result in poor performance. Learn more about forced reflows and possible mitigations.
Performance issues directly impact user engagement and conversion rates.
Reducing the download time of images can improve the perceived load time of the page and LCP. Learn more about optimizing image size
Performance issues directly impact user engagement and conversion rates.
| URL | Resource Size | Est Savings | |
|---|---|---|---|
Amazon > Card div.relative > div.size-full > div.group > img.object-cover | /kftzwdyauwt9/KnGPrCMI6RRSrpeLqMi5G/7cf83bc7e73df70949e3f... | 219.4 KiB | 217.4 KiB |
Codex for (almost) everything div.relative > div.size-full > div.group > img.object-cover | /kftzwdyauwt9/43j1ZX6CngGKjpcH3BRoaI/7228fda8953bf27c0c3c... | 98.2 KiB | 95.8 KiB |
1 1 div.relative > div.size-full > div.group > img.object-cover | /kftzwdyauwt9/6eaq9qftNBJJjryJnZGVRj/991b778132f449626fb9... | 98.1 KiB | 95.4 KiB |
oai Blog Codex Security Art Card 1x1 div.relative > div.size-full > div.group > img.object-cover | /kftzwdyauwt9/5BrJdBcEkCtafmi26Ib87o/594a2f25a92633451971... | 95.9 KiB | 95.0 KiB |
A photograph of a woman using ChatGPT to help her work on a seed farm div.relative > div.size-full > div.group > img.object-cover | /kftzwdyauwt9/4oc0vUwW6AaVePuwbMDODo/e8d1ed43aaaa8caa8769... | 121.0 KiB | 93.3 KiB |
A photograph of a salvage yard that uses ChatGPT div.relative > div.size-full > div.group > img.object-cover | /kftzwdyauwt9/7FEtIL0cIrDdIW5XGc2tCq/edf96f04ca7406977a96... | 115.9 KiB | 88.1 KiB |
graviton paper release > card image div.relative > div.size-full > div.group > img.object-cover | /kftzwdyauwt9/6GCHLf07ktUKcPeuulBOzk/0eba07515452c739fabb... | 89.8 KiB | 85.7 KiB |
Frame div.relative > div.size-full > div.group > img.object-cover | /kftzwdyauwt9/29yAmY0mMXwbU6gyRiHvGC/31703597eda0dc723d88... | 66.0 KiB | 65.4 KiB |
Learning Blocks ArtCard 1x1 div.relative > div.size-full > div.group > img.object-cover | /kftzwdyauwt9/91H3WwMZWgZwhG890LVLR/b3da0d856865e08c37d78... | 59.0 KiB | 58.4 KiB |
OAIF Blogpost 1-1 div.relative > div.size-full > div.group > img.object-cover | /kftzwdyauwt9/1369NNwJ3NhwM2y2U04sNA/9fcdfefd2e19135ac2e0... | 46.2 KiB | 45.0 KiB |
Safety research the challenge > Cover Image div.relative > div.size-full > div.group > img.object-cover | /kftzwdyauwt9/1dWPvCSG0V25TAlDws6dGU/214b389f0862c168692c... | 45.6 KiB | 43.5 KiB |
A photograph of a family using ChatGPT to run their tamale shop div.relative > div.size-full > div.group > img.object-cover | /kftzwdyauwt9/6JmoE3YM1XGL5Bozqcgs0p/f523f6726472d1361815... | 50.2 KiB | 36.1 KiB |
our-agreement-with-the-department-of-war-1-1 div.relative > div.size-full > div.group > img.object-cover | /kftzwdyauwt9/1H3NKvKGj9aG4J3SFpBk3I/857ddd02725cc163f40d... | 28.3 KiB | 28.0 KiB |
Agents SDK Art Card 1080x1080 div.relative > div.size-full > div.group > img.object-cover | /kftzwdyauwt9/5TSaPxrSFnEbj3nQWfcSmY/661e54575d7318437e10... | 28.5 KiB | 27.8 KiB |
"" div.size-full > div.group > picture.relative > img.object-cover | /kftzwdyauwt9/261kYlzPT8cBKoynLi35ct/14e3cae5d20ab9349af9... | 31.1 KiB | 23.4 KiB |
CoT controllability > Cover Image div.relative > div.size-full > div.group > img.object-cover | /kftzwdyauwt9/7AkyH6nozJkoGaWK1VjBoj/adeeeeb93985405d4724... | 20.8 KiB | 19.9 KiB |
Each subpart has specific improvement strategies. Ideally, most of the LCP time should be spent on loading the resources, not within delays.
Performance issues directly impact user engagement and conversion rates.
Avoid chaining critical requests by reducing the length of chains, reducing the download size of resources, or deferring the download of unnecessary resources to improve page load.
Performance issues directly impact user engagement and conversion rates.
A long cache lifetime can speed up repeat visits to your page. Learn more about caching.
Performance issues directly impact user engagement and conversion rates.
| Request | Cache TTL | Transfer Size |
|---|---|---|
| openai.com/cdn-cgi/challenge-platform/h/g/scripts/jsd/b0a7532ac8ec/main.js? | 14400.0 s | 14.2 KiB |
| static.cloudflareinsights.com/beacon.min.js | 86400.0 s | 10.7 KiB |
Requests are blocking the page's initial render, which may delay LCP. Deferring or inlining can move these network requests out of the critical path.
Performance issues directly impact user engagement and conversion rates.
These insights are also available in the Chrome DevTools Performance Panel - record a trace to view more detailed information.
Time to Interactive is the amount of time it takes for the page to become fully interactive. Learn more about the Time to Interactive metric.
Performance issues directly impact user engagement and conversion rates.
The maximum potential First Input Delay that your users could experience is the duration of the longest task. Learn more about the Maximum Potential First Input Delay metric.
Performance issues directly impact user engagement and conversion rates.
Reduce unused JavaScript and defer loading scripts until they are required to decrease bytes consumed by network activity. Learn how to reduce unused JavaScript.
Multi-megabyte JavaScript bundles delay every interactive feature on the page.
This is the Lighthouse audit fired when too much JS is shipped relative to what executes. The fix isn't a config flag — it requires bundle analysis (webpack-bundle-analyzer, rollup-plugin-visualizer), splitting routes into chunks, lazy-loading off-screen components, and removing unused dependencies. Fundamentally different from minification: minifying reduces byte count, this reduces what's downloaded at all.
Source: Google web.dev / Lighthouse
Consider reducing the time spent parsing, compiling, and executing JS. You may find delivering smaller JS payloads helps with this. Learn how to reduce Javascript execution time.
Performance issues directly impact user engagement and conversion rates.
| URL | Total CPU Time | Script Evaluation | Script Parse |
|---|---|---|---|
| /_next/static/chunks/033fjs8zx9_0g.js?dpl=dpl_E9iMCfvk7bF... | 808 ms | 730 ms | 11 ms |
| Unattributable | 537 ms | 137 ms | 0.0 ms |
| openai.com/ | 445 ms | 48 ms | 24 ms |
| www.googletagmanager.com/gtag/js?id=G-8MYC5SEFJ1&cx=c>m=4e64f0&bs=ctrl | 129 ms | 106 ms | 22 ms |
| openai.com/cdn-cgi/challenge-platform/scripts/jsd/main.js | 119 ms | 110 ms | 1.9 ms |
| www.googletagmanager.com/gtm.js?id=GTM-KJ7QK4SN | 101 ms | 83 ms | 16 ms |
| /_next/static/chunks/07fsx~ixctd9k.js?dpl=dpl_E9iMCfvk7bF... | 85 ms | 1.9 ms | 28 ms |
| /_next/static/chunks/0la--9_9d72ga.js?dpl=dpl_E9iMCfvk7bF... | 68 ms | 42 ms | 5.6 ms |
Consider reducing the time spent parsing, compiling and executing JS. You may find delivering smaller JS payloads helps with this. Learn how to minimize main-thread work
Performance issues directly impact user engagement and conversion rates.
| Category | Time Spent |
|---|---|
| Script Evaluation | 1.3 s |
| Other | 493 ms |
| Script Parsing & Compilation | 487 ms |
| Style & Layout | 359 ms |
| Garbage Collection | 49 ms |
| Parse HTML & CSS | 40 ms |
| Rendering | 34 ms |
Large network payloads cost users real money and are highly correlated with long load times. Learn how to reduce payload sizes.
Performance issues directly impact user engagement and conversion rates.
More information about the performance of your application. These numbers don't directly affect the Performance score.
These checks highlight opportunities to improve the accessibility of your web app. Automatic detection can only detect a subset of issues and does not guarantee the accessibility of your web app, so manual testing is also encouraged.
Touch targets with sufficient size and spacing help users who may have difficulty targeting small controls to activate the targets. Learn more about touch targets.
Performance issues directly impact user engagement and conversion rates.
| Failing Elements |
|---|
Research menu nav.nav-desktop:mask-[linear-gradient(to_right,black,black_calc(100%-1.5rem),transparent)] > ul.[&:has(>li:hover)>li:not(:hover)>*]:text-primary-60 > li.group/desktop-nav-item > button.group/desktop-nav-menu-button |
Products menu nav.nav-desktop:mask-[linear-gradient(to_right,black,black_calc(100%-1.5rem),transparent)] > ul.[&:has(>li:hover)>li:not(:hover)>*]:text-primary-60 > li.group/desktop-nav-item > button.group/desktop-nav-menu-button |
Business menu nav.nav-desktop:mask-[linear-gradient(to_right,black,black_calc(100%-1.5rem),transparent)] > ul.[&:has(>li:hover)>li:not(:hover)>*]:text-primary-60 > li.group/desktop-nav-item > button.group/desktop-nav-menu-button |
Developers menu nav.nav-desktop:mask-[linear-gradient(to_right,black,black_calc(100%-1.5rem),transparent)] > ul.[&:has(>li:hover)>li:not(:hover)>*]:text-primary-60 > li.group/desktop-nav-item > button.group/desktop-nav-menu-button |
Company menu nav.nav-desktop:mask-[linear-gradient(to_right,black,black_calc(100%-1.5rem),transparent)] > ul.[&:has(>li:hover)>li:not(:hover)>*]:text-primary-60 > li.group/desktop-nav-item > button.group/desktop-nav-menu-button |
These items highlight common accessibility best practices.
Visible text labels that do not match the accessible name can result in a confusing experience for screen reader users. Learn more about accessible names.
Performance issues directly impact user engagement and conversion rates.
| Failing Elements |
|---|
Introducing GPT-5.4
Product
16 min read div.mb-sm > div.px-sm > div.group > a#4D3r5oL4eZTje3tZF6NhfE |
Codex for (almost) everything
Product
5 min read div.px-sm > div.relative > div.group > a#5bQ1R03qOM7xWLSWlXT9R6 |
The next evolution of the Agents SDK
Product
5 min read div.px-sm > div.relative > div.group > a#3ffilEahAARsjx7Ez43BpR |
Update on the OpenAI Foundation
Company
3 min read div.px-sm > div.relative > div.group > a#2cp7NogxmNSfrgeeTZFDn8 |
Accelerating the next phase of AI
Company
Mar 31, 2026 div.max-w-container > div.group > div.group > a#6RvBi7O6laluCU3ymDSD5a |
New ways to learn math and science in ChatGPT
Product
Mar 10, 2026 div.max-w-container > div.group > div.group > a#1oFzgkBotkTowN8dPwIIhl |
Codex Security: now in research preview
Product
Mar 6, 2026 div.max-w-container > div.group > div.group > a#7gJt5XNwYeJTeQ5L6R9EjF |
Our agreement with the Department of War
Company
Feb 28, 2026 div.max-w-container > div.group > div.group > a#5WZo3y5jpNICAbzXEylFEG |
OpenAI and Amazon announce strategic partnership
Company
Feb 27, 2026 div.max-w-container > div.group > div.group > a#2og39hipbAUhN9b0uj3lqc |
Improving instruction hierarchy in frontier LLMs
Research
Mar 10, 2026 div.@md:gap-sm > div.mb-md > div.group > a#7wu3OuFrpcwEV70Zt9duNx |
Reasoning models struggle to control their chains of thought, and that’s good
… div.@md:gap-sm > div.mb-md > div.group > a#43f38h660XvWgjSvmdiqRP |
Extending single-minus amplitudes to gravitons
Research
Mar 4, 2026 div.@md:gap-sm > div.mb-md > div.group > a#1pFsNvcQVjGd11LEpMQ4T1 |
Gradient Labs gives every bank customer an AI account manager
B2B Story
Apr 1,… div.@md:gap-sm > div.mb-md > div.group > a#6nKM7pnc7VvuGFbnRZl1PB |
STADLER reshapes knowledge work at a 230-year-old company
B2B Story
Mar 27, 20… div.@md:gap-sm > div.mb-md > div.group > a#7EBTmPbaeuvLCMNz0Zbaye |
Rakuten fixes issues twice as fast with Codex
B2B Story
Mar 11, 2026 div.@md:gap-sm > div.mb-md > div.group > a#64hlvpwM49woI301TBA2XJ |
English
United States footer.mt-3xl > div.px-sm > div.relative > button#radix-_R_1tpdpsnpfivb_ |
Deprecated APIs will eventually be removed from the browser. Learn more about deprecated APIs.
Performance issues directly impact user engagement and conversion rates.
| Deprecation / Warning | Source |
|---|---|
| SharedStorage | |
| StorageType.persistent is deprecated. Please use standardized navigator.storage instead. | |
| Fledge |
Source maps translate minified code to the original source code. This helps developers debug in production. In addition, Lighthouse is able to provide further insights. Consider deploying source maps to take advantage of these benefits. Learn more about source maps.
Performance issues directly impact user engagement and conversion rates.
These checks ensure that your page is following basic search engine optimization advice. There are many additional factors Lighthouse does not score here that may affect your search ranking, including performance on Core Web Vitals. Learn more about Google Search Essentials.
Send Feedback