Global Performance
6/6 locations ✓High global latency — average 832ms across 6 locations, fastest from Madrid (117ms), slowest from Amsterdam (1593ms). No CDN detected. 4 locations above the 500ms target.
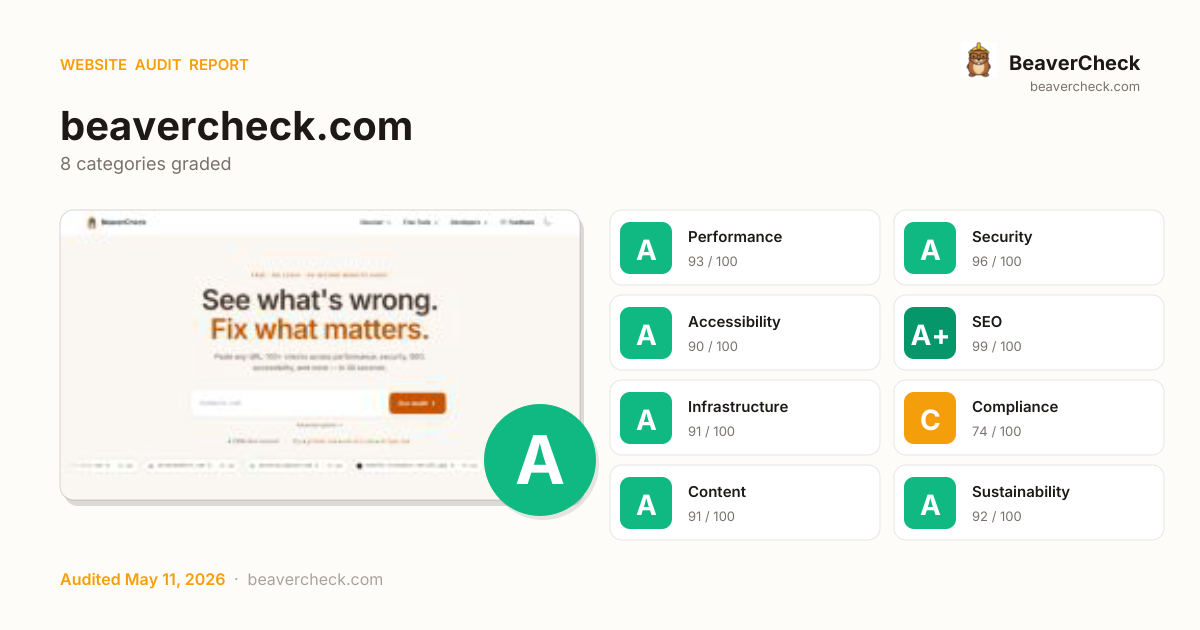
Audit overview
All categories sit comfortably above the 70 threshold; this is a clean audit.
Fix Priority Matrix
5 findingsQuick Wins
3High impact, low effort — start here.
Strategic
1High impact, requires investment.
Easy Improvements
1Small gains, minimal effort.
Deprioritize
0Low impact, high effort — do last.
Nothing in this quadrant — good news.
Screenshots

Top Priorities (5)
Unattributable: 271ms CPU time
Informational: CPU time spent on this resource. Total >1s is a perf budget violation.
https://beavercheck.com/: 343ms CPU time
Informational: CPU time spent on this resource. Total >1s is a perf budget violation.
24 text node(s) render below 12 CSS pixels on mobile
Mobile browsers default the root font-size to 16 px; text below ~ 12 px is hard to read without zooming. Affects readability + WCAG 1.4.4 (Resize Text) effort.
1 non-essential cookie(s) set without consent banner
Setting tracking cookies without a consent banner is the single most-fined GDPR violation in EU enforcement actions.
Registrar lock is NOT enabled
Without registrar lock, an attacker who phishes your registrar credentials can transfer the domain in minutes — total brand hijack.
Business case
What fixing the audit's findings is worth -- and what ignoring them keeps costing.
Return on investment
€407 investment → €0.20/month returns + EUR 120,000,000 risk avoided
Figures combine localized regulatory fine ceilings, search/conversion value priced against local CPC, and bandwidth waste estimates. Results depend on implementation quality and audience composition. Not legal or financial advice.
Conversion barriers
No conversion barriers detected.
Preliminary CRO audit — each barrier links to the tab with detailed analysis.
Remediation cost
Start here for the best return on investment
Cost by category
Cost by effort level
Adjust assumptions
Team composition
Multiplier applied to dev hours to reflect QA, design, and PM overhead. Use Dev only for solo work; Full team for projects with formal review processes.
Rates reflect fully-loaded developer cost including overhead
Warning:Cost of inaction
Compliance Risk
€120.000.000
- 1 non-essential cookie(s) set without consent bannerRGPD: EUR 5.000 – EUR 10.000.000
- 1 non-essential cookie(s) set without consent bannerRGPD: EUR 10.000 – EUR 20.000.000
- 1 non-essential cookie(s) set without consent bannerePrivacy Directive: EUR 5.000 – EUR 100.000.000
Bandwidth Waste
€0,20 /mo
2669.9 MB/mo × 0.074 EUR/GB
- Optimize transfer: save ~267 KB per page loadSaves €0,20/mo
Compliance figures represent the statutory maximum fine for the most severe triggered category, capped per regulation — not the sum of per-finding penalties. Based on published regulatory fine ranges. This is not legal advice.
Unique monthly visitors from your analytics
Purchases, signups, or key actions
Optional — for revenue estimation
more engaged visitors from reduced bounce
Fix 1 critical issues to capture this value
How this is calculated
Based on Google/Deloitte research ("Milliseconds Make Millions") showing a ~7% bounce rate increase per additional second of LCP above the 2.5s "Good" threshold.
Your site's LCP: → estimated after fixes.
These are estimates based on industry research — actual results vary
Your data stays in your browser — nothing is sent to our servers
Lighthouse
Mobile
First Contentful Paint First Contentful Paint — how long until the browser renders the first piece of content. Under 1.8s is good.
1.05 s
Largest Contentful Paint Largest Contentful Paint — how long until the largest visible element loads. Under 2.5s is good.
1.22 s
Total Blocking Time Total Blocking Time — total time the main thread was blocked, preventing user input. Under 200ms is good.
14 ms
Cumulative Layout Shift Cumulative Layout Shift — measures visual stability. How much the page layout shifts during loading. Under 0.1 is good.
0.037
Speed Index Speed Index — how quickly content is visually displayed during load. Under 3.4s is good.
1.05 s
Time to Interactive Time to Interactive — how long until the page is fully interactive and responds to user input. Under 3.8s is good.
1.97 s
Desktop
First Contentful Paint First Contentful Paint — how long until the browser renders the first piece of content. Under 1.8s is good.
294 ms
Largest Contentful Paint Largest Contentful Paint — how long until the largest visible element loads. Under 2.5s is good.
358 ms
Total Blocking Time Total Blocking Time — total time the main thread was blocked, preventing user input. Under 200ms is good.
0 ms
Cumulative Layout Shift Cumulative Layout Shift — measures visual stability. How much the page layout shifts during loading. Under 0.1 is good.
0.014
Speed Index Speed Index — how quickly content is visually displayed during load. Under 3.4s is good.
344 ms
Time to Interactive Time to Interactive — how long until the page is fully interactive and responds to user input. Under 3.8s is good.
358 ms
Categories
8Performance
Unattributable: 271ms CPU time
Security
All checks pass
Accessibility
24 text node(s) render below 12 CSS pixels on mobile
SEO
All checks pass
Infrastructure
Registrar lock is NOT enabled
Compliance
1 non-essential cookie(s) set without consent banner
Content
All checks pass
Sustainability
All checks pass
How you compare
Where this site stands against peers running the same stack.
Top 10% of Google Search Console sites score 85+ on Compliance; you're at 74 — closing this gap is the highest-leverage improvement.
Technology stack
Alpine.js 3.15.9, hosted on OVH, with Nginx CDN
Stack Architecture
 Alpine.js 3.15.9Google Search Console HSTS
  Htmx 2.0.8
 Open Graph
  Tailwind CSS
  Nginx
Nginx  OVH
OVH All Detected Technologies (8)
Nginx is a web server that can also be used as a reverse proxy, load balancer, mail proxy and HTTP cache.
Alpine.js is a minimal framework for composing behavior directly in your markup.
HTTP Strict Transport Security (HSTS) informs browsers that the site should only be accessed using HTTPS.
Htmx is a JavaScript library for performing AJAX requests, triggering CSS transitions, and invoking WebSocket and server-sent events directly from HTML elements.
Open Graph is a protocol that is used to integrate any web page into the social graph.
Observations (2)
No build tool detected
A framework (Alpine.js) was detected but no bundler was identified. The build tool may not be detectable from output patterns, or the site may use the framework's built-in bundler.
Complex technology stack detected
8 technologies identified. A complex stack increases maintenance burden and attack surface. Consider whether all components are actively needed.
Show your score
Drop this badge on your README, marketing site, or status page. It auto-updates every time the audit re-runs and links back to this report.
This badge auto-updates with your latest scan result.
[](https://beavercheck.com/results/6830ff3a-822c-480d-9437-06369accac04)<a href="https://beavercheck.com/results/6830ff3a-822c-480d-9437-06369accac04"><img src="https://beavercheck.com/badge?url=https%3A%2F%2Fbeavercheck.com" alt="BeaverCheck Score"></a>https://beavercheck.com/badge?url=https%3A%2F%2Fbeavercheck.comExport & share
Download the audit, share with your team, or grab a fix plan ready to copy into your tracker.
Copies markdown to clipboard
Fix Plan
Three-week roadmap to ship the audit's findings, with one-click copy targets for your tracker.
Three-week fix plan
2 sprints · 5h total → projected A (96)
Sprint 1: Quick Wins
+3Highest ROI — low effort, high impact
- · Unattributable: 271ms CPU time
- · https://beavercheck.com/: 343ms CPU time
- · Registrar lock is NOT enabled
- · 24 text node(s) render below 12 CSS pixels on mobile
Sprint 2: Core Fixes
+1Medium effort, high structural impact
- · 1 non-essential cookie(s) set without consent banner