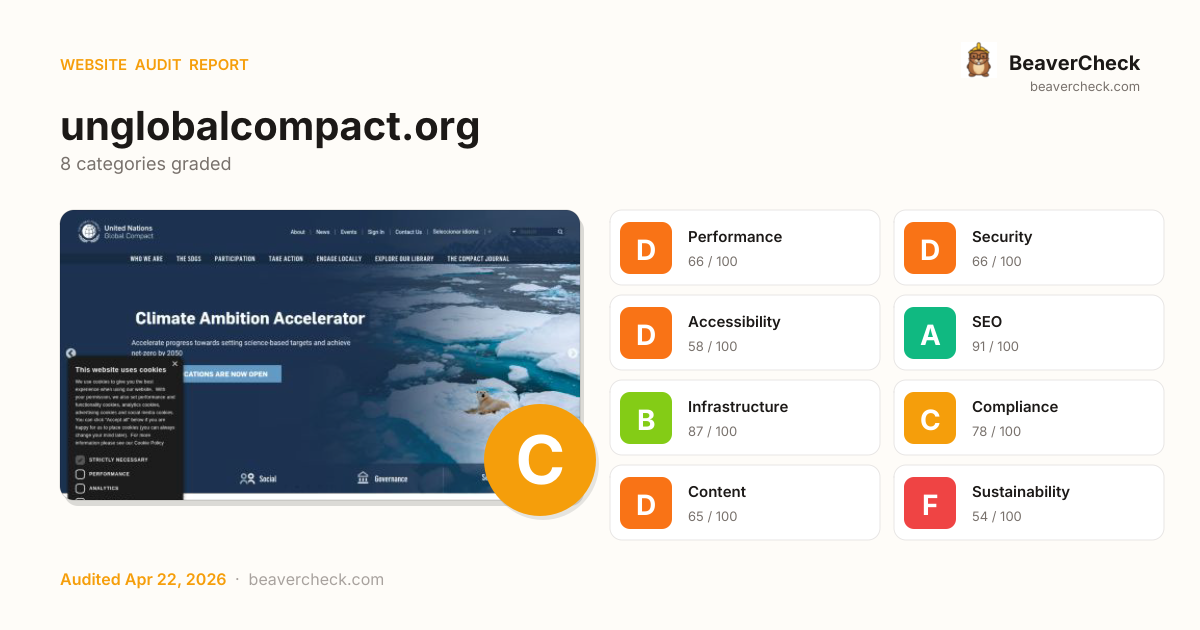
Mobile 375 × 812

Desktop 1440 × 900

Score: 70 / 100
Based on 8 categories, 0 sections
Room to improve — your 40.3s load time is above Google's 2.5s 'Good' threshold.
Several missing protections leave your users and data exposed.
Several issues make your site difficult for assistive technology users.
Well-optimized for search — your content is discoverable.
Solid infrastructure — fast server responses across the board.
Mostly compliant — a few items need attention.
Missing metadata means poor previews on social media and search.
Heavier than average — reducing page weight saves energy and bandwidth.
The overall score is a weighted average of individual category scores. Categories with more impact on user experience and security carry more weight.
Weights reflect general web best practices. Individual needs may differ.
Content-Security-Policy header is missing
Security gaps expose your site and users to attacks, eroding trust.
No Content-Security-Policy header found
Security gaps expose your site and users to attacks, eroding trust.
Page weighs 29.3 MB (20.6 MB transferred)
Performance issues directly impact user engagement and conversion rates.
5 control(s) without accessible label
Accessibility issues exclude users with disabilities — up to 15% of your potential audience.
/.htaccess is publicly accessible
Security gaps expose your site and users to attacks, eroding trust.
High impact, low effort — start here.
High impact, requires investment.
Small gains, minimal effort.
Nothing in this quadrant — good news.
Low impact, high effort — do last.
Nothing in this quadrant — good news.
[](https://beavercheck.com/results/6917d040-f842-4731-a7e1-4e5819839896)<a href="https://beavercheck.com/results/6917d040-f842-4731-a7e1-4e5819839896"><img src="https://beavercheck.com/badge?url=https%3A%2F%2Funglobalcompact.org" alt="BeaverCheck Score"></a>https://beavercheck.com/badge?url=https%3A%2F%2Funglobalcompact.orgThis badge auto-updates with your latest scan result.
Your site performs reasonably well, but a few targeted fixes could meaningfully improve results. Your LCP of 40.3s exceeds Google's 2.5s 'Good' threshold and the 1 performance issue below directly contributes to it. Accessibility issues exclude users who rely on assistive technology — an estimated 15% of your potential audience. Addressing the critical issues below would have the most immediate impact on your user trust.
10 barrier(s) likely increasing bounce by ~38%.
Page takes 40.3s to load
+12% bounceUsers abandon at ~3s — you're 37.8s over the 2.5s threshold
Fix: Optimize render-blocking resources, preload the hero image, and compress images
Page feels frozen for 2.1s
+5% bounceClicks on the primary CTA are ignored while JavaScript runs
Fix: Break up long tasks; defer non-critical JavaScript to post-hydration
No Content-Security-Policy header
+1% bounceHigher XSS blast radius — one compromised script can exfiltrate the checkout form
Fix: Ship a reporting-only CSP first, then enforce once violations are clean
Severe layout shift during page load
+6% bounceUsers mis-click when content jumps — converting intent into frustration
Fix: Reserve space for images, ads, and embeds with explicit width/height
5 form field(s) without a label
+6% bounceScreen readers skip unlabeled fields; autofill can't identify them; checkout abandonment spikes
Fix: Associate every input with a visible <label for="…">; add autocomplete attributes
No Open Graph tags
+2% bounceLinks shared on LinkedIn / Slack / Facebook show bare URLs — referral clicks drop
Fix: Add og:title, og:description, og:image, og:url to the page head
No structured data
+2% bounceNo rich-result eligibility in Google — lower SERP CTR vs competitors with stars and prices
Fix: Add JSON-LD for your page type (Product, Article, FAQPage, LocalBusiness, …)
Content is hard to read
+2% bounceGraduate-level reading difficulty — limits the addressable audience for product or blog pages
Fix: Shorten sentences; replace jargon with plain language; target Flesch ease ≥60
No skip-to-content link
+1% bounceKeyboard and screen-reader users must tab through the entire header on every page
Fix: Add a visible-on-focus <a href="#main">Skip to content</a> as the first focusable element
3 broken link(s) on the page
+5% bounceClicks land on 404s — trust drops and the session often ends
Fix: Fix or remove the broken destinations surfaced on the Content tab
Preliminary CRO audit — each barrier links to the tab with detailed analysis.
€425 investment → €4.80/month returns + EUR 500,000 risk avoided
€425
5h · 5 findings
€4.80 /mo
~€58 / year
EUR 500,000
if kept compliant
€128 — in quick wins — start here for the fastest payback
Figures combine localized regulatory fine ceilings, search/conversion value priced against local CPC, and bandwidth waste estimates. Results depend on implementation quality and audience composition. Not legal or financial advice.
5.0 developer hours at €85/hr
Based on European Union rates (€85/hr)
Start here for the best return on investment
€41,671 / month at risk
~€500,058 / year if left unfixed
€500,000
+1 more
€4.80 /mo
64852.1 MB/mo × 0.074 EUR/GB
Compliance figures represent the statutory maximum fine for the most severe triggered category, capped per regulation — not the sum of per-finding penalties. Based on published regulatory fine ranges. This is not legal advice.
Unique monthly visitors from your analytics
Purchases, signups, or key actions
Optional — for revenue estimation
more engaged visitors from reduced bounce
Fix 4 critical issues to capture this value
Based on Google/Deloitte research ("Milliseconds Make Millions") showing a ~7% bounce rate increase per additional second of LCP above the 2.5s "Good" threshold.
Your site's LCP: → estimated after fixes.
These are estimates based on industry research — actual results vary
Your data stays in your browser — nothing is sent to our servers
Thanks for your feedback!
We'll use a cached audit if available, or offer to scan.
Industry-standard audits powered by Google Lighthouse.
Key metrics that affect user experience.
First Contentful Paint First Contentful Paint — how long until the browser renders the first piece of content. Under 1.8s is good.
4.80 s
Largest Contentful Paint Largest Contentful Paint — how long until the largest visible element loads. Under 2.5s is good.
40.26 s
Total Blocking Time Total Blocking Time — total time the main thread was blocked, preventing user input. Under 200ms is good.
2.07 s
Cumulative Layout Shift Cumulative Layout Shift — measures visual stability. How much the page layout shifts during loading. Under 0.1 is good.
0.519
Speed Index Speed Index — how quickly content is visually displayed during load. Under 3.4s is good.
15.87 s
Time to Interactive Time to Interactive — how long until the page is fully interactive and responds to user input. Under 3.8s is good.
40.63 s
Audit breakdown by category with detailed findings.
Remove large, duplicate JavaScript modules from bundles to reduce unnecessary bytes consumed by network activity.
Performance issues directly impact user engagement and conversion rates.
Polyfills and transforms enable older browsers to use new JavaScript features. However, many aren't necessary for modern browsers. Consider modifying your JavaScript build process to not transpile Baseline features, unless you know you must support older browsers. Learn why most sites can deploy ES6+ code without transpiling
Shipping ES5 transpiled code to modern browsers wastes bytes — every user with an evergreen browser pays for compatibility you don't need.
Most users today run browsers that natively support ES6+, async/await, optional chaining, and the rest of modern JavaScript. Transpiling to ES5 'just in case' adds 20-40% to your bundle for no benefit. Configure your build to target a modern browserslist, or ship a differential bundle pair (modern + legacy) with the module/nomodule pattern.
Source: Google web.dev / Lighthouse
3rd party code can significantly impact load performance. Reduce and defer loading of 3rd party code to prioritize your page's content.
Performance issues directly impact user engagement and conversion rates.
A long cache lifetime can speed up repeat visits to your page. Learn more about caching.
Performance issues directly impact user engagement and conversion rates.
Layout shifts occur when elements move absent any user interaction. Investigate the causes of layout shifts, such as elements being added, removed, or their fonts changing as the page loads.
Performance issues directly impact user engagement and conversion rates.
Consider setting font-display to swap or optional to ensure text is consistently visible. swap can be further optimized to mitigate layout shifts with font metric overrides.
Performance issues directly impact user engagement and conversion rates.
A forced reflow occurs when JavaScript queries geometric properties (such as offsetWidth) after styles have been invalidated by a change to the DOM state. This can result in poor performance. Learn more about forced reflows and possible mitigations.
Performance issues directly impact user engagement and conversion rates.
Reducing the download time of images can improve the perceived load time of the page and LCP. Learn more about optimizing image size
Performance issues directly impact user engagement and conversion rates.
| URL | Resource Size | Est Savings | |
|---|---|---|---|
Real Companies. Real Action. Real Results.
Explore case studies showcasing how… div.slick-track > div.slick-slide > div > div.carousel-background | /uploads/dc/dc5ebe85d0ee85e548648ecb29333ad4e925067a---Su... | 5.4 MiB | 3.3 MiB |
Shape the Students who Shape the World
The future of business starts in the cl… div.slick-track > div.slick-slide > div > div.carousel-background | /uploads/73/73d60ae5278d9544c404590bb736bab552380aa7---PR... | 2.5 MiB | 2.1 MiB |
Our Impact
Fuchs Lubricants South Africa advances living wages through human r… div.slick-track > div.slick-slide > div > div.carousel-background | /uploads/5e/5ed4063638c3d2299ac1559b416f10e5937dec99---Im... | 1.7 MiB | 1.5 MiB |
CoP Data Visualization Tool
Access insights into the progress of UN Global Com… div.slick-track > div.slick-slide > div > div.carousel-background | /uploads/26/260671141f76c45ff71a58baed27f8f56d7be27f---Co... | 1.6 MiB | 1.4 MiB |
Climate Ambition Accelerator
Accelerate progress towards setting science-based… div.slick-track > div#slick-slide01 > div > div.carousel-background | /uploads/d3/d332e8d461f56e432f7ac06f528d4fc5fe914f68---Cl... | 1.2 MiB | 990.3 KiB |
Target Gender Equality Accelerator
Set and reach ambitious corporate targets f… div.slick-track > div.slick-slide > div > div.carousel-background | /uploads/cf/cf518b06ecd10dc69422f54bd7bf0da464ea5c72---Ta... | 1.1 MiB | 853.9 KiB |
Think Labs
Developing solutions vital to corporate sustainability challenges.
… main > section.tiles-section > article.tile > a | /uploads/d3/d33a8cb28f52a97bf93ee55274e28f7cde20a76e---Th... | 959.4 KiB | 851.6 KiB |
Accelerators
Embedding SDG-aligned practices into business operations and acce… main > section.tiles-section > article.tile > a | /uploads/2f/2f4b6579bf3b89db395ee7701f626e2327ea4845---UN... | 804.1 KiB | 696.3 KiB |
UN Global Compact Academy
Our digital platform will fast-track your sustainabi… main > section.tiles-section > article.tile > a | /uploads/e3/e3fe41ea76087af52bcb6dd832936cd843d8dfb3---UN... | 692.2 KiB | 584.4 KiB |
Communication on Progress
Understand your requirements and submit your CoP tod… main > section.tiles-section > article.tile > a | /uploads/c3/c30e6a157dbd44ff46705132e4adfd20c2071f95---Co... | 667.2 KiB | 559.4 KiB |
Peer Learning Groups
Driving collective impact by connecting sustainability pr… main > section.tiles-section > article.tile > a | /uploads/84/841a5566aaab5b3560e5318d8f39902a1a9a3f7d---UN... | 631.3 KiB | 523.5 KiB |
Peer Learning Groups
Connecting sustainability professionals to drive collecti… div.slick-track > div.slick-slide > div > div.carousel-background | /uploads/b9/b9ccf3491d89ad7cb10644c12da05e6be7c7ce61---Pe... | 787.9 KiB | 397.2 KiB |
Forward Faster initiative
Guiding companies on where they can make the biggest… main > section.tiles-section > article.tile > a | /uploads/8d/8dadae25afe4d2782f0fffc91a9f882d6cedf67f---UN... | 480.3 KiB | 372.5 KiB |
Optimize LCP by making the LCP image discoverable from the HTML immediately, and avoiding lazy-loading
Performance issues directly impact user engagement and conversion rates.
HTTP/2 and HTTP/3 offer many benefits over HTTP/1.1, such as multiplexing. Learn more about using modern HTTP.
Performance issues directly impact user engagement and conversion rates.
Avoid chaining critical requests by reducing the length of chains, reducing the download size of resources, or deferring the download of unnecessary resources to improve page load.
Performance issues directly impact user engagement and conversion rates.
Requests are blocking the page's initial render, which may delay LCP. Deferring or inlining can move these network requests out of the critical path.
Performance issues directly impact user engagement and conversion rates.
| URL | Transfer Size | Duration |
|---|---|---|
| /assets/gems-81dc831519d94a2c517222a86f43f9dc1c73469ff268... | 352.3 KiB | 3.2 s |
| js.stripe.com/v2/ | 21.0 KiB | 1.1 s |
| /assets/application-b2f8dd9bfd23230811d2e2c4650182ea76768... | 41.4 KiB | 1.5 s |
Your first network request is the most important. Reduce its latency by avoiding redirects, ensuring a fast server response, and enabling text compression.
Performance issues directly impact user engagement and conversion rates.
These insights are also available in the Chrome DevTools Performance Panel - record a trace to view more detailed information.
Time to Interactive is the amount of time it takes for the page to become fully interactive. Learn more about the Time to Interactive metric.
Performance issues directly impact user engagement and conversion rates.
These are the largest layout shifts observed on the page. Each table item represents a single layout shift, and shows the element that shifted the most. Below each item are possible root causes that led to the layout shift. Some of these layout shifts may not be included in the CLS metric value due to windowing. Learn how to improve CLS
Performance issues directly impact user engagement and conversion rates.
| Element | Layout shift score |
|---|---|
25,493
PARTICIPANTS
167
COUNTRIES
64
COUNTRY NETWORKS body > main > section.stats-section > div.wrapper | 0.519 |
The maximum potential First Input Delay that your users could experience is the duration of the longest task. Learn more about the Maximum Potential First Input Delay metric.
Performance issues directly impact user engagement and conversion rates.
Minifying JavaScript files can reduce payload sizes and script parse time. Learn how to minify JavaScript.
Performance issues directly impact user engagement and conversion rates.
| URL | Transfer Size | Est Savings |
|---|---|---|
| /assets/gems-81dc831519d94a2c517222a86f43f9dc1c73469ff268... | 350.8 KiB | 118.6 KiB |
| /assets/turbo-3065a6a03744a1e8b35515434791174d8569e8d242f... | 38.6 KiB | 7.7 KiB |
Reduce unused rules from stylesheets and defer CSS not used for above-the-fold content to decrease bytes consumed by network activity. Learn how to reduce unused CSS.
Performance issues directly impact user engagement and conversion rates.
| URL | Transfer Size | Est Savings |
|---|---|---|
| /assets/application-b2f8dd9bfd23230811d2e2c4650182ea76768... | 39.9 KiB | 37.4 KiB |
Reduce unused JavaScript and defer loading scripts until they are required to decrease bytes consumed by network activity. Learn how to reduce unused JavaScript.
Multi-megabyte JavaScript bundles delay every interactive feature on the page.
This is the Lighthouse audit fired when too much JS is shipped relative to what executes. The fix isn't a config flag — it requires bundle analysis (webpack-bundle-analyzer, rollup-plugin-visualizer), splitting routes into chunks, lazy-loading off-screen components, and removing unused dependencies. Fundamentally different from minification: minifying reduces byte count, this reduces what's downloaded at all.
Source: Google web.dev / Lighthouse
Consider reducing the time spent parsing, compiling, and executing JS. You may find delivering smaller JS payloads helps with this. Learn how to reduce Javascript execution time.
Performance issues directly impact user engagement and conversion rates.
Consider reducing the time spent parsing, compiling and executing JS. You may find delivering smaller JS payloads helps with this. Learn how to minimize main-thread work
Performance issues directly impact user engagement and conversion rates.
| Category | Time Spent |
|---|---|
| Script Evaluation | 4.8 s |
| Other | 4.2 s |
| Style & Layout | 1.6 s |
| Rendering | 1.3 s |
| Script Parsing & Compilation | 1.2 s |
| Garbage Collection | 163 ms |
| Parse HTML & CSS | 140 ms |
Large network payloads cost users real money and are highly correlated with long load times. Learn how to reduce payload sizes.
Performance issues directly impact user engagement and conversion rates.
Set an explicit width and height on image elements to reduce layout shifts and improve CLS. Learn how to set image dimensions
Performance issues directly impact user engagement and conversion rates.
| URL | |
|---|---|
United Nations Global Compact div.header-top > a.logo > h1 > img | /assets/ungc_masterbrand_solid_white-7afbb29ddd9ad8039677... |
More information about the performance of your application. These numbers don't directly affect the Performance score.
These checks highlight opportunities to improve the accessibility of your web app. Automatic detection can only detect a subset of issues and does not guarantee the accessibility of your web app, so manual testing is also encouraged.
Low-contrast text is difficult or impossible for many users to read. Learn how to provide sufficient color contrast.
Performance issues directly impact user engagement and conversion rates.
| Failing Elements |
|---|
EVENTS div.tabbed-component > menu.tabs > li.tab > button |
All News div.tabbed-component > article.tab-content > footer.events-component-footer > a |
ACCEPT ALL div#cookiescript_injected_wrapper > div#cookiescript_injected > div#cookiescript_buttons > div#cookiescript_accept |
These are opportunities to improve the legibility of your content.
Screen reader users rely on frame titles to describe the contents of frames. Learn more about frame titles.
Performance issues directly impact user engagement and conversion rates.
| Failing Elements |
|---|
section.events-news-component > div.tabbed-component > article.tab-content > iframe#iFrameResizer0 section.events-news-component > div.tabbed-component > article.tab-content > iframe#iFrameResizer0 |
These are opportunities to improve the semantics of the controls in your application. This may enhance the experience for users of assistive technology, like a screen reader.
If a page doesn't specify a `lang` attribute, a screen reader assumes that the page is in the default language that the user chose when setting up the screen reader. If the page isn't actually in the default language, then the screen reader might not announce the page's text correctly. Learn more about the `lang` attribute.
Performance issues directly impact user engagement and conversion rates.
| Failing Elements |
|---|
html html |
These are opportunities to improve the interpretation of your content by users in different locales.
Touch targets with sufficient size and spacing help users who may have difficulty targeting small controls to activate the targets. Learn more about touch targets.
Performance issues directly impact user engagement and conversion rates.
| Failing Elements |
|---|
United Nations div.wrapper > ul.colophon > li > a |
Privacy Policy div.wrapper > ul.colophon > li > a |
Cookies Policy div.wrapper > ul.colophon > li > a |
These items highlight common accessibility best practices.
Deprecated APIs will eventually be removed from the browser. Learn more about deprecated APIs.
Performance issues directly impact user engagement and conversion rates.
| Deprecation / Warning | Source |
|---|---|
| AttributionReporting |
Errors logged to the console indicate unresolved problems. They can come from network request failures and other browser concerns. Learn more about this errors in console diagnostic audit
Performance issues directly impact user engagement and conversion rates.
| Source | Description |
|---|---|
Failed to load resource: the server responded with a status of 451 () | |
Failed to load resource: the server responded with a status of 451 () |
These checks ensure that your page is following basic search engine optimization advice. There are many additional factors Lighthouse does not score here that may affect your search ranking, including performance on Core Web Vitals. Learn more about Google Search Essentials.
Descriptive link text helps search engines understand your content. Learn how to make links more accessible.
Performance issues directly impact user engagement and conversion rates.
| Link destination | Link Text |
|---|---|
| /compactjournal/fuchs-lubricants-south-africa-advances-li... | READ MORE |
| /compactjournal/fuchs-lubricants-south-africa-advances-li... | READ MORE |
Format your HTML in a way that enables crawlers to better understand your app’s content.
Industry-standard audits powered by Google Lighthouse. — Desktop
Key metrics that affect user experience. — Desktop
First Contentful Paint First Contentful Paint — how long until the browser renders the first piece of content. Under 1.8s is good.
1.36 s
Largest Contentful Paint Largest Contentful Paint — how long until the largest visible element loads. Under 2.5s is good.
8.70 s
Total Blocking Time Total Blocking Time — total time the main thread was blocked, preventing user input. Under 200ms is good.
120 ms
Cumulative Layout Shift Cumulative Layout Shift — measures visual stability. How much the page layout shifts during loading. Under 0.1 is good.
0.342
Speed Index Speed Index — how quickly content is visually displayed during load. Under 3.4s is good.
3.87 s
Time to Interactive Time to Interactive — how long until the page is fully interactive and responds to user input. Under 3.8s is good.
8.77 s
Audit breakdown by category with detailed findings.
Remove large, duplicate JavaScript modules from bundles to reduce unnecessary bytes consumed by network activity.
Performance issues directly impact user engagement and conversion rates.
Polyfills and transforms enable older browsers to use new JavaScript features. However, many aren't necessary for modern browsers. Consider modifying your JavaScript build process to not transpile Baseline features, unless you know you must support older browsers. Learn why most sites can deploy ES6+ code without transpiling
Shipping ES5 transpiled code to modern browsers wastes bytes — every user with an evergreen browser pays for compatibility you don't need.
Most users today run browsers that natively support ES6+, async/await, optional chaining, and the rest of modern JavaScript. Transpiling to ES5 'just in case' adds 20-40% to your bundle for no benefit. Configure your build to target a modern browserslist, or ship a differential bundle pair (modern + legacy) with the module/nomodule pattern.
Source: Google web.dev / Lighthouse
3rd party code can significantly impact load performance. Reduce and defer loading of 3rd party code to prioritize your page's content.
Performance issues directly impact user engagement and conversion rates.
A long cache lifetime can speed up repeat visits to your page. Learn more about caching.
Performance issues directly impact user engagement and conversion rates.
Layout shifts occur when elements move absent any user interaction. Investigate the causes of layout shifts, such as elements being added, removed, or their fonts changing as the page loads.
Performance issues directly impact user engagement and conversion rates.
Consider setting font-display to swap or optional to ensure text is consistently visible. swap can be further optimized to mitigate layout shifts with font metric overrides.
Performance issues directly impact user engagement and conversion rates.
A forced reflow occurs when JavaScript queries geometric properties (such as offsetWidth) after styles have been invalidated by a change to the DOM state. This can result in poor performance. Learn more about forced reflows and possible mitigations.
Performance issues directly impact user engagement and conversion rates.
Reducing the download time of images can improve the perceived load time of the page and LCP. Learn more about optimizing image size
Performance issues directly impact user engagement and conversion rates.
| URL | Resource Size | Est Savings | |
|---|---|---|---|
Real Companies. Real Action. Real Results.
Explore case studies showcasing how… div.slick-track > div.slick-slide > div > div.carousel-background | /uploads/dc/dc5ebe85d0ee85e548648ecb29333ad4e925067a---Su... | 5.4 MiB | 3.3 MiB |
Shape the Students who Shape the World
The future of business starts in the cl… div.slick-track > div.slick-slide > div > div.carousel-background | /uploads/73/73d60ae5278d9544c404590bb736bab552380aa7---PR... | 2.5 MiB | 2.1 MiB |
Our Impact
Fuchs Lubricants South Africa advances living wages through human r… div.slick-track > div.slick-slide > div > div.carousel-background | /uploads/5e/5ed4063638c3d2299ac1559b416f10e5937dec99---Im... | 1.7 MiB | 1.5 MiB |
CoP Data Visualization Tool
Access insights into the progress of UN Global Com… div.slick-track > div.slick-slide > div > div.carousel-background | /uploads/26/260671141f76c45ff71a58baed27f8f56d7be27f---Co... | 1.6 MiB | 1.4 MiB |
Climate Ambition Accelerator
Accelerate progress towards setting science-based… div.slick-track > div.slick-slide > div > div.carousel-background | /uploads/d3/d332e8d461f56e432f7ac06f528d4fc5fe914f68---Cl... | 1.2 MiB | 990.3 KiB |
Target Gender Equality Accelerator
Set and reach ambitious corporate targets f… div.slick-track > div.slick-slide > div > div.carousel-background | /uploads/cf/cf518b06ecd10dc69422f54bd7bf0da464ea5c72---Ta... | 1.1 MiB | 853.9 KiB |
Think Labs
Developing solutions vital to corporate sustainability challenges.
… main > section.tiles-section > article.tile > a | /uploads/d3/d33a8cb28f52a97bf93ee55274e28f7cde20a76e---Th... | 959.4 KiB | 851.6 KiB |
Accelerators
Embedding SDG-aligned practices into business operations and acce… main > section.tiles-section > article.tile > a | /uploads/2f/2f4b6579bf3b89db395ee7701f626e2327ea4845---UN... | 804.1 KiB | 696.3 KiB |
UN Global Compact Academy
Our digital platform will fast-track your sustainabi… main > section.tiles-section > article.tile > a | /uploads/e3/e3fe41ea76087af52bcb6dd832936cd843d8dfb3---UN... | 692.2 KiB | 584.4 KiB |
Communication on Progress
Understand your requirements and submit your CoP tod… main > section.tiles-section > article.tile > a | /uploads/c3/c30e6a157dbd44ff46705132e4adfd20c2071f95---Co... | 667.2 KiB | 559.4 KiB |
Peer Learning Groups
Driving collective impact by connecting sustainability pr… main > section.tiles-section > article.tile > a | /uploads/84/841a5566aaab5b3560e5318d8f39902a1a9a3f7d---UN... | 631.3 KiB | 523.5 KiB |
Peer Learning Groups
Connecting sustainability professionals to drive collecti… div.slick-track > div.slick-slide > div > div.carousel-background | /uploads/b9/b9ccf3491d89ad7cb10644c12da05e6be7c7ce61---Pe... | 787.9 KiB | 397.2 KiB |
Forward Faster initiative
Guiding companies on where they can make the biggest… main > section.tiles-section > article.tile > a | /uploads/8d/8dadae25afe4d2782f0fffc91a9f882d6cedf67f---UN... | 480.3 KiB | 372.5 KiB |
Optimize LCP by making the LCP image discoverable from the HTML immediately, and avoiding lazy-loading
Performance issues directly impact user engagement and conversion rates.
HTTP/2 and HTTP/3 offer many benefits over HTTP/1.1, such as multiplexing. Learn more about using modern HTTP.
Performance issues directly impact user engagement and conversion rates.
Avoid chaining critical requests by reducing the length of chains, reducing the download size of resources, or deferring the download of unnecessary resources to improve page load.
Performance issues directly impact user engagement and conversion rates.
Requests are blocking the page's initial render, which may delay LCP. Deferring or inlining can move these network requests out of the critical path.
Performance issues directly impact user engagement and conversion rates.
| URL | Transfer Size | Duration |
|---|---|---|
| /assets/gems-81dc831519d94a2c517222a86f43f9dc1c73469ff268... | 352.3 KiB | 765 ms |
| /assets/application-b2f8dd9bfd23230811d2e2c4650182ea76768... | 41.4 KiB | 372 ms |
| js.stripe.com/v2/ | 19.8 KiB | 241 ms |
Your first network request is the most important. Reduce its latency by avoiding redirects, ensuring a fast server response, and enabling text compression.
Performance issues directly impact user engagement and conversion rates.
These insights are also available in the Chrome DevTools Performance Panel - record a trace to view more detailed information.
These are the largest layout shifts observed on the page. Each table item represents a single layout shift, and shows the element that shifted the most. Below each item are possible root causes that led to the layout shift. Some of these layout shifts may not be included in the CLS metric value due to windowing. Learn how to improve CLS
Performance issues directly impact user engagement and conversion rates.
| Element | Layout shift score |
|---|---|
25,493
PARTICIPANTS
167
COUNTRIES
64
COUNTRY NETWORKS body > main > section.stats-section | 0.342 |
All
Participants
About
News
Events
Sign In
Contact Us
Seleccionar idioma
españo… header#main-header > div.wrapper > div.header-top > nav#main-navigation-container | 0.000 |
Business Leadership for Clean Air - Timezone 1 (EST/NYC) div.views-field > span.field-content > a.event > h2 | 0.000 |
The Water Resilience Coalition and the World Economic Forum’s Water Futures com… div.views-field > span.field-content > a.event > h2 | 0.000 |
Time to Interactive is the amount of time it takes for the page to become fully interactive. Learn more about the Time to Interactive metric.
Performance issues directly impact user engagement and conversion rates.
Minifying JavaScript files can reduce payload sizes and script parse time. Learn how to minify JavaScript.
Performance issues directly impact user engagement and conversion rates.
| URL | Transfer Size | Est Savings |
|---|---|---|
| /assets/gems-81dc831519d94a2c517222a86f43f9dc1c73469ff268... | 350.8 KiB | 118.6 KiB |
| /assets/turbo-3065a6a03744a1e8b35515434791174d8569e8d242f... | 38.6 KiB | 7.7 KiB |
Reduce unused rules from stylesheets and defer CSS not used for above-the-fold content to decrease bytes consumed by network activity. Learn how to reduce unused CSS.
Performance issues directly impact user engagement and conversion rates.
| URL | Transfer Size | Est Savings |
|---|---|---|
| /assets/application-b2f8dd9bfd23230811d2e2c4650182ea76768... | 39.9 KiB | 35.4 KiB |
Reduce unused JavaScript and defer loading scripts until they are required to decrease bytes consumed by network activity. Learn how to reduce unused JavaScript.
Multi-megabyte JavaScript bundles delay every interactive feature on the page.
This is the Lighthouse audit fired when too much JS is shipped relative to what executes. The fix isn't a config flag — it requires bundle analysis (webpack-bundle-analyzer, rollup-plugin-visualizer), splitting routes into chunks, lazy-loading off-screen components, and removing unused dependencies. Fundamentally different from minification: minifying reduces byte count, this reduces what's downloaded at all.
Source: Google web.dev / Lighthouse
Consider reducing the time spent parsing, compiling and executing JS. You may find delivering smaller JS payloads helps with this. Learn how to minimize main-thread work
Performance issues directly impact user engagement and conversion rates.
| Category | Time Spent |
|---|---|
| Script Evaluation | 1.0 s |
| Other | 877 ms |
| Style & Layout | 356 ms |
| Script Parsing & Compilation | 332 ms |
| Rendering | 155 ms |
| Parse HTML & CSS | 34 ms |
| Garbage Collection | 13 ms |
Large network payloads cost users real money and are highly correlated with long load times. Learn how to reduce payload sizes.
Performance issues directly impact user engagement and conversion rates.
Set an explicit width and height on image elements to reduce layout shifts and improve CLS. Learn how to set image dimensions
Performance issues directly impact user engagement and conversion rates.
| URL | |
|---|---|
United Nations Global Compact div.header-top > a.logo > h1 > img | /assets/ungc_masterbrand_solid_white-7afbb29ddd9ad8039677... |
More information about the performance of your application. These numbers don't directly affect the Performance score.
These checks highlight opportunities to improve the accessibility of your web app. Automatic detection can only detect a subset of issues and does not guarantee the accessibility of your web app, so manual testing is also encouraged.
When a button doesn't have an accessible name, screen readers announce it as "button", making it unusable for users who rely on screen readers. Learn how to make buttons more accessible.
Performance issues directly impact user engagement and conversion rates.
| Failing Elements |
|---|
div.header-top > nav#main-navigation-container > form#main-search > button.search-button div.header-top > nav#main-navigation-container > form#main-search > button.search-button |
Screen reader users rely on frame titles to describe the contents of frames. Learn more about frame titles.
Performance issues directly impact user engagement and conversion rates.
| Failing Elements |
|---|
section.events-news-component > div.tabbed-component > article.tab-content > iframe#iFrameResizer0 section.events-news-component > div.tabbed-component > article.tab-content > iframe#iFrameResizer0 |
These are opportunities to improve the semantics of the controls in your application. This may enhance the experience for users of assistive technology, like a screen reader.
Low-contrast text is difficult or impossible for many users to read. Learn how to provide sufficient color contrast.
Performance issues directly impact user engagement and conversion rates.
| Failing Elements |
|---|
EVENTS div.tabbed-component > menu.tabs > li.tab > button |
All News div.tabbed-component > article.tab-content > footer.events-component-footer > a |
ACCEPT ALL div#cookiescript_injected_wrapper > div#cookiescript_injected > div#cookiescript_buttons > div#cookiescript_accept |
These are opportunities to improve the legibility of your content.
If a page doesn't specify a `lang` attribute, a screen reader assumes that the page is in the default language that the user chose when setting up the screen reader. If the page isn't actually in the default language, then the screen reader might not announce the page's text correctly. Learn more about the `lang` attribute.
Performance issues directly impact user engagement and conversion rates.
| Failing Elements |
|---|
html html |
These are opportunities to improve the interpretation of your content by users in different locales.
Touch targets with sufficient size and spacing help users who may have difficulty targeting small controls to activate the targets. Learn more about touch targets.
Performance issues directly impact user engagement and conversion rates.
| Failing Elements |
|---|
div.header-top > nav#main-navigation-container > form#main-search > button.search-button div.header-top > nav#main-navigation-container > form#main-search > button.search-button |
These items highlight common accessibility best practices.
Deprecated APIs will eventually be removed from the browser. Learn more about deprecated APIs.
Performance issues directly impact user engagement and conversion rates.
| Deprecation / Warning | Source |
|---|---|
| AttributionReporting |
Errors logged to the console indicate unresolved problems. They can come from network request failures and other browser concerns. Learn more about this errors in console diagnostic audit
Performance issues directly impact user engagement and conversion rates.
| Source | Description |
|---|---|
Failed to load resource: the server responded with a status of 451 () | |
Failed to load resource: the server responded with a status of 451 () |
These checks ensure that your page is following basic search engine optimization advice. There are many additional factors Lighthouse does not score here that may affect your search ranking, including performance on Core Web Vitals. Learn more about Google Search Essentials.
Descriptive link text helps search engines understand your content. Learn how to make links more accessible.
Performance issues directly impact user engagement and conversion rates.
| Link destination | Link Text |
|---|---|
| /compactjournal/fuchs-lubricants-south-africa-advances-li... | READ MORE |
| /compactjournal/fuchs-lubricants-south-africa-advances-li... | READ MORE |
Format your HTML in a way that enables crawlers to better understand your app’s content.
Send Feedback