Global Performance
6/6 locations ✓Acceptable global latency — average 421ms across 6 locations, fastest from New York (94ms), slowest from Singapore (861ms). AWS CloudFront edge cache (RefreshHit from cloudfront). Cache-Control disables caching (no-store). 2 locations above the 500ms target.
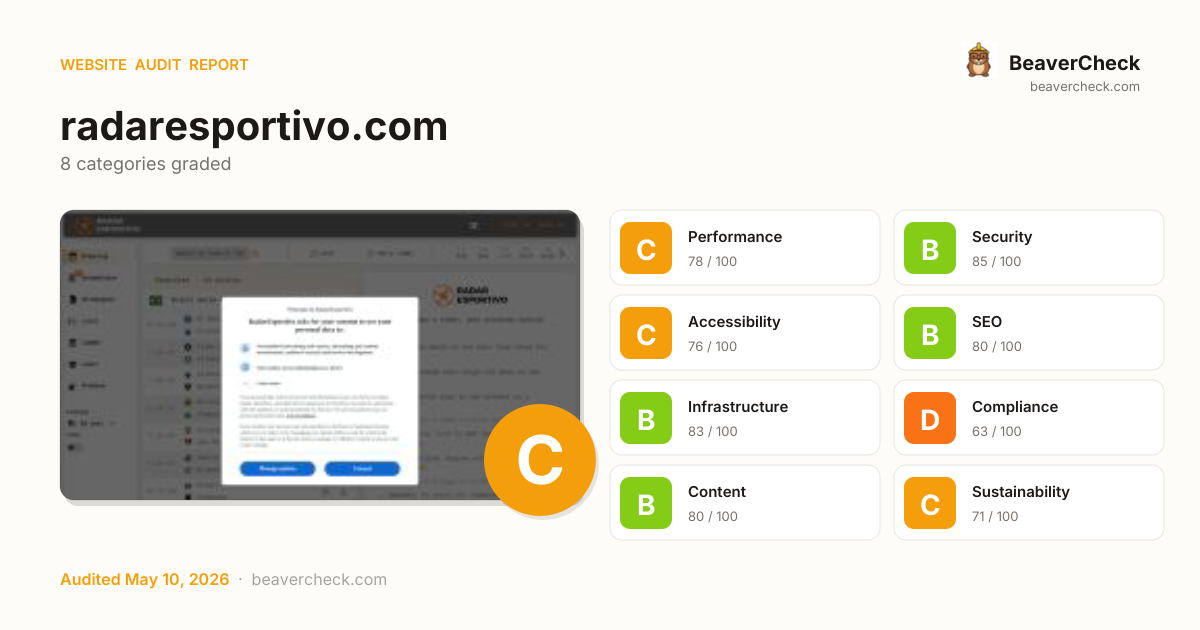
Audit overview
Compliance needs attention; the rest of the categories are in good shape.
Fix Priority Matrix
5 findingsQuick Wins
4High impact, low effort — start here.
Strategic
1High impact, requires investment.
Easy Improvements
0Small gains, minimal effort.
Nothing in this quadrant — good news.
Deprioritize
0Low impact, high effort — do last.
Nothing in this quadrant — good news.
Screenshots


Top Priorities (5)
'unsafe-inline' found in script source
Unsafe value (unsafe-inline, unsafe-eval) in script-src defeats CSP's main protection — XSS injections can execute again.
Page body has only 16 chars of text -- likely empty / placeholder
Security gaps expose your site and users to attacks, eroding trust.
Page weighs 6.6 MB (4.2 MB transferred)
Informational: total page weight (uncompressed) and bytes actually transferred over the wire.
No <main> landmark found
Without a <main> landmark, screen-reader users can't skip past the navigation to the page content — every page starts with re-reading the menu.
Soft 404: server returns HTTP 200 for non-existent pages
Soft 404s (HTTP 200 for missing pages) confuse Google — it indexes the 'not found' page as real content and ranks it.
Business case
What fixing the audit's findings is worth -- and what ignoring them keeps costing.
Return on investment
$717 investment → $12,327/month returns + USD 157,500 risk avoided
Figures combine localized regulatory fine ceilings, search/conversion value priced against local CPC, and bandwidth waste estimates. Results depend on implementation quality and audience composition. Not legal or financial advice.
Conversion barriers
7 barrier(s) likely increasing bounce by ~29%.
- Page takes 10.8s to loadUsers abandon at ~3s — you're 8.3s over the 2.5s threshold→ Optimize render-blocking resources, preload the hero image, and compress images
- Page feels frozen for 1.6sClicks on the primary CTA are ignored while JavaScript runs→ Break up long tasks; defer non-critical JavaScript to post-hydration
- No Content-Security-Policy headerHigher XSS blast radius — one compromised script can exfiltrate the checkout form→ Ship a reporting-only CSP first, then enforce once violations are clean
- No structured dataNo rich-result eligibility in Google — lower SERP CTR vs competitors with stars and prices→ Add JSON-LD for your page type (Product, Article, FAQPage, LocalBusiness, …)
- Thin contentUnder 300 words — visitors bounce looking for substance, search engines rank competitors first→ Add a substantive FAQ, product detail, or case-study section
Preliminary CRO audit — each barrier links to the tab with detailed analysis.
Remediation cost
Start here for the best return on investment
Cost by category
Cost by effort level
Adjust assumptions
Team composition
Multiplier applied to dev hours to reflect QA, design, and PM overhead. Use Dev only for solo work; Full team for projects with formal review processes.
Rates reflect fully-loaded developer cost including overhead
Warning:Cost of inaction
Compliance Risk
$157,500
- No privacy policy link detectedCCPA/CPRA: USD 2,500 – USD 7,500
- Trackers detected but no cookie policy foundCCPA/CPRA: USD 2,500 – USD 7,500
- Trackers detected but no privacy policy foundCCPA/CPRA: USD 2,500 – USD 7,500
Bounce-Rate Cost
$7,733 /mo
+28.7pp bounce · ~2,875 lost visitors/mo
CPC: USD 2.69
Bandwidth Waste
$1.06 /mo
13267.1 MB/mo × 0.080 USD/GB
- Optimize transfer: save ~1.3 MB per page loadSaves $1.06/mo
Compliance figures represent the statutory maximum fine for the most severe triggered category, capped per regulation — not the sum of per-finding penalties. Based on published regulatory fine ranges. This is not legal advice.
Unique monthly visitors from your analytics
Purchases, signups, or key actions
Optional — for revenue estimation
more engaged visitors from reduced bounce
Fix 5 critical issues to capture this value
How this is calculated
Based on Google/Deloitte research ("Milliseconds Make Millions") showing a ~7% bounce rate increase per additional second of LCP above the 2.5s "Good" threshold.
Your site's LCP: → estimated after fixes.
These are estimates based on industry research — actual results vary
Your data stays in your browser — nothing is sent to our servers
Lighthouse
Mobile
First Contentful Paint First Contentful Paint — how long until the browser renders the first piece of content. Under 1.8s is good.
1.83 s
Largest Contentful Paint Largest Contentful Paint — how long until the largest visible element loads. Under 2.5s is good.
10.82 s
Total Blocking Time Total Blocking Time — total time the main thread was blocked, preventing user input. Under 200ms is good.
1.56 s
Cumulative Layout Shift Cumulative Layout Shift — measures visual stability. How much the page layout shifts during loading. Under 0.1 is good.
0.000
Speed Index Speed Index — how quickly content is visually displayed during load. Under 3.4s is good.
3.72 s
Time to Interactive Time to Interactive — how long until the page is fully interactive and responds to user input. Under 3.8s is good.
11.25 s
Desktop
First Contentful Paint First Contentful Paint — how long until the browser renders the first piece of content. Under 1.8s is good.
489 ms
Largest Contentful Paint Largest Contentful Paint — how long until the largest visible element loads. Under 2.5s is good.
2.53 s
Total Blocking Time Total Blocking Time — total time the main thread was blocked, preventing user input. Under 200ms is good.
125 ms
Cumulative Layout Shift Cumulative Layout Shift — measures visual stability. How much the page layout shifts during loading. Under 0.1 is good.
0.010
Speed Index Speed Index — how quickly content is visually displayed during load. Under 3.4s is good.
1.28 s
Time to Interactive Time to Interactive — how long until the page is fully interactive and responds to user input. Under 3.8s is good.
2.53 s
Categories
8Performance
Page weighs 6.6 MB (4.2 MB transferred)
Security
'unsafe-inline' found in script source
Accessibility
No <main> landmark found
SEO
All checks pass
Infrastructure
All checks pass
Compliance
All checks pass
Content
All checks pass
Sustainability
All checks pass
How you compare
Where this site stands against peers running the same stack.
Top 10% of WordPress sites score 86+ on Compliance; you're at 63 — closing this gap is the highest-leverage improvement.
Top 10% of Amazon Route 53 sites score 86+ on Compliance; you're at 63 — closing this gap is the highest-leverage improvement.
Technology stack
WordPress, hosted on AWS, with AWS CloudFront CDN
Stack Architecture
 WordPress
  Open Graph
  Svelte SvelteKit
  Vite
Vite  AWS CloudFront Amazon CloudFront
  Amazon S3
  AWS Amazon Web Services
 All Detected Technologies (14)
Amazon CloudFront is a fast content delivery network (CDN) service that securely delivers data, videos, applications, and APIs to customers globally with low latency, high transfer speeds.
Amazon S3 or Amazon Simple Storage Service is a service offered by Amazon Web Services (AWS) that provides object storage through a web service interface.
Amazon Web Services (AWS) is a comprehensive cloud services platform offering compute power, database storage, content delivery and other functionality.
HTTP Strict Transport Security (HSTS) informs browsers that the site should only be accessed using HTTPS.
Open Graph is a protocol that is used to integrate any web page into the social graph.
Svelte is a free and open-source front end compiler created by Rich Harris and maintained by the Svelte core team members.
SvelteKit is the official Svelte framework for building web applications with a flexible filesystem-based routing.
Vite is a rapid development tool for modern web projects.
Observations (3)
WordPress detected — review security configuration
WordPress sites benefit from: protecting wp-login.php, disabling XML-RPC if unused, restricting REST API access, and keeping all plugins and themes up to date. Check the Security tab for specific findings.
No build tool detected
A framework (Amazon Route 53) was detected but no bundler was identified. The build tool may not be detectable from output patterns, or the site may use the framework's built-in bundler.
Complex technology stack detected
14 technologies identified. A complex stack increases maintenance burden and attack surface. Consider whether all components are actively needed.
Show your score
Drop this badge on your README, marketing site, or status page. It auto-updates every time the audit re-runs and links back to this report.
This badge auto-updates with your latest scan result.
[](https://beavercheck.com/results/6a273ca7-f1e4-4d00-9edd-f5c6e9114664)<a href="https://beavercheck.com/results/6a273ca7-f1e4-4d00-9edd-f5c6e9114664"><img src="https://beavercheck.com/badge?url=https%3A%2F%2Fradaresportivo.com" alt="BeaverCheck Score"></a>https://beavercheck.com/badge?url=https%3A%2F%2Fradaresportivo.comExport & share
Download the audit, share with your team, or grab a fix plan ready to copy into your tracker.
Copies markdown to clipboard
Fix Plan
Three-week roadmap to ship the audit's findings, with one-click copy targets for your tracker.
Three-week fix plan
2 sprints · 7h total → projected B (88)
Sprint 1: Quick Wins
+8Highest ROI — low effort, high impact
- · Page weighs 6.6 MB (4.2 MB transferred)
- · No <main> landmark found
- · Page body has only 16 chars of text -- likely empty / placeholder
- · Soft 404: server returns HTTP 200 for non-existent pages
Sprint 3: Strategic Improvements
+1Higher effort, long-term payoff
- · 'unsafe-inline' found in script source