Spain · Madrid Completed: Apr 16, 2026 17:10 UTC
Mobile 375 × 812

Desktop 1440 × 900
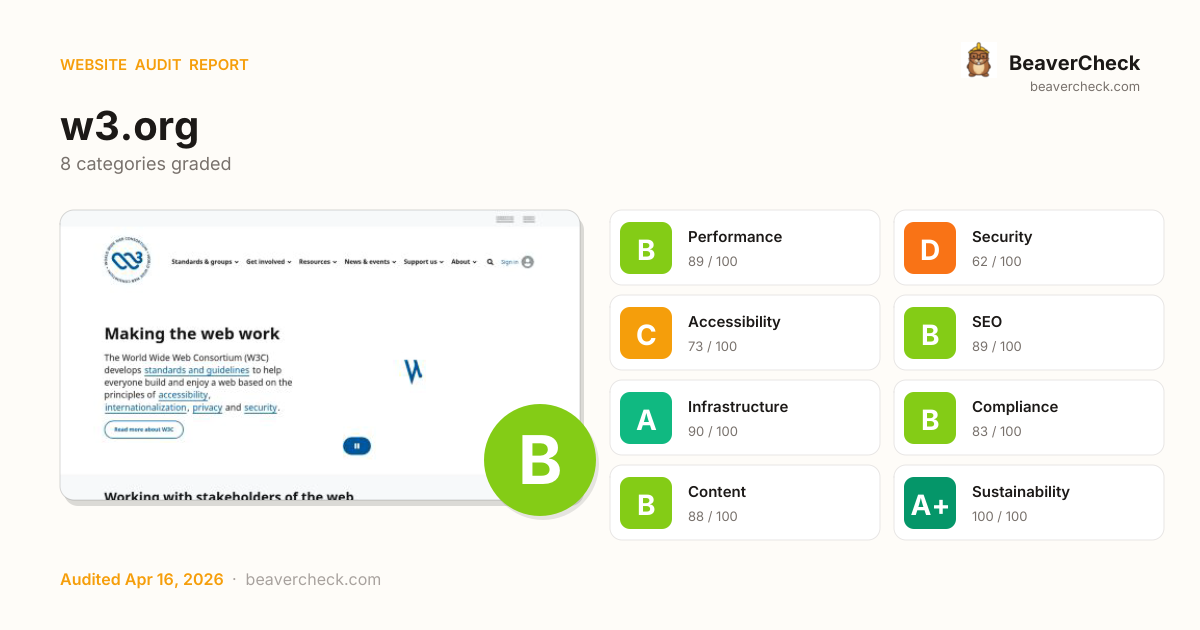
Score: 80 / 100
Based on 8 categories, 0 sections
Fast site — your users get a smooth experience.
Several missing protections leave your users and data exposed.
Mostly accessible, but some users still face barriers.
Well-optimized for search — your content is discoverable.
Solid infrastructure — fast server responses across the board.
Mostly compliant — a few items need attention.
Rich content metadata — your pages look great everywhere.
Lean and efficient — low environmental impact per visit.
The overall score is a weighted average of individual category scores. Categories with more impact on user experience and security carry more weight.
Weights reflect general web best practices. Individual needs may differ.
Content-Security-Policy header is missing
Security gaps expose your site and users to attacks, eroding trust.
HSTS header is missing
Security gaps expose your site and users to attacks, eroding trust.
No Content-Security-Policy header found
Security gaps expose your site and users to attacks, eroding trust.
1 link(s) with no accessible text
Accessibility issues exclude users with disabilities — up to 15% of your potential audience.
4 image-only link(s) without alt text
Accessibility issues exclude users with disabilities — up to 15% of your potential audience.
High impact, low effort — start here.
High impact, requires investment.
Small gains, minimal effort.
Nothing in this quadrant — good news.
Low impact, high effort — do last.
Nothing in this quadrant — good news.
[](https://beavercheck.com/results/6a64d8e9-1a9e-4ddb-841b-275b40d5fc1b)<a href="https://beavercheck.com/results/6a64d8e9-1a9e-4ddb-841b-275b40d5fc1b"><img src="https://beavercheck.com/badge?url=https%3A%2F%2Fw3.org" alt="BeaverCheck Score"></a>https://beavercheck.com/badge?url=https%3A%2F%2Fw3.orgThis badge auto-updates with your latest scan result.
Your site performs reasonably well, but a few targeted fixes could meaningfully improve results. Addressing the critical issues below would have the most immediate impact on your user trust.
3 barrier(s) likely increasing bounce by ~6%.
No HSTS header
+1% bounceReturning visitors are briefly exposed to downgrade attacks on first request
Fix: Set Strict-Transport-Security: max-age=31536000; includeSubDomains
No Content-Security-Policy header
+1% bounceHigher XSS blast radius — one compromised script can exfiltrate the checkout form
Fix: Ship a reporting-only CSP first, then enforce once violations are clean
No structured data
+2% bounceNo rich-result eligibility in Google — lower SERP CTR vs competitors with stars and prices
Fix: Add JSON-LD for your page type (Product, Article, FAQPage, LocalBusiness, …)
Preliminary CRO audit — each barrier links to the tab with detailed analysis.
€383 investment → €0.15/month returns + EUR 120,500,000 risk avoided
€383
4h · 5 findings
€0.15 /mo
~€1.79 / year
EUR 120,500,000
if kept compliant
€128 — in quick wins — start here for the fastest payback
Figures combine localized regulatory fine ceilings, search/conversion value priced against local CPC, and bandwidth waste estimates. Results depend on implementation quality and audience composition. Not legal or financial advice.
4.5 developer hours at €85/hr
Based on European Union rates (€85/hr)
Start here for the best return on investment
€10,041,667 / month at risk
~€120,500,002 / year if left unfixed
€120,500,000
+3 more
€0.15 /mo
2017.5 MB/mo × 0.074 EUR/GB
Compliance figures represent the statutory maximum fine for the most severe triggered category, capped per regulation — not the sum of per-finding penalties. Based on published regulatory fine ranges. This is not legal advice.
Unique monthly visitors from your analytics
Purchases, signups, or key actions
Optional — for revenue estimation
more engaged visitors from reduced bounce
Fix 5 critical issues to capture this value
Based on Google/Deloitte research ("Milliseconds Make Millions") showing a ~7% bounce rate increase per additional second of LCP above the 2.5s "Good" threshold.
Your site's LCP: → estimated after fixes.
These are estimates based on industry research — actual results vary
Your data stays in your browser — nothing is sent to our servers
Thanks for your feedback!
We'll use a cached audit if available, or offer to scan.
Industry-standard audits powered by Google Lighthouse.
Key metrics that affect user experience.
First Contentful Paint First Contentful Paint — how long until the browser renders the first piece of content. Under 1.8s is good.
2.05 s
Largest Contentful Paint Largest Contentful Paint — how long until the largest visible element loads. Under 2.5s is good.
2.50 s
Total Blocking Time Total Blocking Time — total time the main thread was blocked, preventing user input. Under 200ms is good.
4 ms
Cumulative Layout Shift Cumulative Layout Shift — measures visual stability. How much the page layout shifts during loading. Under 0.1 is good.
0.000
Speed Index Speed Index — how quickly content is visually displayed during load. Under 3.4s is good.
2.05 s
Time to Interactive Time to Interactive — how long until the page is fully interactive and responds to user input. Under 3.8s is good.
2.54 s
Audit breakdown by category with detailed findings.
Remove large, duplicate JavaScript modules from bundles to reduce unnecessary bytes consumed by network activity.
Performance issues directly impact user engagement and conversion rates.
Polyfills and transforms enable older browsers to use new JavaScript features. However, many aren't necessary for modern browsers. Consider modifying your JavaScript build process to not transpile Baseline features, unless you know you must support older browsers. Learn why most sites can deploy ES6+ code without transpiling
Shipping ES5 transpiled code to modern browsers wastes bytes — every user with an evergreen browser pays for compatibility you don't need.
Most users today run browsers that natively support ES6+, async/await, optional chaining, and the rest of modern JavaScript. Transpiling to ES5 'just in case' adds 20-40% to your bundle for no benefit. Configure your build to target a modern browserslist, or ship a differential bundle pair (modern + legacy) with the module/nomodule pattern.
Source: Google web.dev / Lighthouse
3rd party code can significantly impact load performance. Reduce and defer loading of 3rd party code to prioritize your page's content.
Performance issues directly impact user engagement and conversion rates.
A long cache lifetime can speed up repeat visits to your page. Learn more about caching.
Performance issues directly impact user engagement and conversion rates.
Your first network request is the most important. Reduce its latency by avoiding redirects, ensuring a fast server response, and enabling text compression.
Performance issues directly impact user engagement and conversion rates.
Consider setting font-display to swap or optional to ensure text is consistently visible. swap can be further optimized to mitigate layout shifts with font metric overrides.
Performance issues directly impact user engagement and conversion rates.
A forced reflow occurs when JavaScript queries geometric properties (such as offsetWidth) after styles have been invalidated by a change to the DOM state. This can result in poor performance. Learn more about forced reflows and possible mitigations.
Performance issues directly impact user engagement and conversion rates.
Avoid chaining critical requests by reducing the length of chains, reducing the download size of resources, or deferring the download of unnecessary resources to improve page load.
Performance issues directly impact user engagement and conversion rates.
Requests are blocking the page's initial render, which may delay LCP. Deferring or inlining can move these network requests out of the critical path.
Performance issues directly impact user engagement and conversion rates.
| URL | Transfer Size | Duration |
|---|---|---|
| www.w3.org/assets/website-2021/js/libraries/fontfaceobserver.js | 3.1 KiB | |
| www.w3.org/assets/website-2021/styles/core.css?ver=1.5 | 39.0 KiB | 300 ms |
| www.w3.org/assets/website-2021/styles/advanced.css?ver=1.5 | 10.0 KiB |
Reducing the download time of images can improve the perceived load time of the page and LCP. Learn more about optimizing image size
Performance issues directly impact user engagement and conversion rates.
| URL | Resource Size | Est Savings | |
|---|---|---|---|
main#main > section.component > div.image > img main#main > section.component > div.image > img | www.w3.org/cms-uploads/_920xAUTO_crop_center-center_none/w30c-pattern.jpeg | 169.9 KiB | 155.0 KiB |
main#main > section.component > div.image > img main#main > section.component > div.image > img | /cms-uploads/_920xAUTO_crop_center-center_none/ryan-quint... | 107.4 KiB | 92.5 KiB |
main#main > section.component > div.image > img main#main > section.component > div.image > img | /cms-uploads/_920xAUTO_crop_center-center_none/marvin-mey... | 97.8 KiB | 82.8 KiB |
Yubico div.component--members__grid > figure > div.l-box > img | www.w3.org/thumbnails/250/logos/organizations/86485.png?x-version=3 | 18.0 KiB | 15.6 KiB |
Datadog div.component--members__grid > figure > div.l-box > img | www.w3.org/thumbnails/250/logos/organizations/127220.png?x-version=1 | 16.8 KiB | 14.2 KiB |
Fundacion CTIC div.component--members__grid > figure > div.l-box > img | www.w3.org/thumbnails/250/logos/organizations/33823.png?x-version=3 | 12.0 KiB | 11.4 KiB |
Institut National de Recherche en Informatique et en Automatique (Inria) div.component--members__grid > figure > div.l-box > img | www.w3.org/thumbnails/250/logos/organizations/10894.png?x-version=3 | 10.4 KiB | 9.6 KiB |
Accessible by Design div.component--members__grid > figure > div.l-box > img | www.w3.org/thumbnails/250/logos/organizations/160564.png?x-version=1 | 10.6 KiB | 8.1 KiB |
These insights are also available in the Chrome DevTools Performance Panel - record a trace to view more detailed information.
Minifying CSS files can reduce network payload sizes. Learn how to minify CSS.
Performance issues directly impact user engagement and conversion rates.
| URL | Transfer Size | Est Savings |
|---|---|---|
| www.w3.org/assets/website-2021/styles/core.css?ver=1.5 | 39.0 KiB | 14.4 KiB |
| www.w3.org/assets/website-2021/styles/advanced.css?ver=1.5 | 10.0 KiB | 3.8 KiB |
Reduce unused rules from stylesheets and defer CSS not used for above-the-fold content to decrease bytes consumed by network activity. Learn how to reduce unused CSS.
Performance issues directly impact user engagement and conversion rates.
| URL | Transfer Size | Est Savings |
|---|---|---|
| www.w3.org/assets/website-2021/styles/core.css?ver=1.5 | 38.8 KiB | 34.5 KiB |
Minifying JavaScript files can reduce payload sizes and script parse time. Learn how to minify JavaScript.
Performance issues directly impact user engagement and conversion rates.
| URL | Transfer Size | Est Savings |
|---|---|---|
| www.w3.org/assets/website-2021/js/main.js?ver=1.4 | 16.8 KiB | 6.0 KiB |
Set an explicit width and height on image elements to reduce layout shifts and improve CLS. Learn how to set image dimensions
Performance issues directly impact user engagement and conversion rates.
| URL | |
|---|---|
W3C div.global-nav__inner > a.logo-link > span.logo > img | www.w3.org/assets/logos/w3c-2025/svg/w3c.svg |
main#main > section.component > div.image > img main#main > section.component > div.image > img | www.w3.org/cms-uploads/_920xAUTO_crop_center-center_none/w30c-pattern.jpeg |
main#main > section.component > div.image > img main#main > section.component > div.image > img | /cms-uploads/_920xAUTO_crop_center-center_none/ryan-quint... |
main#main > section.component > div.image > img main#main > section.component > div.image > img | /cms-uploads/_920xAUTO_crop_center-center_none/marvin-mey... |
Yubico div.component--members__grid > figure > div.l-box > img | www.w3.org/thumbnails/250/logos/organizations/86485.png?x-version=3 |
Accessible by Design div.component--members__grid > figure > div.l-box > img | www.w3.org/thumbnails/250/logos/organizations/160564.png?x-version=1 |
Datadog div.component--members__grid > figure > div.l-box > img | www.w3.org/thumbnails/250/logos/organizations/127220.png?x-version=1 |
Institut National de Recherche en Informatique et en Automatique (Inria) div.component--members__grid > figure > div.l-box > img | www.w3.org/thumbnails/250/logos/organizations/10894.png?x-version=3 |
Fundacion CTIC div.component--members__grid > figure > div.l-box > img | www.w3.org/thumbnails/250/logos/organizations/33823.png?x-version=3 |
Electronics and Telecommunications Research Institute (ETRI) div.component--members__grid > figure > div.l-box > img | www.w3.org/thumbnails/250/logos/organizations/28169.png?x-version=4 |
More information about the performance of your application. These numbers don't directly affect the Performance score.
Redirects introduce additional delays before the page can be loaded. Learn how to avoid page redirects.
Performance issues directly impact user engagement and conversion rates.
| URL | Time Spent |
|---|---|
| w3.org/ | 807 ms |
| www.w3.org/ | 0.0 ms |
These checks highlight opportunities to improve the accessibility of your web app. Automatic detection can only detect a subset of issues and does not guarantee the accessibility of your web app, so manual testing is also encouraged.
These checks ensure that your page is following basic search engine optimization advice. There are many additional factors Lighthouse does not score here that may affect your search ranking, including performance on Core Web Vitals. Learn more about Google Search Essentials.
Industry-standard audits powered by Google Lighthouse. — Desktop
Key metrics that affect user experience. — Desktop
First Contentful Paint First Contentful Paint — how long until the browser renders the first piece of content. Under 1.8s is good.
783 ms
Largest Contentful Paint Largest Contentful Paint — how long until the largest visible element loads. Under 2.5s is good.
866 ms
Total Blocking Time Total Blocking Time — total time the main thread was blocked, preventing user input. Under 200ms is good.
0 ms
Cumulative Layout Shift Cumulative Layout Shift — measures visual stability. How much the page layout shifts during loading. Under 0.1 is good.
0.000
Speed Index Speed Index — how quickly content is visually displayed during load. Under 3.4s is good.
783 ms
Time to Interactive Time to Interactive — how long until the page is fully interactive and responds to user input. Under 3.8s is good.
866 ms
Audit breakdown by category with detailed findings.
Remove large, duplicate JavaScript modules from bundles to reduce unnecessary bytes consumed by network activity.
Performance issues directly impact user engagement and conversion rates.
Polyfills and transforms enable older browsers to use new JavaScript features. However, many aren't necessary for modern browsers. Consider modifying your JavaScript build process to not transpile Baseline features, unless you know you must support older browsers. Learn why most sites can deploy ES6+ code without transpiling
Shipping ES5 transpiled code to modern browsers wastes bytes — every user with an evergreen browser pays for compatibility you don't need.
Most users today run browsers that natively support ES6+, async/await, optional chaining, and the rest of modern JavaScript. Transpiling to ES5 'just in case' adds 20-40% to your bundle for no benefit. Configure your build to target a modern browserslist, or ship a differential bundle pair (modern + legacy) with the module/nomodule pattern.
Source: Google web.dev / Lighthouse
3rd party code can significantly impact load performance. Reduce and defer loading of 3rd party code to prioritize your page's content.
Performance issues directly impact user engagement and conversion rates.
A long cache lifetime can speed up repeat visits to your page. Learn more about caching.
Performance issues directly impact user engagement and conversion rates.
Your first network request is the most important. Reduce its latency by avoiding redirects, ensuring a fast server response, and enabling text compression.
Performance issues directly impact user engagement and conversion rates.
Consider setting font-display to swap or optional to ensure text is consistently visible. swap can be further optimized to mitigate layout shifts with font metric overrides.
Performance issues directly impact user engagement and conversion rates.
Optimize LCP by making the LCP image discoverable from the HTML immediately, and avoiding lazy-loading
Performance issues directly impact user engagement and conversion rates.
Avoid chaining critical requests by reducing the length of chains, reducing the download size of resources, or deferring the download of unnecessary resources to improve page load.
Performance issues directly impact user engagement and conversion rates.
Requests are blocking the page's initial render, which may delay LCP. Deferring or inlining can move these network requests out of the critical path.
Performance issues directly impact user engagement and conversion rates.
| URL | Transfer Size | Duration |
|---|---|---|
| www.w3.org/assets/website-2021/js/libraries/fontfaceobserver.js | 3.5 KiB | 162 ms |
| www.w3.org/assets/website-2021/styles/advanced.css?ver=1.5 | 10.4 KiB | 162 ms |
| www.w3.org/assets/website-2021/styles/core.css?ver=1.5 | 39.3 KiB | 162 ms |
Reducing the download time of images can improve the perceived load time of the page and LCP. Learn more about optimizing image size
Performance issues directly impact user engagement and conversion rates.
| URL | Resource Size | Est Savings | |
|---|---|---|---|
main#main > section.component > div.image > img main#main > section.component > div.image > img | www.w3.org/cms-uploads/_920xAUTO_crop_center-center_none/w30c-pattern.jpeg | 169.9 KiB | 142.4 KiB |
main#main > section.component > div.image > img main#main > section.component > div.image > img | /cms-uploads/_920xAUTO_crop_center-center_none/ryan-quint... | 107.4 KiB | 79.9 KiB |
main#main > section.component > div.image > img main#main > section.component > div.image > img | /cms-uploads/_920xAUTO_crop_center-center_none/marvin-mey... | 97.8 KiB | 70.2 KiB |
1Password div.component--members__grid > figure > div.l-box > img | www.w3.org/thumbnails/250/logos/organizations/131682.png?x-version=1 | 34.4 KiB | 32.0 KiB |
Web3D Consortium div.component--members__grid > figure > div.l-box > img | www.w3.org/thumbnails/250/logos/organizations/7211.png?x-version=1 | 12.0 KiB | 11.2 KiB |
Capital One Financial div.component--members__grid > figure > div.l-box > img | www.w3.org/thumbnails/250/logos/organizations/98428.png?x-version=1 | 8.6 KiB | 7.7 KiB |
Entersekt div.component--members__grid > figure > div.l-box > img | www.w3.org/thumbnails/250/logos/organizations/116845.png?x-version=4 | 6.5 KiB | 5.4 KiB |
Taiwan Digital Publishing Forum div.component--members__grid > figure > div.l-box > img | www.w3.org/thumbnails/250/logos/organizations/110285.png?x-version=1 | 6.8 KiB | 5.2 KiB |
These insights are also available in the Chrome DevTools Performance Panel - record a trace to view more detailed information.
Reduce unused rules from stylesheets and defer CSS not used for above-the-fold content to decrease bytes consumed by network activity. Learn how to reduce unused CSS.
Performance issues directly impact user engagement and conversion rates.
| URL | Transfer Size | Est Savings |
|---|---|---|
| www.w3.org/assets/website-2021/styles/core.css?ver=1.5 | 38.7 KiB | 32.5 KiB |
Minifying CSS files can reduce network payload sizes. Learn how to minify CSS.
Performance issues directly impact user engagement and conversion rates.
| URL | Transfer Size | Est Savings |
|---|---|---|
| www.w3.org/assets/website-2021/styles/core.css?ver=1.5 | 39.3 KiB | 14.6 KiB |
| www.w3.org/assets/website-2021/styles/advanced.css?ver=1.5 | 10.4 KiB | 3.9 KiB |
Minifying JavaScript files can reduce payload sizes and script parse time. Learn how to minify JavaScript.
Performance issues directly impact user engagement and conversion rates.
| URL | Transfer Size | Est Savings |
|---|---|---|
| www.w3.org/assets/website-2021/js/main.js?ver=1.4 | 16.8 KiB | 6.0 KiB |
Set an explicit width and height on image elements to reduce layout shifts and improve CLS. Learn how to set image dimensions
Performance issues directly impact user engagement and conversion rates.
| URL | |
|---|---|
W3C div.global-nav__inner > a.logo-link > span.logo > img | www.w3.org/assets/logos/w3c-2025/svg/w3c.svg |
main#main > section.component > div.image > img main#main > section.component > div.image > img | www.w3.org/cms-uploads/_920xAUTO_crop_center-center_none/w30c-pattern.jpeg |
main#main > section.component > div.image > img main#main > section.component > div.image > img | /cms-uploads/_920xAUTO_crop_center-center_none/ryan-quint... |
main#main > section.component > div.image > img main#main > section.component > div.image > img | /cms-uploads/_920xAUTO_crop_center-center_none/marvin-mey... |
Taiwan Digital Publishing Forum div.component--members__grid > figure > div.l-box > img | www.w3.org/thumbnails/250/logos/organizations/110285.png?x-version=1 |
1Password div.component--members__grid > figure > div.l-box > img | www.w3.org/thumbnails/250/logos/organizations/131682.png?x-version=1 |
Entersekt div.component--members__grid > figure > div.l-box > img | www.w3.org/thumbnails/250/logos/organizations/116845.png?x-version=4 |
Capital One Financial div.component--members__grid > figure > div.l-box > img | www.w3.org/thumbnails/250/logos/organizations/98428.png?x-version=1 |
Web3D Consortium div.component--members__grid > figure > div.l-box > img | www.w3.org/thumbnails/250/logos/organizations/7211.png?x-version=1 |
Evinced Inc. div.component--members__grid > figure > div.l-box > img | www.w3.org/thumbnails/250/logos/organizations/154738.png?x-version=1 |
More information about the performance of your application. These numbers don't directly affect the Performance score.
Redirects introduce additional delays before the page can be loaded. Learn how to avoid page redirects.
Performance issues directly impact user engagement and conversion rates.
| URL | Time Spent |
|---|---|
| w3.org/ | 259 ms |
| www.w3.org/ | 0.0 ms |
These checks highlight opportunities to improve the accessibility of your web app. Automatic detection can only detect a subset of issues and does not guarantee the accessibility of your web app, so manual testing is also encouraged.
These checks ensure that your page is following basic search engine optimization advice. There are many additional factors Lighthouse does not score here that may affect your search ranking, including performance on Core Web Vitals. Learn more about Google Search Essentials.
Send Feedback