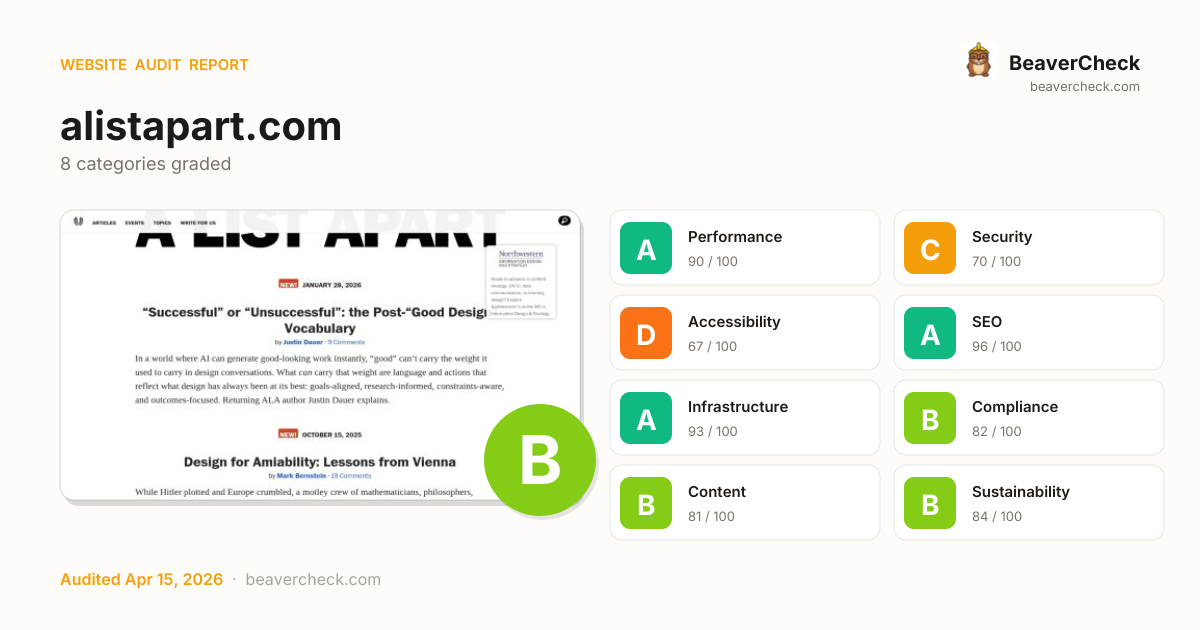
Audit overview
Accessibility needs attention; the rest of the categories are in good shape.
Fix Priority Matrix
5 findingsQuick Wins
3High impact, low effort — start here.
Strategic
2High impact, requires investment.
Easy Improvements
0Small gains, minimal effort.
Nothing in this quadrant — good news.
Deprioritize
0Low impact, high effort — do last.
Nothing in this quadrant — good news.
Screenshots


Top Priorities (5)
1 control(s) without accessible label
Form controls without labels — assistive tech announces 'edit text' with no context; users can't complete forms.
No H1 heading found
No H1 means screen-reader users can't identify the page's primary topic, and Google's content-extraction degrades.
12 third-party resources (47% of weight)
Informational: third-party resource count and their share of page weight. High share caps perf gains from frontend optimization.
Cross-Origin-Embedder-Policy header is missing
COEP enforces that all embedded resources opt-in to cross-origin embedding — required for cross-origin isolation features.
Cross-Origin-Opener-Policy header is missing
COOP isolates your top-level browsing context from cross-origin windows — without it, popup-based side-channel attacks remain possible.
Business case
What fixing the audit's findings is worth -- and what ignoring them keeps costing.
Return on investment
$242 investment → $4,129/month returns + USD 157,500 risk avoided
Figures combine localized regulatory fine ceilings, search/conversion value priced against local CPC, and bandwidth waste estimates. Results depend on implementation quality and audience composition. Not legal or financial advice.
Conversion barriers
5 barrier(s) likely increasing bounce by ~15%.
- 7 broken link(s) on the pageClicks land on 404s — trust drops and the session often ends→ Fix or remove the broken destinations surfaced on the Content tab
- No HSTS headerReturning visitors are briefly exposed to downgrade attacks on first request→ Set Strict-Transport-Security: max-age=31536000; includeSubDomains
- No Content-Security-Policy headerHigher XSS blast radius — one compromised script can exfiltrate the checkout form→ Ship a reporting-only CSP first, then enforce once violations are clean
- 1 form field(s) without a labelScreen readers skip unlabeled fields; autofill can't identify them; checkout abandonment spikes→ Associate every input with a visible <label for="…">; add autocomplete attributes
- No structured dataNo rich-result eligibility in Google — lower SERP CTR vs competitors with stars and prices→ Add JSON-LD for your page type (Product, Article, FAQPage, LocalBusiness, …)
Preliminary CRO audit — each barrier links to the tab with detailed analysis.
Remediation cost
Start here for the best return on investment
Cost by category
Cost by effort level
Adjust assumptions
Team composition
Multiplier applied to dev hours to reflect QA, design, and PM overhead. Use Dev only for solo work; Full team for projects with formal review processes.
Rates reflect fully-loaded developer cost including overhead
Warning:Cost of inaction
Compliance Risk
$157,500
- No privacy policy link detectedCCPA/CPRA: USD 2,500 – USD 7,500
- Trackers detected but no cookie policy foundCCPA/CPRA: USD 2,500 – USD 7,500
- Trackers detected but no privacy policy foundCCPA/CPRA: USD 2,500 – USD 7,500
Bounce-Rate Cost
$4,129 /mo
+15.3pp bounce · ~1,535 lost visitors/mo
CPC: USD 2.69
Bandwidth Waste
$0.10 /mo
1255.9 MB/mo × 0.080 USD/GB
- Optimize transfer: save ~126 KB per page loadSaves $0.10/mo
Compliance figures represent the statutory maximum fine for the most severe triggered category, capped per regulation — not the sum of per-finding penalties. Based on published regulatory fine ranges. This is not legal advice.
Unique monthly visitors from your analytics
Purchases, signups, or key actions
Optional — for revenue estimation
more engaged visitors from reduced bounce
Fix 2 critical issues to capture this value
How this is calculated
Based on Google/Deloitte research ("Milliseconds Make Millions") showing a ~7% bounce rate increase per additional second of LCP above the 2.5s "Good" threshold.
Your site's LCP: → estimated after fixes.
These are estimates based on industry research — actual results vary
Your data stays in your browser — nothing is sent to our servers
Lighthouse
Mobile
First Contentful Paint First Contentful Paint — how long until the browser renders the first piece of content. Under 1.8s is good.
1.70 s
Largest Contentful Paint Largest Contentful Paint — how long until the largest visible element loads. Under 2.5s is good.
2.41 s
Total Blocking Time Total Blocking Time — total time the main thread was blocked, preventing user input. Under 200ms is good.
62 ms
Cumulative Layout Shift Cumulative Layout Shift — measures visual stability. How much the page layout shifts during loading. Under 0.1 is good.
0.011
Speed Index Speed Index — how quickly content is visually displayed during load. Under 3.4s is good.
1.70 s
Time to Interactive Time to Interactive — how long until the page is fully interactive and responds to user input. Under 3.8s is good.
4.13 s
Desktop
First Contentful Paint First Contentful Paint — how long until the browser renders the first piece of content. Under 1.8s is good.
405 ms
Largest Contentful Paint Largest Contentful Paint — how long until the largest visible element loads. Under 2.5s is good.
605 ms
Total Blocking Time Total Blocking Time — total time the main thread was blocked, preventing user input. Under 200ms is good.
0 ms
Cumulative Layout Shift Cumulative Layout Shift — measures visual stability. How much the page layout shifts during loading. Under 0.1 is good.
0.018
Speed Index Speed Index — how quickly content is visually displayed during load. Under 3.4s is good.
405 ms
Time to Interactive Time to Interactive — how long until the page is fully interactive and responds to user input. Under 3.8s is good.
605 ms
Categories
8Performance
12 third-party resources (47% of weight)
Security
Cross-Origin-Embedder-Policy header is missing
Accessibility
1 control(s) without accessible label
SEO
All checks pass
Infrastructure
All checks pass
Compliance
All checks pass
Content
All checks pass
Sustainability
All checks pass
How you compare
Where this site stands against peers running the same stack.
Top 10% of WordPress sites score 97+ on Content; you're at 81 — closing this gap is the highest-leverage improvement.
Top 10% of Google Search Console sites score 96+ on Content; you're at 81 — closing this gap is the highest-leverage improvement.
Technology stack
WordPress, on PHP, hosted on wp.cloud, with Nginx CDN
Stack Architecture
 Gauges
  Google Analytics
  Google Tag Manager
  WordPress
  HTTP/3
  MySQL
MySQL  Open Graph
  Priority Hints
  Prism 1.0
 RSS Twitter Emoji (Twemoji)
  jQuery 3.7.1 jQuery Migrate 3.4.1
 PHP
PHP  Nginx
Nginx  wp.cloud
 All Detected Technologies (19)
Nginx is a web server that can also be used as a reverse proxy, load balancer, mail proxy and HTTP cache.
WordPress-first cloud hosting.
PHP is a general-purpose scripting language used for web development.
WordPress is a free and open-source content management system written in PHP and paired with a MySQL or MariaDB database. Features include a plugin architecture and a template system.
HTTP Strict Transport Security (HSTS) informs browsers that the site should only be accessed using HTTPS.
HTTP/3 is the third major version of the Hypertext Transfer Protocol used to exchange information on the World Wide Web.
MySQL is an open-source relational database management system.
Open Graph is a protocol that is used to integrate any web page into the social graph.
Priority Hints exposes a mechanism for developers to signal a relative priority for browsers to consider when fetching resources.
Prism is an extensible syntax highlighter.
RSS is a family of web feed formats used to publish frequently updated works—such as blog entries, news headlines, audio, and video—in a standardized format.
Twitter Emoji is a set of open-source emoticons and emojis for Twitter, TweetDeck, and also for Android and iOS versions of the application.
jQuery is a JavaScript library which is a free, open-source software designed to simplify HTML DOM tree traversal and manipulation, as well as event handling, CSS animation, and Ajax.
Query Migrate is a javascript library that allows you to preserve the compatibility of your jQuery code developed for versions of jQuery older than 1.9.
Gauges is a real-time web analytics tool that provides live traffic updates and essential metrics for websites.
Google Analytics is a free web analytics service that tracks and reports website traffic.
Google Tag Manager is a tag management system (TMS) that allows you to quickly and easily update measurement codes and related code fragments collectively known as tags on your website or mobile app.
Observations (3)
WordPress detected — review security configuration
WordPress sites benefit from: protecting wp-login.php, disabling XML-RPC if unused, restricting REST API access, and keeping all plugins and themes up to date. Check the Security tab for specific findings.
No build tool detected
A framework (Google Search Console) was detected but no bundler was identified. The build tool may not be detectable from output patterns, or the site may use the framework's built-in bundler.
Complex technology stack detected
19 technologies identified. A complex stack increases maintenance burden and attack surface. Consider whether all components are actively needed.
Show your score
Drop this badge on your README, marketing site, or status page. It auto-updates every time the audit re-runs and links back to this report.
This badge auto-updates with your latest scan result.
[](https://beavercheck.com/results/6df1366b-8004-4f82-9319-ceac9167aa90)<a href="https://beavercheck.com/results/6df1366b-8004-4f82-9319-ceac9167aa90"><img src="https://beavercheck.com/badge?url=https%3A%2F%2Falistapart.com" alt="BeaverCheck Score"></a>https://beavercheck.com/badge?url=https%3A%2F%2Falistapart.comExport & share
Download the audit, share with your team, or grab a fix plan ready to copy into your tracker.
Copies markdown to clipboard
Fix Plan
Three-week roadmap to ship the audit's findings, with one-click copy targets for your tracker.
Three-week fix plan
2 sprints · 2h total → projected B (87)
Sprint 1: Quick Wins
+4Highest ROI — low effort, high impact
- · No H1 heading found
- · 12 third-party resources (47% of weight)
- · Cross-Origin-Opener-Policy header is missing
Sprint 2: Core Fixes
+2Medium effort, high structural impact
- · 1 control(s) without accessible label
- · Cross-Origin-Embedder-Policy header is missing