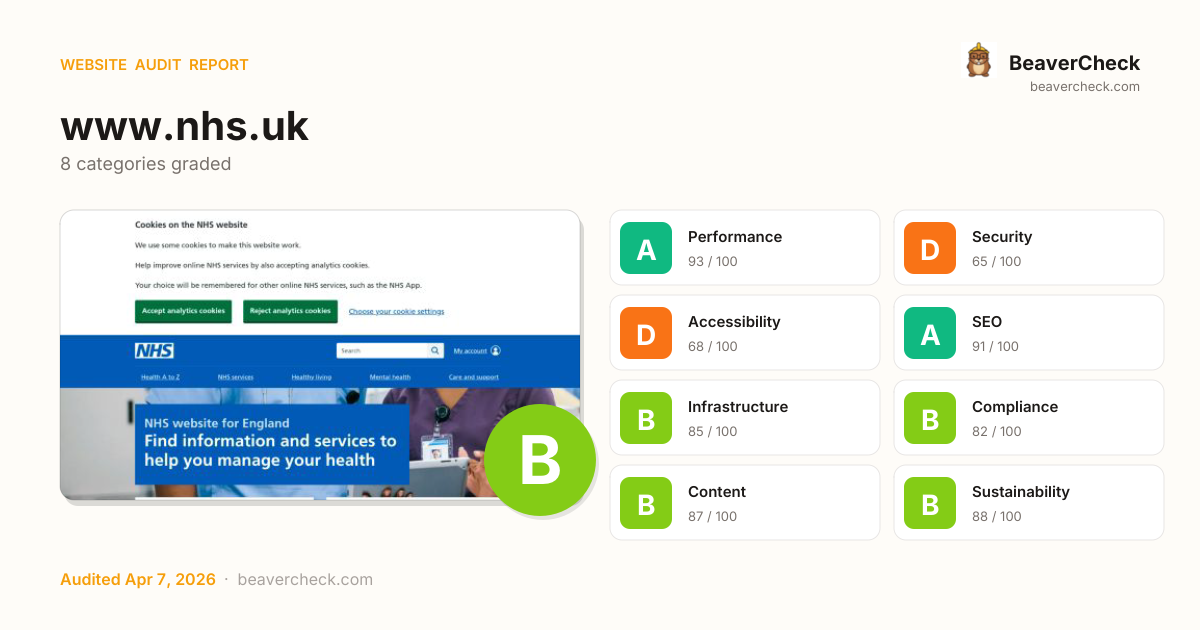
Audit overview
Security and Accessibility need attention; the other categories are in good shape.
Fix Priority Matrix
5 findingsQuick Wins
2High impact, low effort — start here.
Strategic
3High impact, requires investment.
Easy Improvements
0Small gains, minimal effort.
Nothing in this quadrant — good news.
Deprioritize
0Low impact, high effort — do last.
Nothing in this quadrant — good news.
Screenshots

Top Priorities (5)
Content-Security-Policy header is missing
Without a CSP, a single XSS bug can exfiltrate everything your users type — including credentials.
No Content-Security-Policy header found
Without a CSP, a single XSS bug can exfiltrate everything users type — credentials, payment data, session tokens.
Cross-Origin-Embedder-Policy header is missing
COEP enforces that all embedded resources opt-in to cross-origin embedding — required for cross-origin isolation features.
Cross-Origin-Opener-Policy header is missing
COOP isolates your top-level browsing context from cross-origin windows — without it, popup-based side-channel attacks remain possible.
External script from assets.adobedtm.com lacks integrity attribute
External resource without SRI — if the third-party CDN is compromised, your site executes attacker-controlled code.
Business case
What fixing the audit's findings is worth -- and what ignoring them keeps costing.
Return on investment
£581 investment → £7,855/month returns + GBP 17,500,000 risk avoided
Figures combine localized regulatory fine ceilings, search/conversion value priced against local CPC, and bandwidth waste estimates. Results depend on implementation quality and audience composition. Not legal or financial advice.
Conversion barriers
6 barrier(s) likely increasing bounce by ~27%.
- Page takes 4.5s to loadUsers abandon at ~3s — you're 2.0s over the 2.5s threshold→ Optimize render-blocking resources, preload the hero image, and compress images
- Severe layout shift during page loadUsers mis-click when content jumps — converting intent into frustration→ Reserve space for images, ads, and embeds with explicit width/height
- No HSTS headerReturning visitors are briefly exposed to downgrade attacks on first request→ Set Strict-Transport-Security: max-age=31536000; includeSubDomains
- No Content-Security-Policy headerHigher XSS blast radius — one compromised script can exfiltrate the checkout form→ Ship a reporting-only CSP first, then enforce once violations are clean
- No structured dataNo rich-result eligibility in Google — lower SERP CTR vs competitors with stars and prices→ Add JSON-LD for your page type (Product, Article, FAQPage, LocalBusiness, …)
Preliminary CRO audit — each barrier links to the tab with detailed analysis.
Remediation cost
Start here for the best return on investment
Cost by category
Cost by effort level
Adjust assumptions
Team composition
Multiplier applied to dev hours to reflect QA, design, and PM overhead. Use Dev only for solo work; Full team for projects with formal review processes.
Rates reflect fully-loaded developer cost including overhead
Warning:Cost of inaction
Compliance Risk
£17,500,000
- No privacy policy link detectedUK GDPR: GBP 10,000 – GBP 17,500,000
- Privacy Policy not detectedUK GDPR: GBP 10,000 – GBP 17,500,000
Bounce-Rate Cost
£5,729 /mo
+27.3pp bounce · ~2,728 lost visitors/mo
CPC: GBP 2.10
Bandwidth Waste
£0.12 /mo
1913.0 MB/mo × 0.063 GBP/GB
- Optimize transfer: save ~191 KB per page loadSaves £0.12/mo
Compliance figures represent the statutory maximum fine for the most severe triggered category, capped per regulation — not the sum of per-finding penalties. Based on published regulatory fine ranges. This is not legal advice.
Unique monthly visitors from your analytics
Purchases, signups, or key actions
Optional — for revenue estimation
more engaged visitors from reduced bounce
Fix 2 critical issues to capture this value
How this is calculated
Based on Google/Deloitte research ("Milliseconds Make Millions") showing a ~7% bounce rate increase per additional second of LCP above the 2.5s "Good" threshold.
Your site's LCP: → estimated after fixes.
These are estimates based on industry research — actual results vary
Your data stays in your browser — nothing is sent to our servers
Lighthouse
Mobile
First Contentful Paint First Contentful Paint — how long until the browser renders the first piece of content. Under 1.8s is good.
1.87 s
Largest Contentful Paint Largest Contentful Paint — how long until the largest visible element loads. Under 2.5s is good.
4.52 s
Total Blocking Time Total Blocking Time — total time the main thread was blocked, preventing user input. Under 200ms is good.
156 ms
Cumulative Layout Shift Cumulative Layout Shift — measures visual stability. How much the page layout shifts during loading. Under 0.1 is good.
0.495
Speed Index Speed Index — how quickly content is visually displayed during load. Under 3.4s is good.
3.28 s
Time to Interactive Time to Interactive — how long until the page is fully interactive and responds to user input. Under 3.8s is good.
4.52 s
Desktop
First Contentful Paint First Contentful Paint — how long until the browser renders the first piece of content. Under 1.8s is good.
497 ms
Largest Contentful Paint Largest Contentful Paint — how long until the largest visible element loads. Under 2.5s is good.
937 ms
Total Blocking Time Total Blocking Time — total time the main thread was blocked, preventing user input. Under 200ms is good.
0 ms
Cumulative Layout Shift Cumulative Layout Shift — measures visual stability. How much the page layout shifts during loading. Under 0.1 is good.
0.241
Speed Index Speed Index — how quickly content is visually displayed during load. Under 3.4s is good.
1.41 s
Time to Interactive Time to Interactive — how long until the page is fully interactive and responds to user input. Under 3.8s is good.
937 ms
Categories
8Performance
All checks pass
Security
Content-Security-Policy header is missing
Accessibility
All checks pass
SEO
All checks pass
Infrastructure
All checks pass
Compliance
All checks pass
Content
All checks pass
Sustainability
All checks pass
How you compare
Where this site stands against peers running the same stack.
Technology stack
Wagtail, on Python, hosted on Azure, with Azure CDN CDN
Stack Architecture
 Wagtail
  Webpack
  Azure Front Door
  Babel
Babel  Django HSTS
  Open Graph
  UIKit
UIKit  core-js 2.6.12
 Python Azure CDN Azure
 All Detected Technologies (12)
Azure is a cloud computing service for building, testing, deploying, and managing applications and services through Microsoft-managed data centers.
Python is an interpreted and general-purpose programming language.
Wagtail is a Django content management system (CMS) focused on flexibility and user experience.
Azure Front Door is a scalable and secure entry point for fast delivery of your global web applications.
Babel is a free and open-source transcompiler for writing next generation JavaScript.
Django is a Python-based free and open-source web application framework.
HTTP Strict Transport Security (HSTS) informs browsers that the site should only be accessed using HTTPS.
Open Graph is a protocol that is used to integrate any web page into the social graph.
UIKit is the framework used for developing iOS applications.
core-js is a modular standard library for JavaScript, with polyfills for cutting-edge ECMAScript features.
Observations (1)
Complex technology stack detected
12 technologies identified. A complex stack increases maintenance burden and attack surface. Consider whether all components are actively needed.
Show your score
Drop this badge on your README, marketing site, or status page. It auto-updates every time the audit re-runs and links back to this report.
This badge auto-updates with your latest scan result.
[](https://beavercheck.com/sites/www.nhs.uk)<a href="https://beavercheck.com/sites/www.nhs.uk"><img src="https://beavercheck.com/badge?url=https%3A%2F%2Fwww.nhs.uk" alt="BeaverCheck Score"></a>https://beavercheck.com/badge?url=https%3A%2F%2Fwww.nhs.ukExport & share
Download the audit, share with your team, or grab a fix plan ready to copy into your tracker.
Copies markdown to clipboard
Fix Plan
Three-week roadmap to ship the audit's findings, with one-click copy targets for your tracker.
Three-week fix plan
2 sprints · 8h total → projected B (86)
Sprint 1: Quick Wins
+2Highest ROI — low effort, high impact
- · Cross-Origin-Opener-Policy header is missing
- · External script from assets.adobedtm.com lacks integrity attribute
Sprint 2: Core Fixes
+4Medium effort, high structural impact
- · Content-Security-Policy header is missing
- · No Content-Security-Policy header found
- · Cross-Origin-Embedder-Policy header is missing